
PMC Dashboard Update (U.S.) 🧵1 of 8
The 11th wave is still rising.
🔥23 states/territories High/Very High
🔥Very High: Alabama, DC, Guam, Hawai'i, Louisiana, Nebraska, Nevada, South Carolina, Texas, Utah
🔥1 in 56 estimated actively infectious
🔥876,000 new daily infections
The 11th wave is still rising.
🔥23 states/territories High/Very High
🔥Very High: Alabama, DC, Guam, Hawai'i, Louisiana, Nebraska, Nevada, South Carolina, Texas, Utah
🔥1 in 56 estimated actively infectious
🔥876,000 new daily infections

PMC Dashboard Update (U.S.) 🧵2 of 8
Note that the CDC has modified 📉 how transmission levels correspond to the categorical bins.
Take California. We estimate 1 in 30 actively infectious statewide. This would have previously been "Very High," now just "High."
#NewNormal
Note that the CDC has modified 📉 how transmission levels correspond to the categorical bins.
Take California. We estimate 1 in 30 actively infectious statewide. This would have previously been "Very High," now just "High."
#NewNormal

PMC Dashboard Update (U.S.) 🧵3 of 8
Here are the prevalence estimates for the first half of states/territories.
Notice how high the levels are in some of the "Moderate" states.
Here are the prevalence estimates for the first half of states/territories.
Notice how high the levels are in some of the "Moderate" states.

PMC Dashboard Update (U.S.) 🧵4 of 8
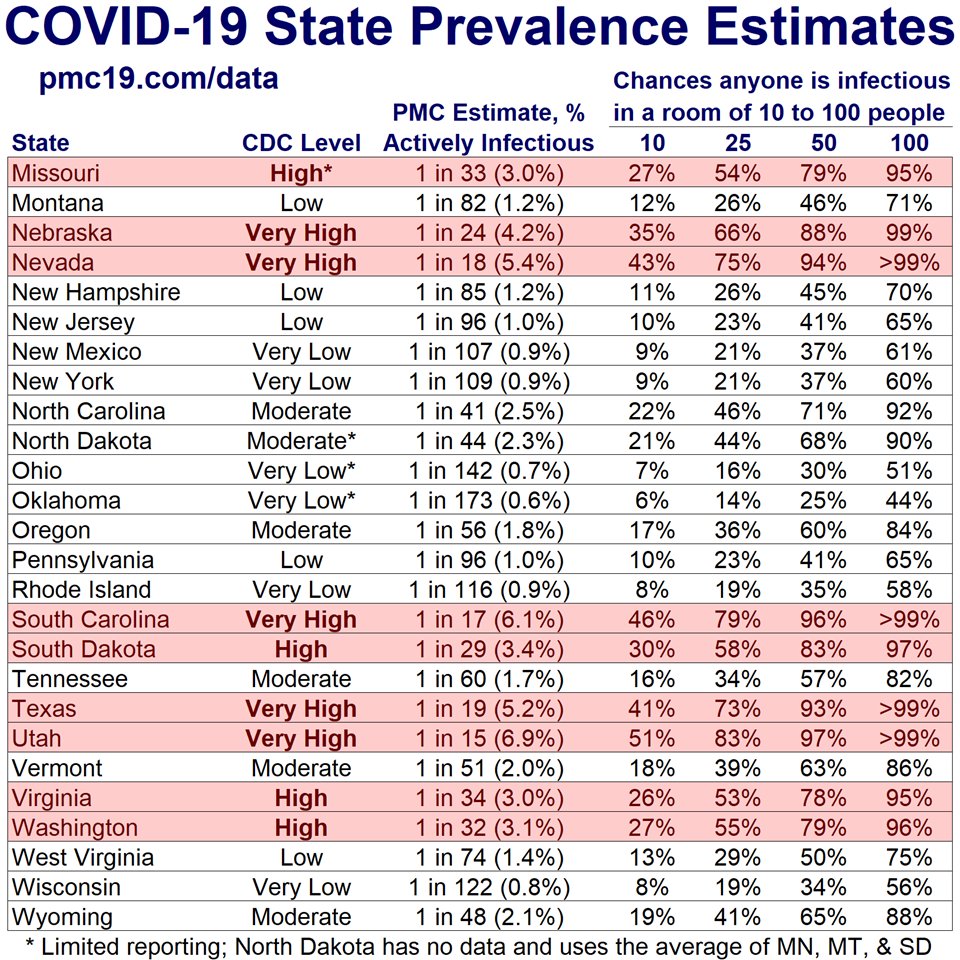
Here are the prevalence estimates for the second half of states/territories.
What's striking here is that you see some of the "Very Low" states like NY and NM are at nearly 1% actively infectious.
Here are the prevalence estimates for the second half of states/territories.
What's striking here is that you see some of the "Very Low" states like NY and NM are at nearly 1% actively infectious.
PMC Dashboard Update (U.S.) 🧵5 of 8
We're in an 11th COVlD wave.
Many are getting infected while waiting on delayed vaccine approvals. Millions more are being denied vaccine access entirely.
Few public health groups mention the importance of N95 masks and air purifiers.
We're in an 11th COVlD wave.
Many are getting infected while waiting on delayed vaccine approvals. Millions more are being denied vaccine access entirely.
Few public health groups mention the importance of N95 masks and air purifiers.

PMC Dashboard Update (U.S.) 🧵6 of 8
Based on Swiss Re actuarial data, we partition excess deaths according to wastewater levels & estimate up to 2,900 Americans will die from this week's infections.
They will be cardiovascular, cancer, & misc deaths. Rarely counted as C19.
Based on Swiss Re actuarial data, we partition excess deaths according to wastewater levels & estimate up to 2,900 Americans will die from this week's infections.
They will be cardiovascular, cancer, & misc deaths. Rarely counted as C19.

PMC Dashboard Update (U.S.) 🧵7 of 8
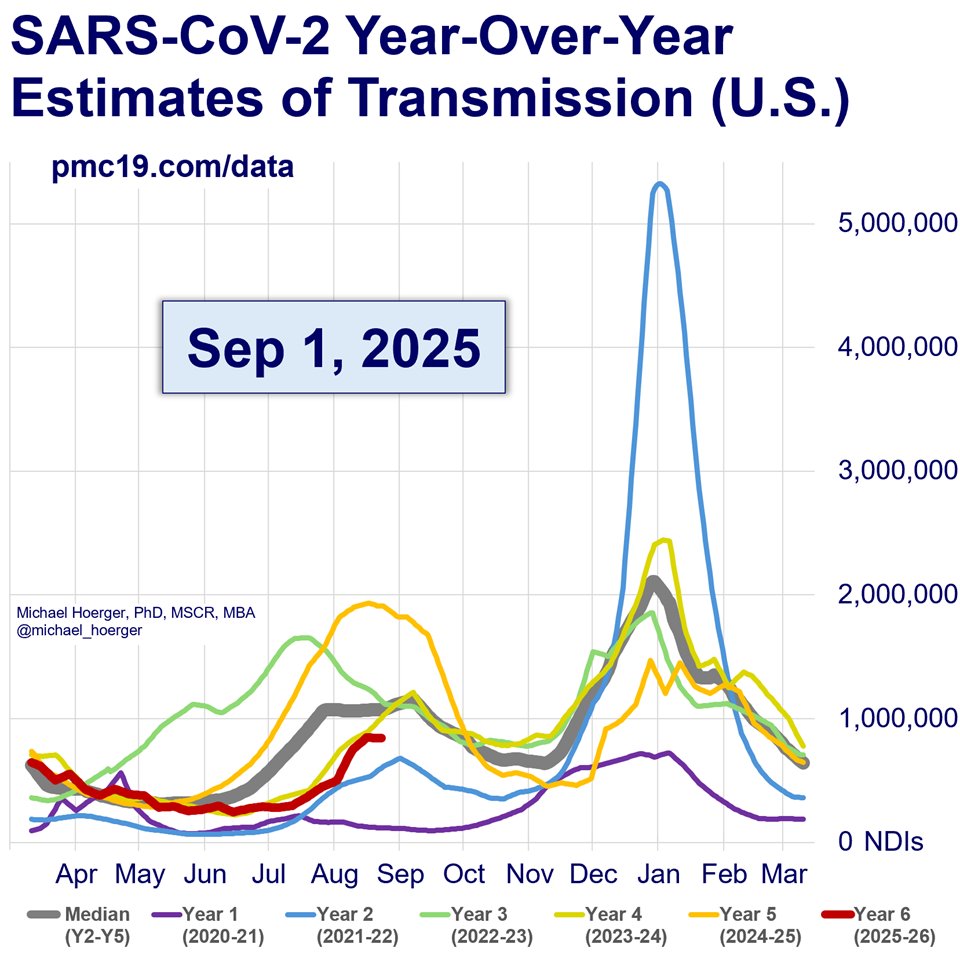
We just had the largest relative increase in summer transmission in 4 years.
But transmission has leveled off (red line). This is atypical based on the most similar prior waves (blue, yellow).
We may so a retroactive correction upward.
We just had the largest relative increase in summer transmission in 4 years.
But transmission has leveled off (red line). This is atypical based on the most similar prior waves (blue, yellow).
We may so a retroactive correction upward.
PMC Dashboard Update (U.S.) 🧵8 of 8
We have improved the forecasting model, especially for summer waves, but have increased the expected level of error in real-time reporting (CDC corrections, Biobot lags), which yields broader confidence intervals.
If the CDC retroactively corrects the most recent real-time data upward, which is plausible, we could head toward 1.2-1.5 million new daily infections. If the numbers hold, the peak will be closer to 0.9 to 1.0 million new daily infections and occur around Sept 6. Significant transmission occurs on the back end of waves. Most people won't even realize we're in a wave until mid to late September.
I don't envision a more optimistic scenario but hope for it.

Find the full report at
I'll post plenty of explainer posts over the next 2 weeks. Please also use, improve, and share widely. I'm mostly here and on IG these days.pmc19.com/data
I'll post plenty of explainer posts over the next 2 weeks. Please also use, improve, and share widely. I'm mostly here and on IG these days.pmc19.com/data
• • •
Missing some Tweet in this thread? You can try to
force a refresh


