The 3 types of machine learning (that every data scientist should know).
In 3 minutes I'll eviscerate your confusion. Let's go: 🧵
In 3 minutes I'll eviscerate your confusion. Let's go: 🧵
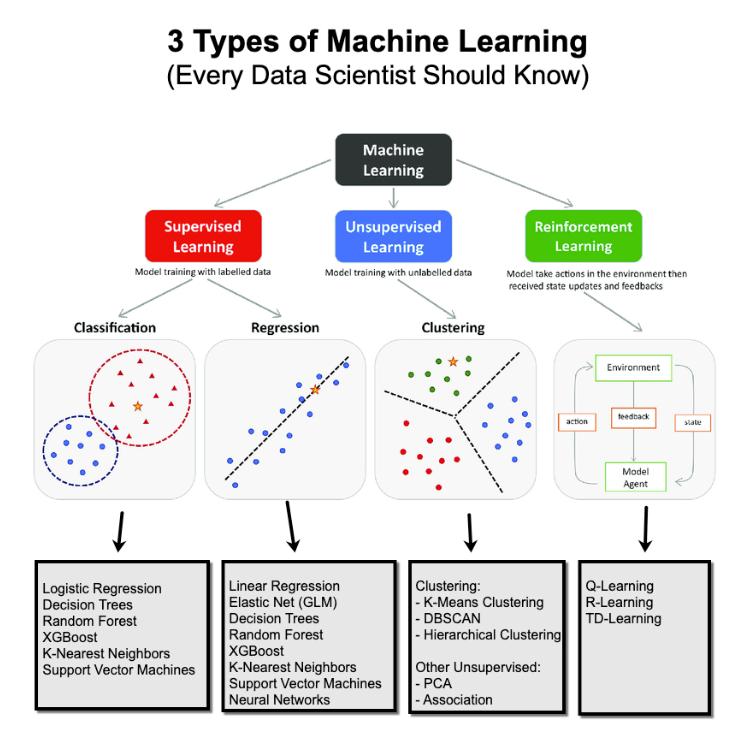
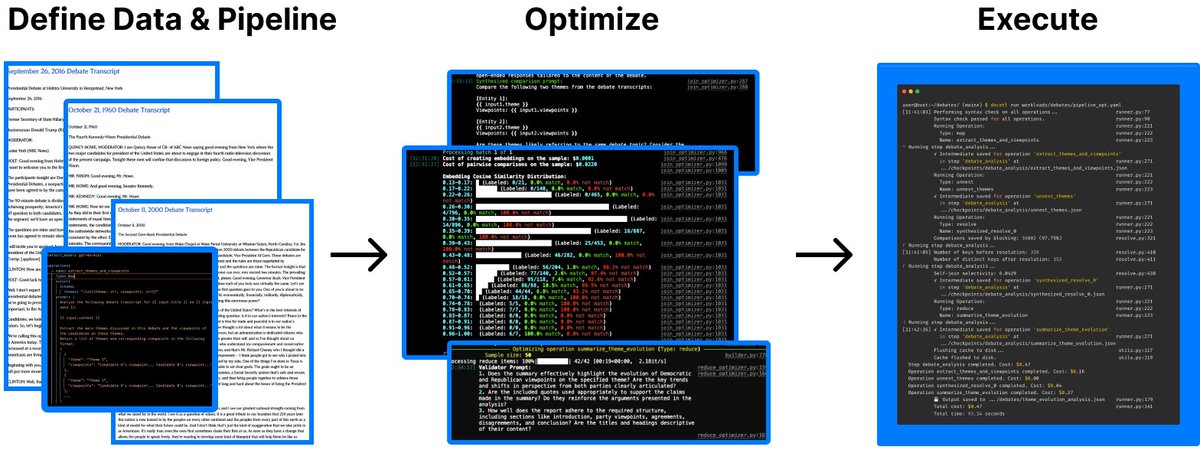
1. The 3 Fundamental Types of Machine Learning:
- Supervised Learning
- Unsupervised Learning
- Reinforcement Learning.
Let's break them down:
- Supervised Learning
- Unsupervised Learning
- Reinforcement Learning.
Let's break them down:
2. Supervised Learning:
Supervised Learning maps a set of inputs (features) to an output (target). There are 2 types: Classification and Regression.
Supervised Learning maps a set of inputs (features) to an output (target). There are 2 types: Classification and Regression.
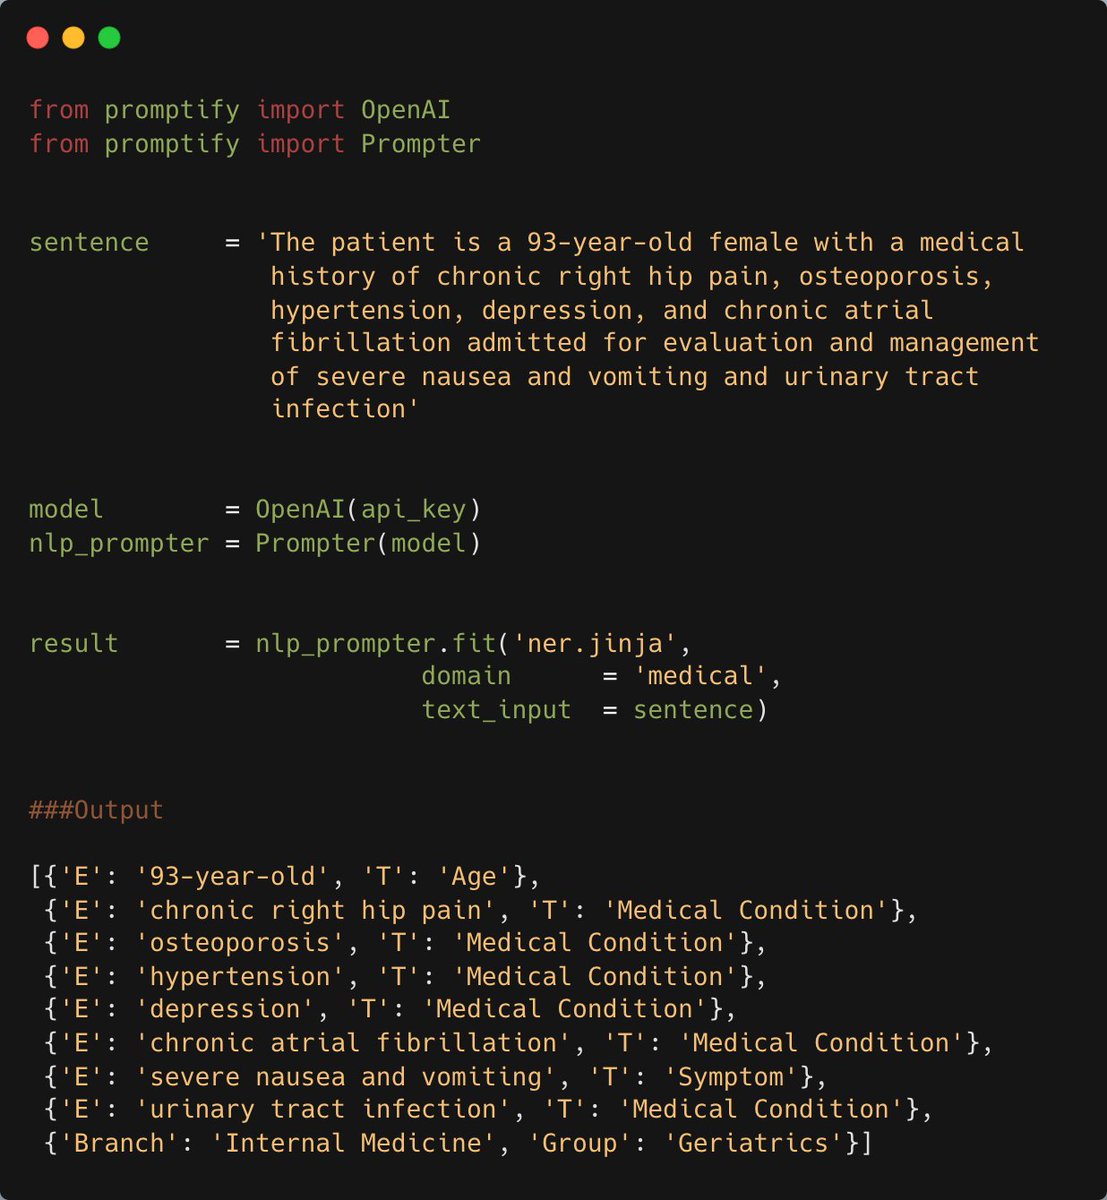
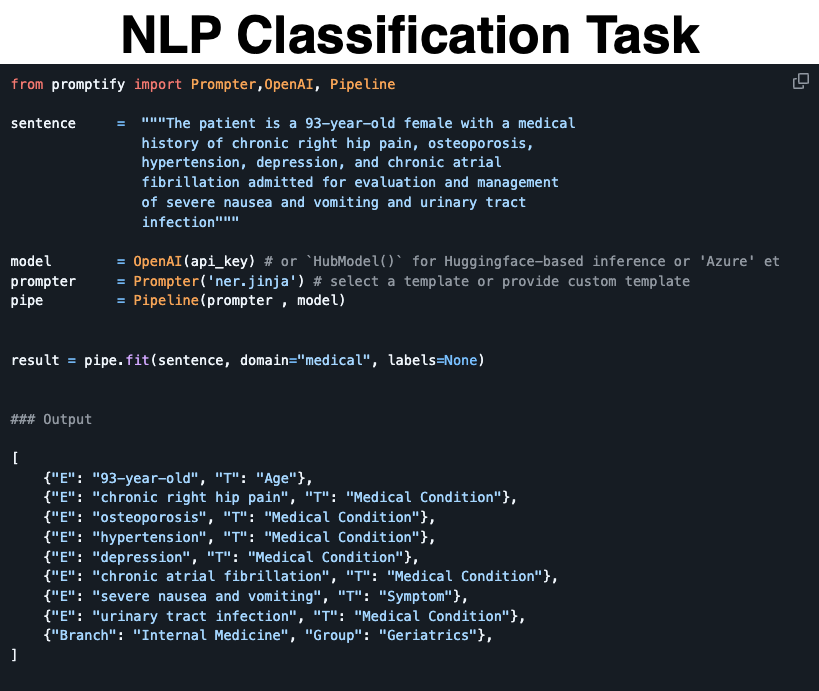
Classification:
Identifying the category that something belongs to. Often I use Binary Classification for lead scoring to get a class probability (the probability from 0 to 1 of how likely the rowwise observation belongs to a class). Think non-buyer or buyer. 0 or 1. Binary Classification.
Identifying the category that something belongs to. Often I use Binary Classification for lead scoring to get a class probability (the probability from 0 to 1 of how likely the rowwise observation belongs to a class). Think non-buyer or buyer. 0 or 1. Binary Classification.
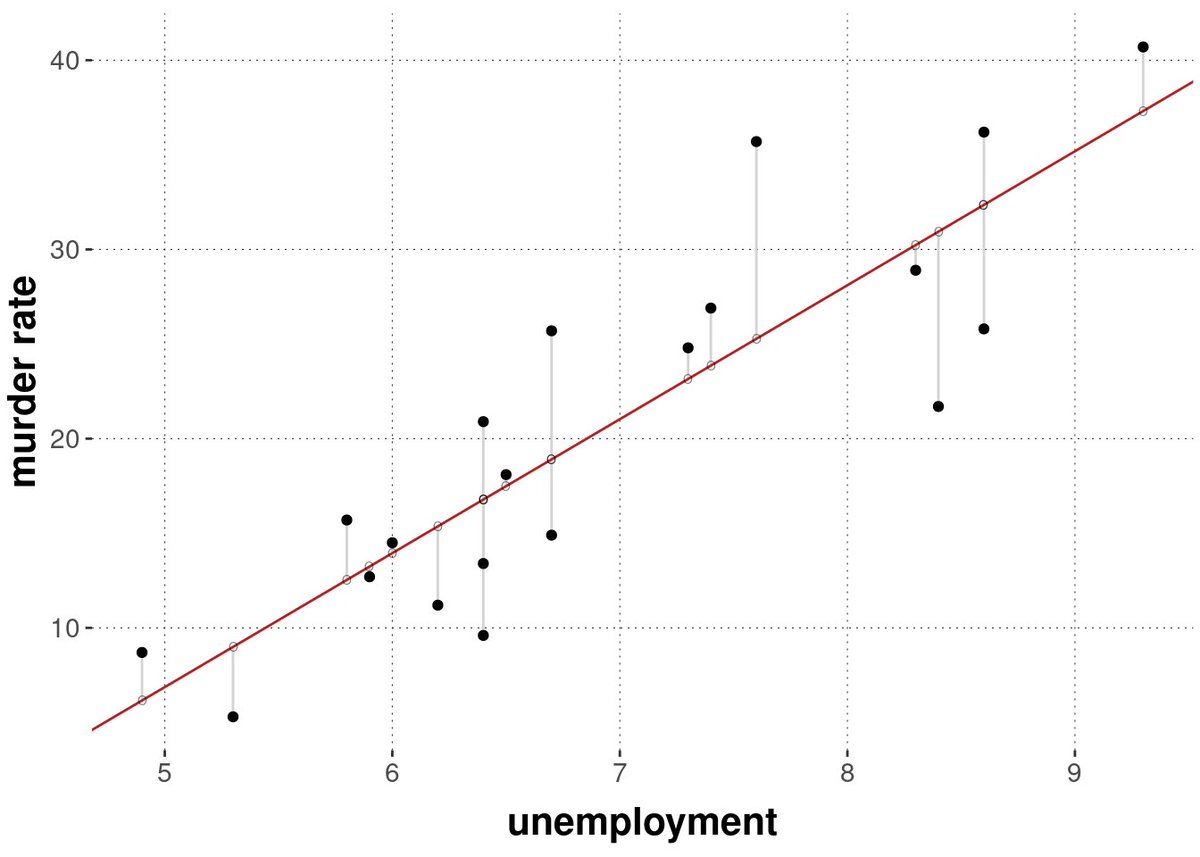
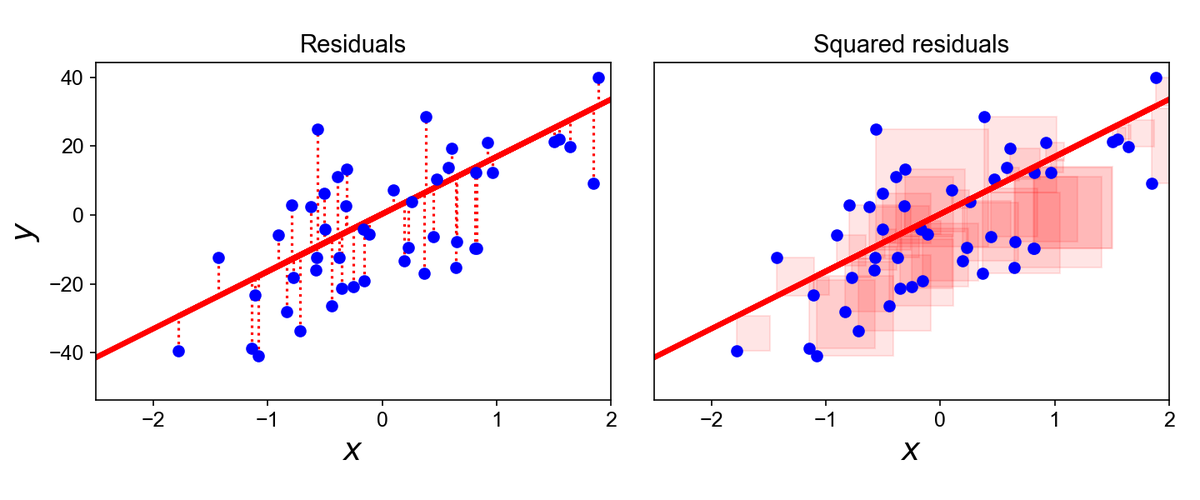
Regression:
Predicting a continuous value. I commonly use Regression for predicting future values of sales demand. It's a special type of regression called Forecasting.
Predicting a continuous value. I commonly use Regression for predicting future values of sales demand. It's a special type of regression called Forecasting.
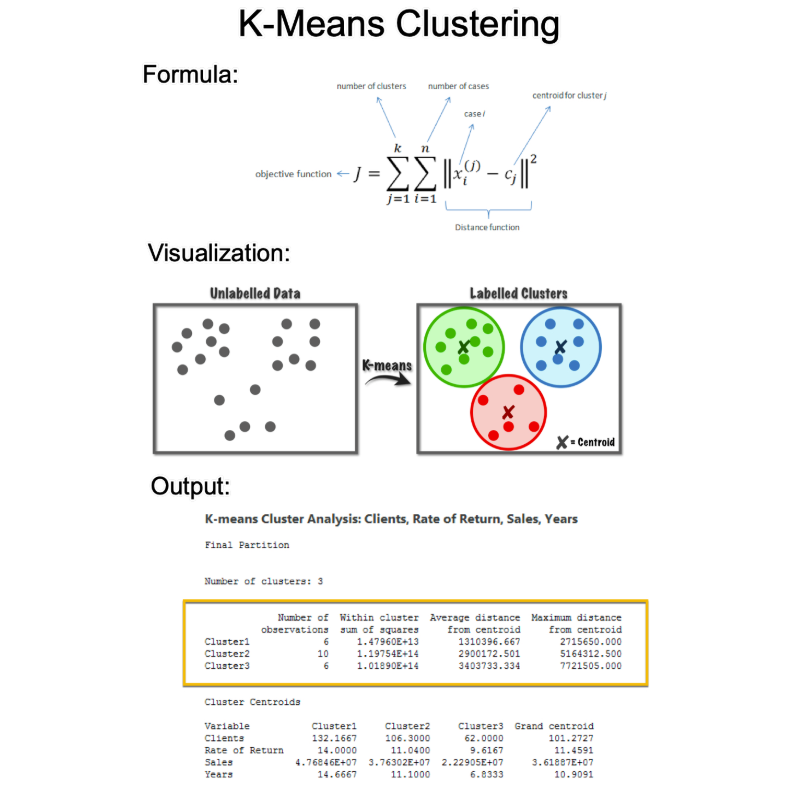
3. Unsupervised Learning:
Unsupervised learning is extracting insights from unlabelled data.
The 2 main types I use are clustering and dimensionality reduction.
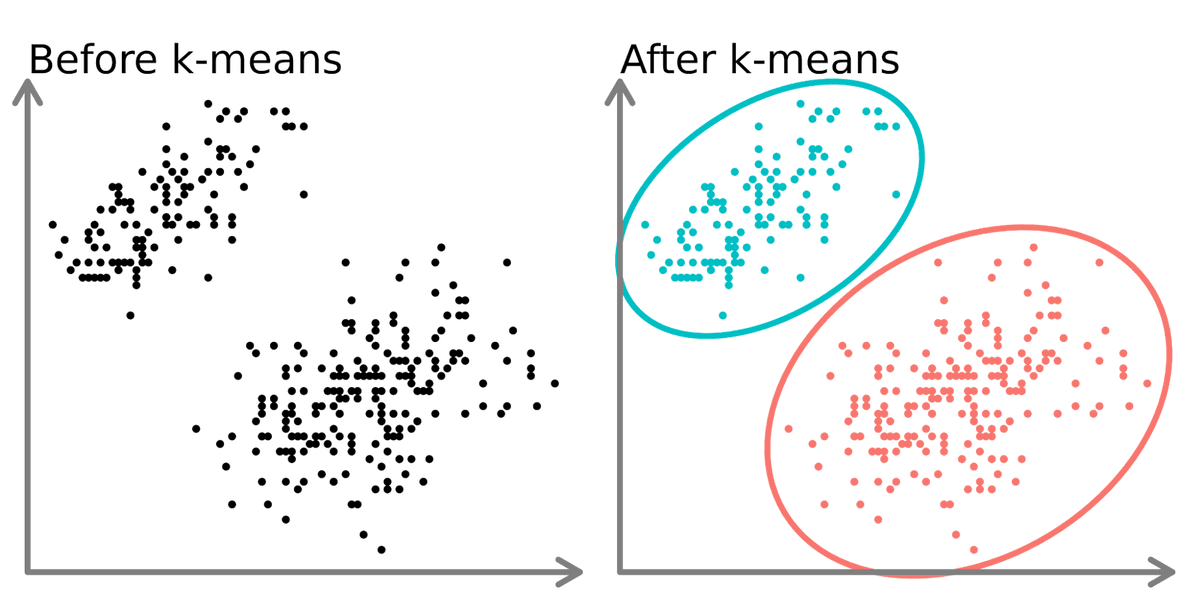
- K-means is the most common clustering algorithm I use, often for clustering customers based on their similarities. I use
- PCA to reduce the number of columns so other supervised machine learning algorithms run more efficiently and to visualize clusters.
Unsupervised learning is extracting insights from unlabelled data.
The 2 main types I use are clustering and dimensionality reduction.
- K-means is the most common clustering algorithm I use, often for clustering customers based on their similarities. I use
- PCA to reduce the number of columns so other supervised machine learning algorithms run more efficiently and to visualize clusters.
4. Reinforcement Learning:
The idea is that the software learns to take actions based on the accumulation of reward. This is the underlying concept of "AI" or Artificial Intelligence, where the software learns to think.
The idea is that the software learns to take actions based on the accumulation of reward. This is the underlying concept of "AI" or Artificial Intelligence, where the software learns to think.
There's a new problem that has surfaced --
Companies NOW want AI.
AI is the single biggest force of our decade. Yet 99% of data scientists are ignoring it.
That's a huge advantage to you. I'd like to help.
Companies NOW want AI.
AI is the single biggest force of our decade. Yet 99% of data scientists are ignoring it.
That's a huge advantage to you. I'd like to help.
Want to become a Generative AI Data Scientist in 2025 ($200,000 career)?
On Wednesday, Sept 3rd, I'm sharing one of my best AI Projects: How I built an AI Customer Segmentation Agent with Python
Register here (limit 500 seats): learn.business-science.io/registration-a…
On Wednesday, Sept 3rd, I'm sharing one of my best AI Projects: How I built an AI Customer Segmentation Agent with Python
Register here (limit 500 seats): learn.business-science.io/registration-a…
That's a wrap! Over the next 24 days, I'm sharing the 24 concepts that helped me become an AI data scientist.
If you enjoyed this thread:
1. Follow me @mdancho84 for more of these
2. RT the tweet below to share this thread with your audience
If you enjoyed this thread:
1. Follow me @mdancho84 for more of these
2. RT the tweet below to share this thread with your audience
https://twitter.com/815555071517872128/status/1963203653168169246
P.S. I create AI + Data Science tutorials and share them for free. Your 👍 like and ♻️ repost helps keep me going.
• • •
Missing some Tweet in this thread? You can try to
force a refresh