K-means is an essential algorithm for Data Science.
But it's confusing for beginners.
Let me demolish your confusion:
But it's confusing for beginners.
Let me demolish your confusion:
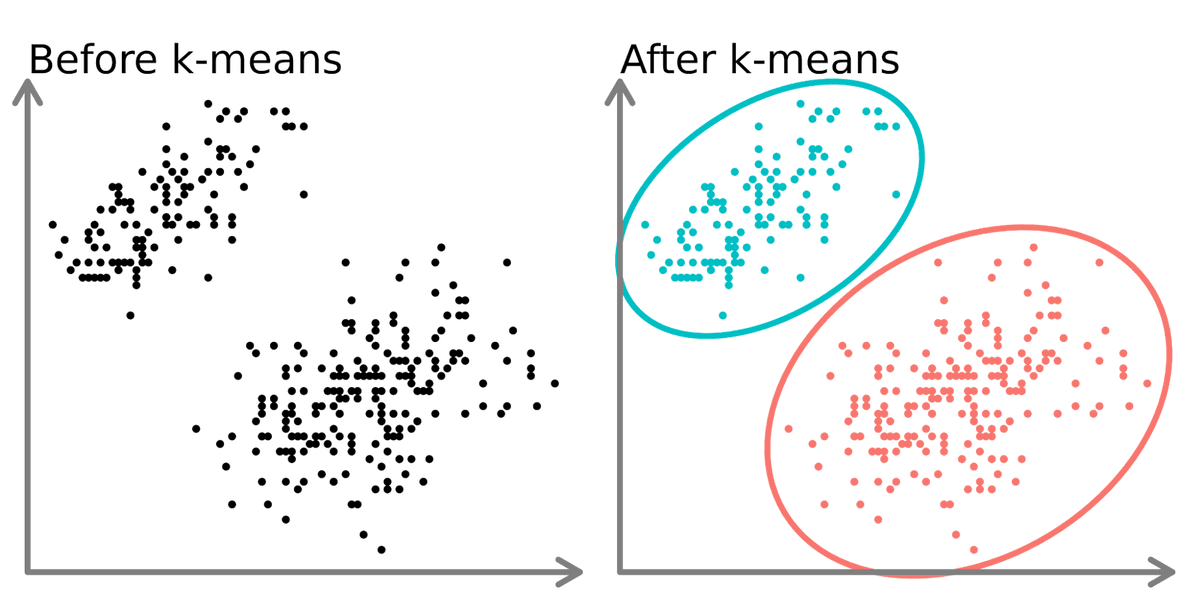
1. K-Means
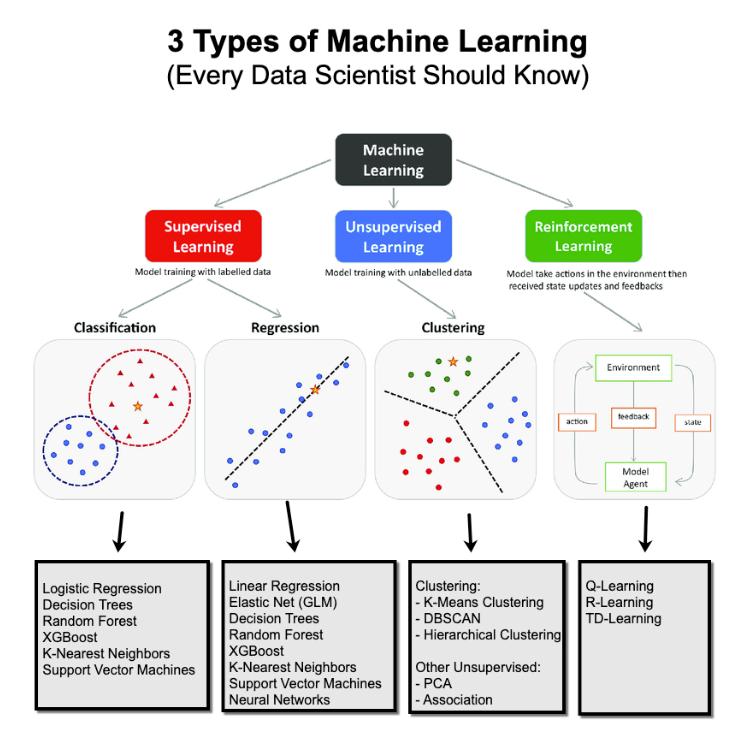
K-means is a popular unsupervised machine learning algorithm used for clustering. It's a core algorithm used for customer segmentation, inventory categorization, market segmentation, and even anomaly detection.
K-means is a popular unsupervised machine learning algorithm used for clustering. It's a core algorithm used for customer segmentation, inventory categorization, market segmentation, and even anomaly detection.
2. Unsupervised:
K-means is an unsupervised algorithm used on data with no labels or predefined outcomes. The goal is not to predict a target output, but to explore the structure of the data by identifying patterns, clusters, or relationships within the dataset.
K-means is an unsupervised algorithm used on data with no labels or predefined outcomes. The goal is not to predict a target output, but to explore the structure of the data by identifying patterns, clusters, or relationships within the dataset.
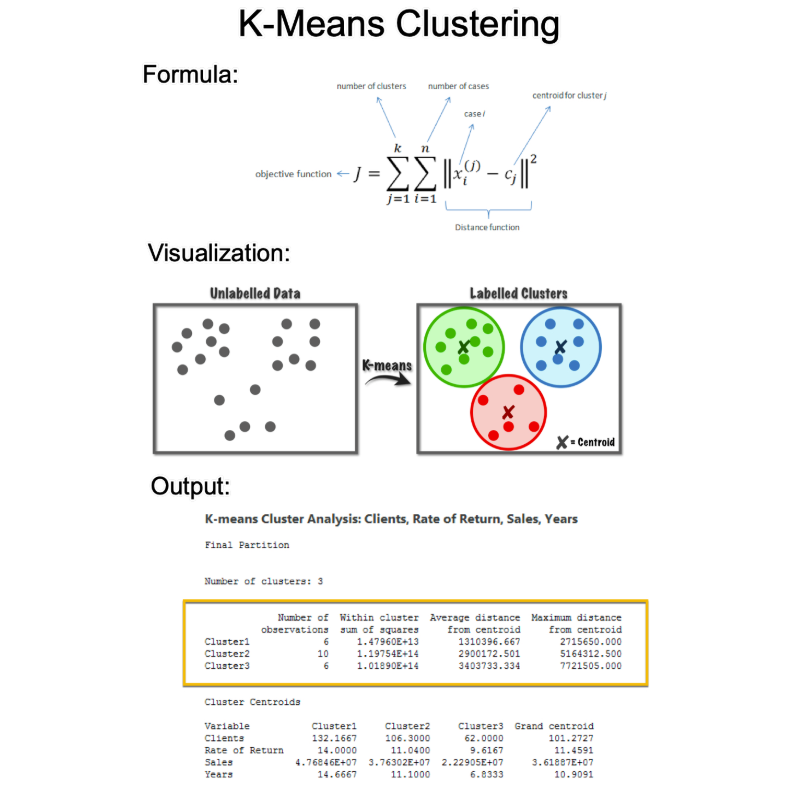
3. Objective Function:
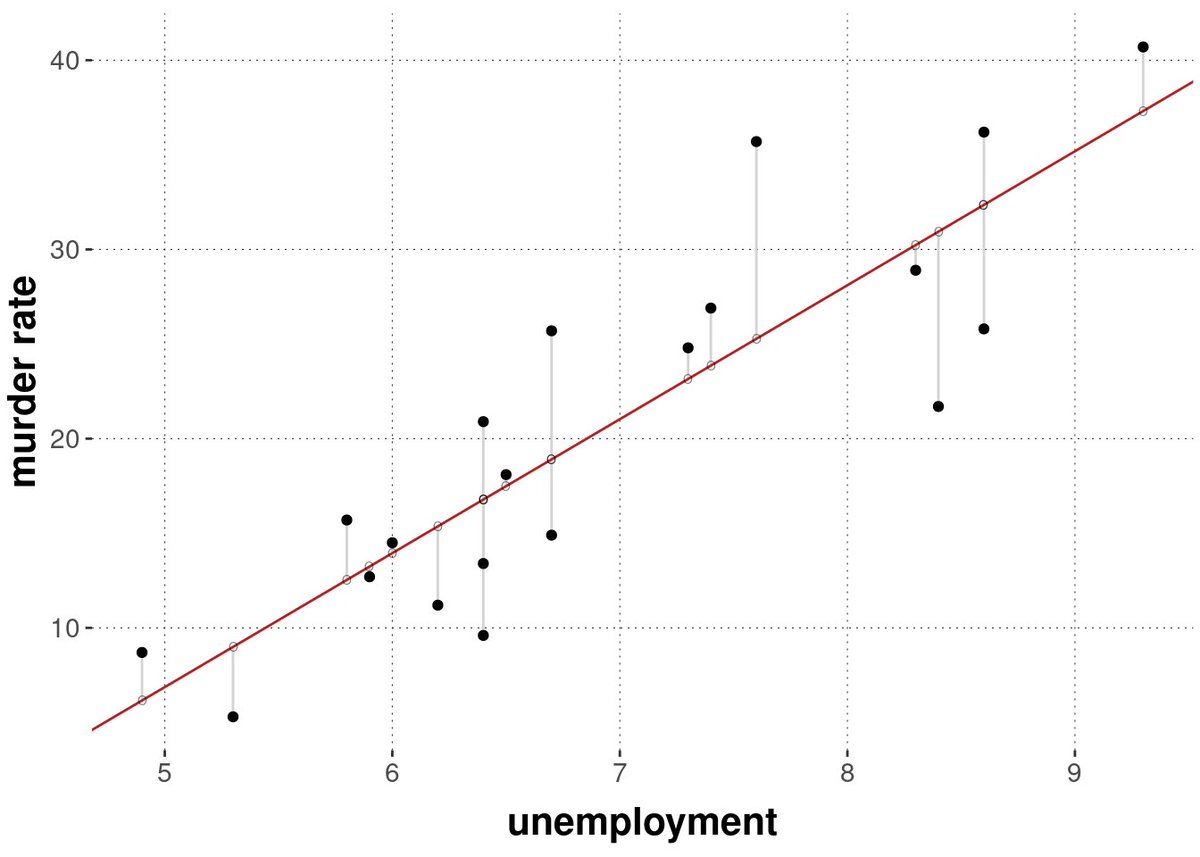
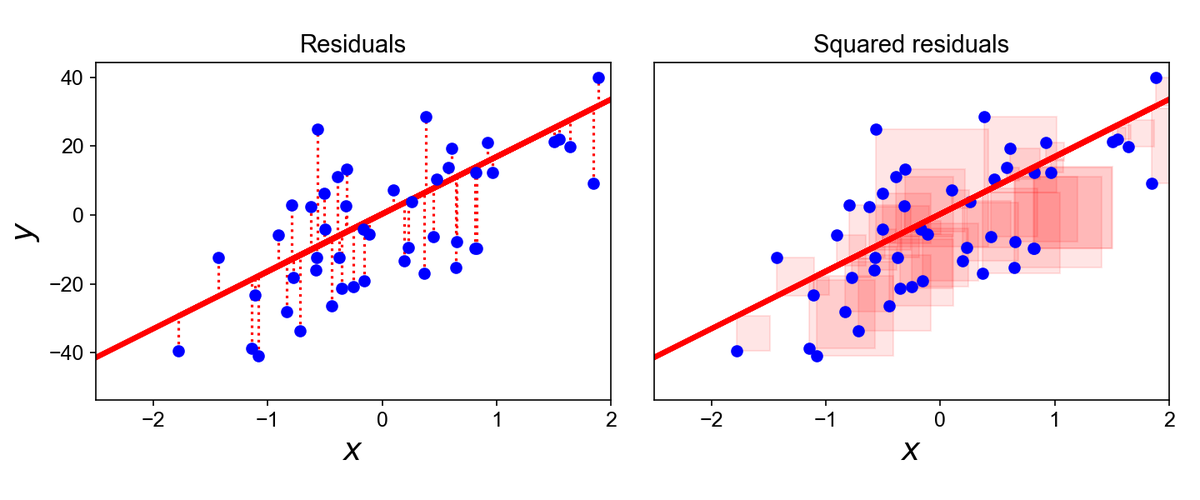
The objective of K-means is to minimize the within-cluster sum of squares (WCSS). It does this though a series of iterative steps that include Assignments and Updated Steps.
The objective of K-means is to minimize the within-cluster sum of squares (WCSS). It does this though a series of iterative steps that include Assignments and Updated Steps.
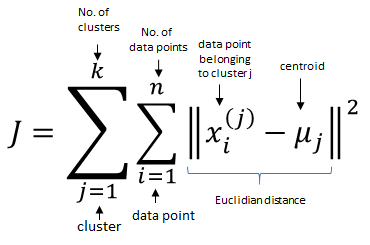
4. Assignment Step:
In this step, each data point is assigned to the nearest cluster centroid. The "nearest" is typically determined using the Euclidean distance.
In this step, each data point is assigned to the nearest cluster centroid. The "nearest" is typically determined using the Euclidean distance.
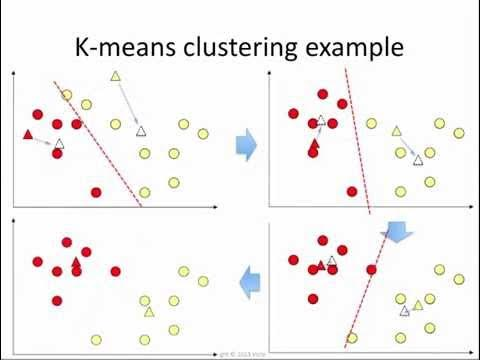
5. Update Step:
Recalculate the centroids as the mean of all points in the cluster. Each centroid is the average of the points in its cluster.
Recalculate the centroids as the mean of all points in the cluster. Each centroid is the average of the points in its cluster.
6. Iterate Step(s):
The assignment and update steps are repeated until the centroids no longer change significantly, indicating that the clusters are as good as stable. This process minimizes the within-cluster variance.
The assignment and update steps are repeated until the centroids no longer change significantly, indicating that the clusters are as good as stable. This process minimizes the within-cluster variance.
7. Silhouette Score (Evaluation):
This metric measures how similar a data point is to its own cluster compared to other clusters. The silhouette score ranges from -1 to 1, where a high value indicates that the data point is well-matched to its own cluster and poorly matched to neighboring clusters.
This metric measures how similar a data point is to its own cluster compared to other clusters. The silhouette score ranges from -1 to 1, where a high value indicates that the data point is well-matched to its own cluster and poorly matched to neighboring clusters.

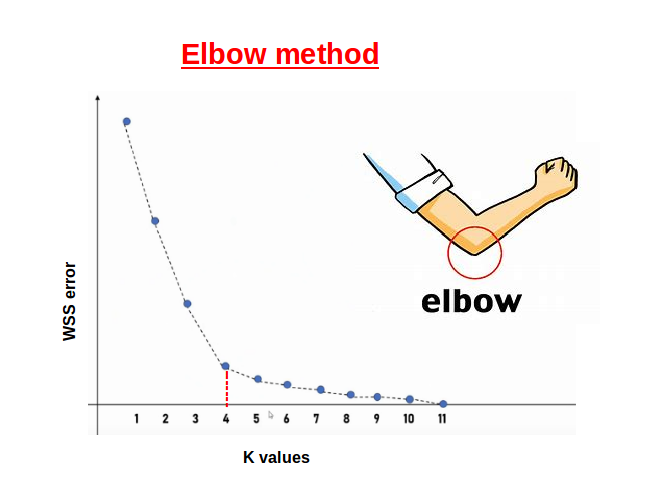
8. Elbow Method (Evaluation):
This method involves plotting the inertia as a function of the number of clusters and looking for an 'elbow' in the graph. The elbow point, where the rate of decrease sharply changes, can be a good choice for the number of clusters.
This method involves plotting the inertia as a function of the number of clusters and looking for an 'elbow' in the graph. The elbow point, where the rate of decrease sharply changes, can be a good choice for the number of clusters.
9. There's a new problem that has surfaced --
Companies NOW want AI.
AI is the single biggest force of our decade. Yet 99% of data scientists are ignoring it.
That's a huge advantage to you. I'd like to help.
Companies NOW want AI.
AI is the single biggest force of our decade. Yet 99% of data scientists are ignoring it.
That's a huge advantage to you. I'd like to help.
Want to become a Generative AI Data Scientist in 2025 ($200,000 career)?
On Wednesday, Sept 3rd, I'm sharing one of my best AI Projects: How I built an AI Customer Segmentation Agent with Python
Register here (limit 500 seats): learn.business-science.io/registration-a…
On Wednesday, Sept 3rd, I'm sharing one of my best AI Projects: How I built an AI Customer Segmentation Agent with Python
Register here (limit 500 seats): learn.business-science.io/registration-a…
That's a wrap! Over the next 24 days, I'm sharing the 24 concepts that helped me become an AI data scientist.
If you enjoyed this thread:
1. Follow me @mdancho84 for more of these
2. RT the tweet below to share this thread with your audience
If you enjoyed this thread:
1. Follow me @mdancho84 for more of these
2. RT the tweet below to share this thread with your audience
https://twitter.com/815555071517872128/status/1963565369886454218
P.S. Want free AI, Machine Learning, and Data Science Tips with Python code every Sunday?
Don't forget to sign up for my AI/ML Tips Newsletter Here: learn.business-science.io/free-ai-tips
Don't forget to sign up for my AI/ML Tips Newsletter Here: learn.business-science.io/free-ai-tips
• • •
Missing some Tweet in this thread? You can try to
force a refresh