Logistic regression is one of the simplest models in machine learning, and one of the most revealing.
It shows how to move from geometric intuition to probabilistic reasoning. Mastering it sets the foundation for everything else.
Let’s dissect it step by step!
It shows how to move from geometric intuition to probabilistic reasoning. Mastering it sets the foundation for everything else.
Let’s dissect it step by step!

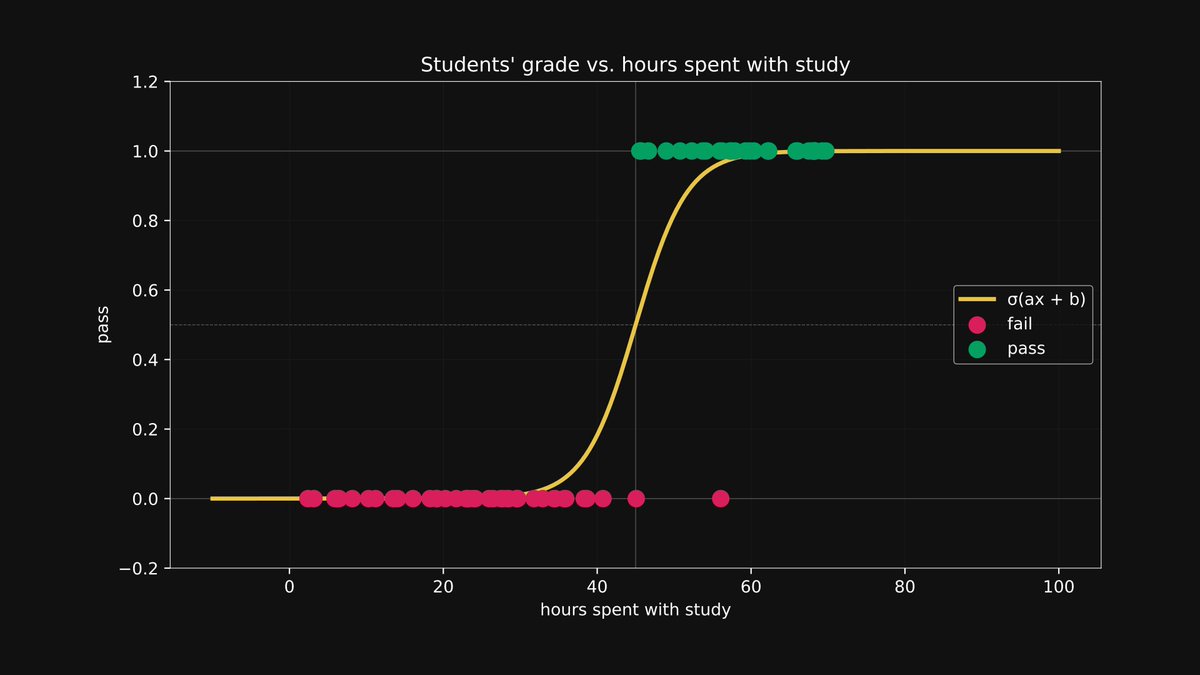
Let’s start with the most basic setup possible: one feature, two classes.
You’re predicting if a student passes or fails based on hours studied.
Your input x is a number, and your output y is either 0 or 1.
Let's build a predictive model!
You’re predicting if a student passes or fails based on hours studied.
Your input x is a number, and your output y is either 0 or 1.
Let's build a predictive model!

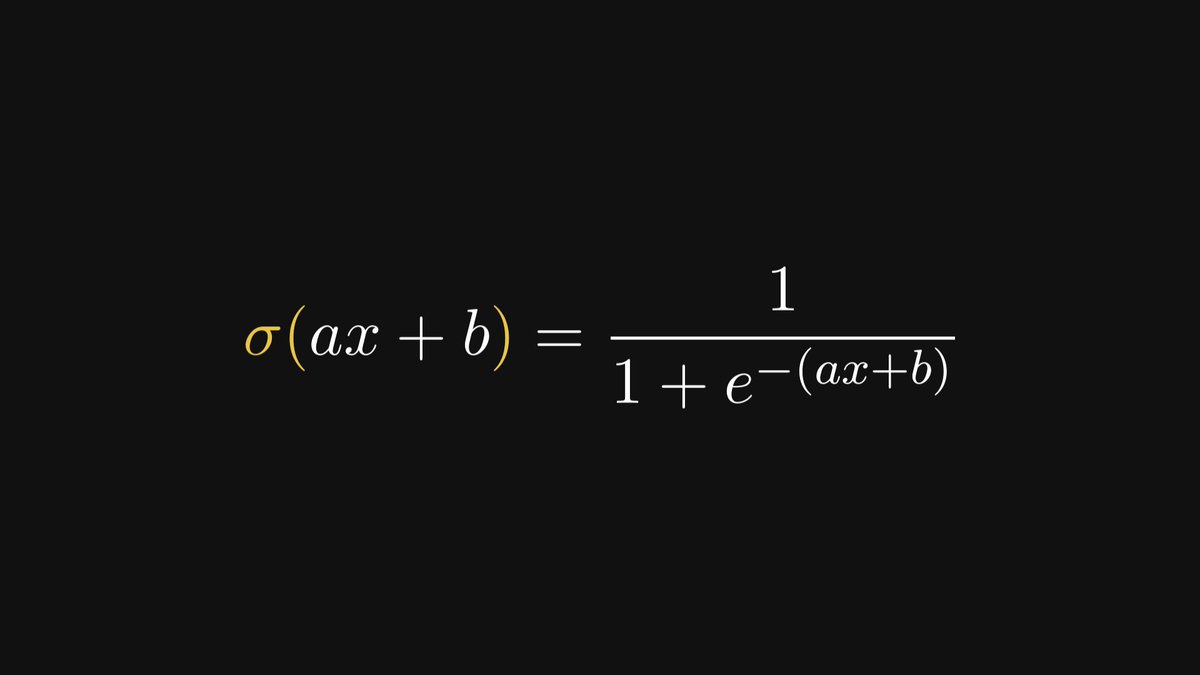
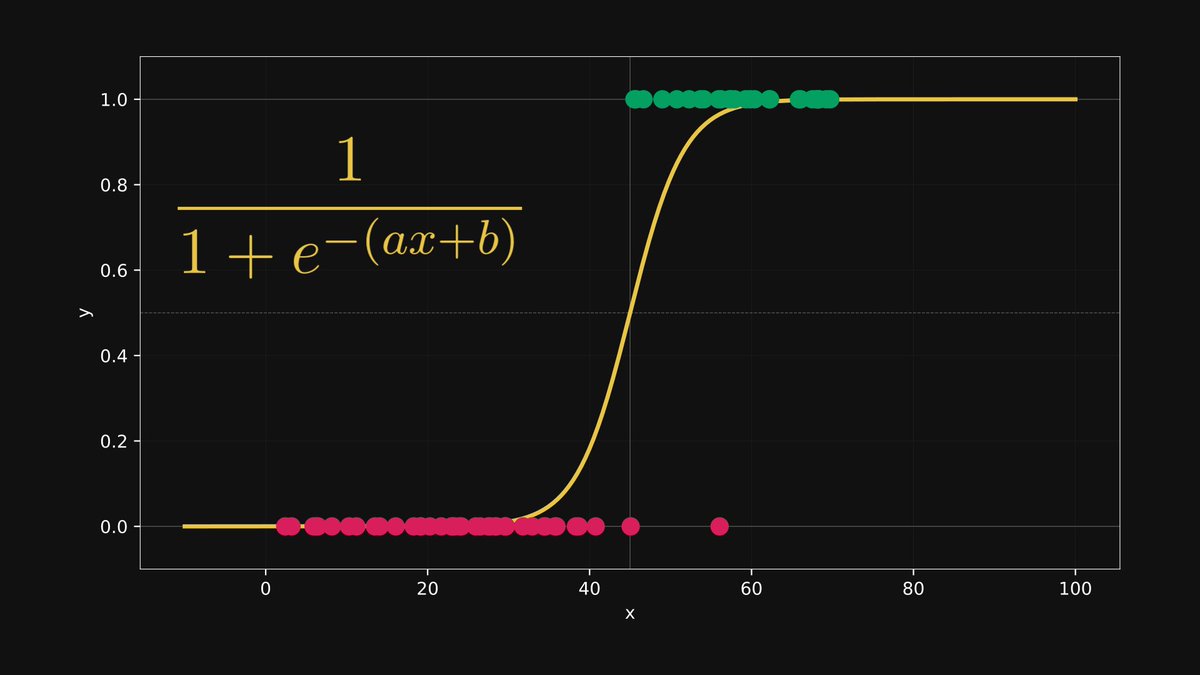
We need a model that outputs values between 0 and 1.
Enter the sigmoid function: σ(ax + b).
If σ(ax + b) > 0.5, we predict pass (1).
Otherwise, fail (0).
It’s a clean way to represent uncertainty with math.
Enter the sigmoid function: σ(ax + b).
If σ(ax + b) > 0.5, we predict pass (1).
Otherwise, fail (0).
It’s a clean way to represent uncertainty with math.
So what is logistic regression, really?
It’s just a linear regression plus a sigmoid.
We learn the best a and b from data, then use that to turn any x into a probability.
It’s just a linear regression plus a sigmoid.
We learn the best a and b from data, then use that to turn any x into a probability.
Let’s unpack this model.
First, we apply the linear transformation: y = ax + b.
This is just a line, our old friend from high school algebra.
But it plays a key role in shaping the output.
First, we apply the linear transformation: y = ax + b.
This is just a line, our old friend from high school algebra.
But it plays a key role in shaping the output.
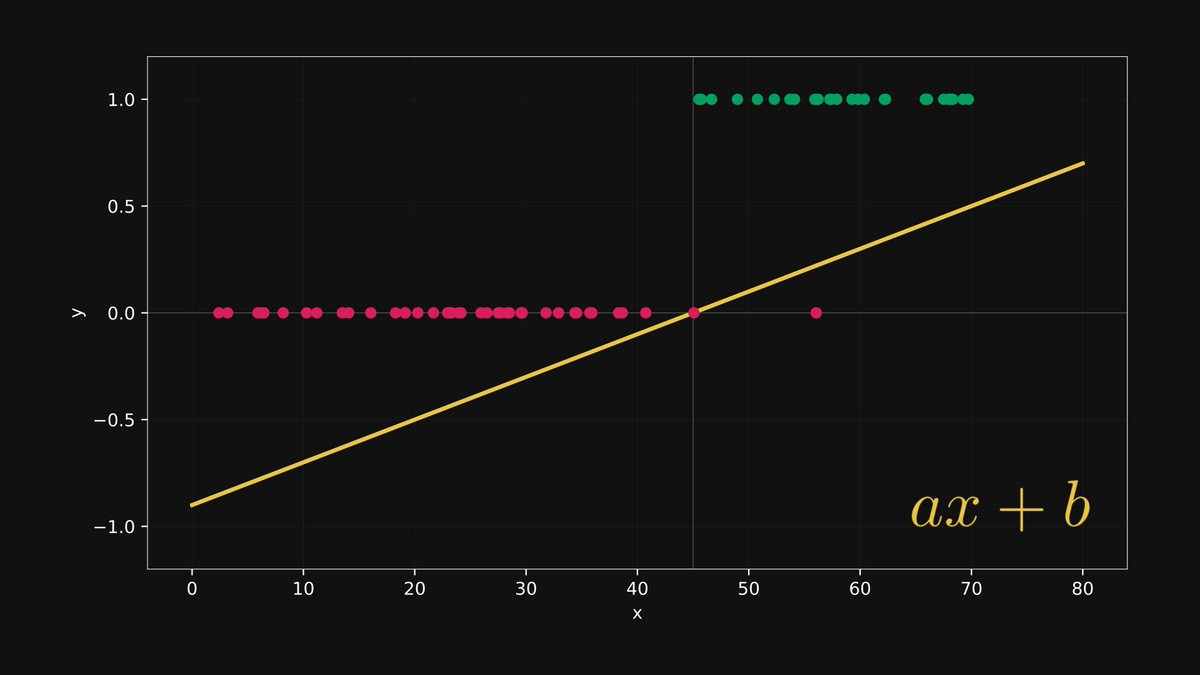
The output of ax + b is called a logit.
Positive logits suggest pass, negative suggest fail.
It's still a number on a line, not yet a probability.
That comes next.
Positive logits suggest pass, negative suggest fail.
It's still a number on a line, not yet a probability.
That comes next.
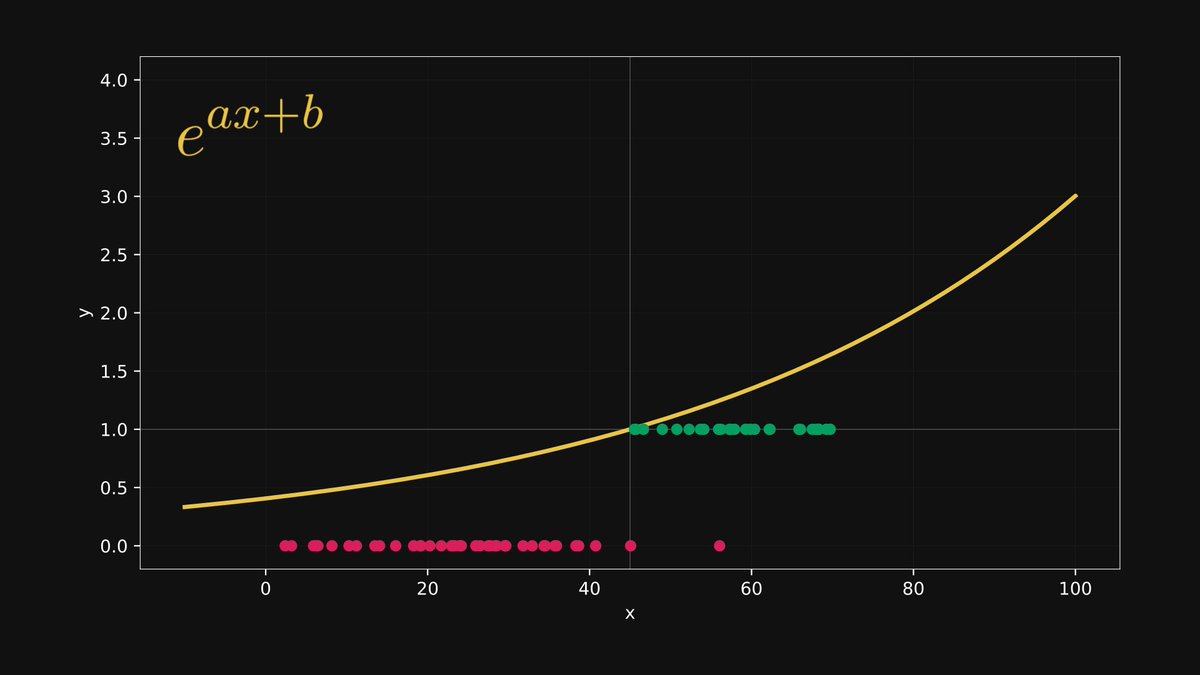
Next, we exponentiate the logit: eᵃˣ⁺ᵇ.
This guarantees the output is always positive.
We’re preparing the value for normalization, and exponentiation bends the scale in our favor.
This guarantees the output is always positive.
We’re preparing the value for normalization, and exponentiation bends the scale in our favor.
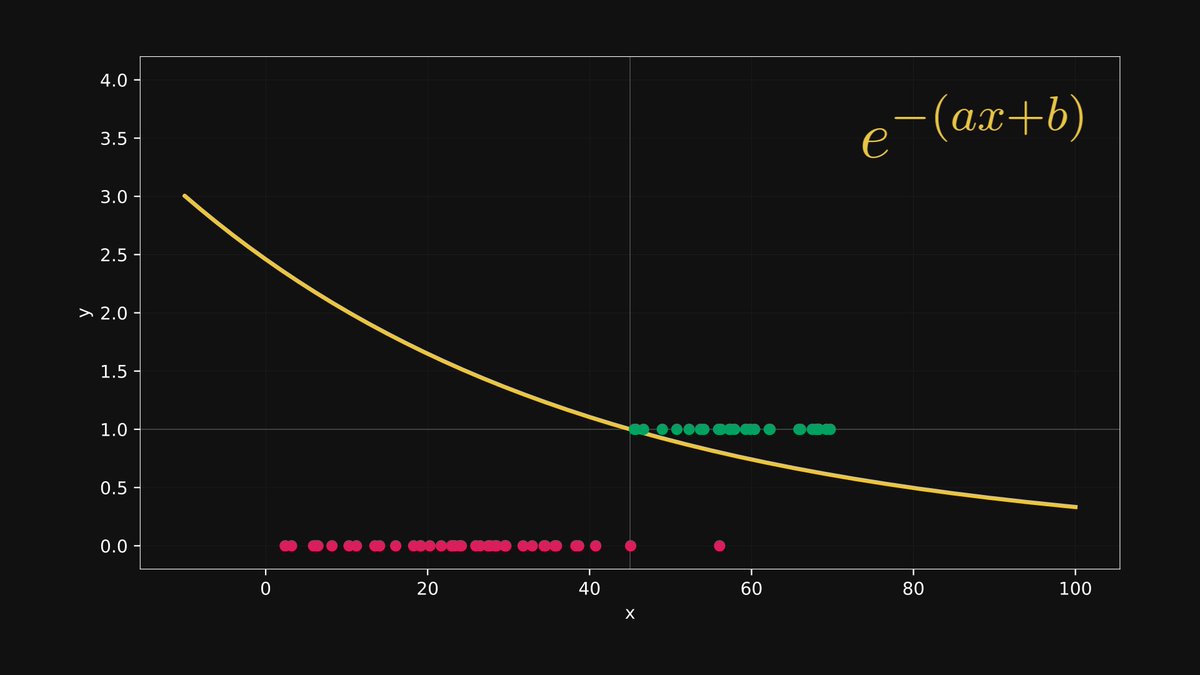
Now we flip it: e⁻⁽ᵃˣ⁺ᵇ⁾.
This inverts the curve and sets us up to approach 1 asymptotically.
This inverts the curve and sets us up to approach 1 asymptotically.
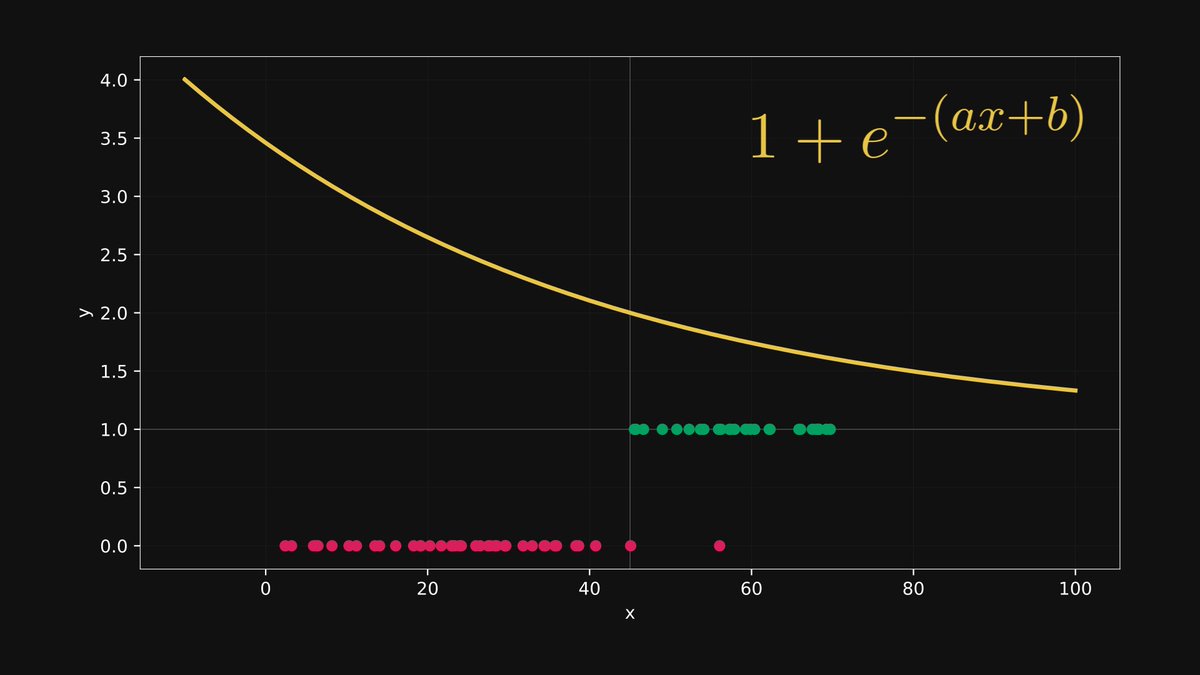
We add 1, and obtain 1 + e⁻⁽ᵃˣ⁺ᵇ⁾.
This keeps everything above 1. It prevents division by zero in the next step, and squeezes the values of the reciprocals between 0 and 1.
This tiny change stabilizes the entire model.
This keeps everything above 1. It prevents division by zero in the next step, and squeezes the values of the reciprocals between 0 and 1.
This tiny change stabilizes the entire model.
Finally, we take the reciprocal: 1 / (1 + e⁻⁽ᵃˣ⁺ᵇ⁾).
This gives us the full sigmoid function, and maps the entire real line to (0, 1).
Now we have a proper probability.
This gives us the full sigmoid function, and maps the entire real line to (0, 1).
Now we have a proper probability.
We’ve seen how to turn a number into a probability.
But what about geometry? That becomes clear in higher dimensions.
Let’s level up.
But what about geometry? That becomes clear in higher dimensions.
Let’s level up.
In 2D, the model becomes a plane: y = a₁x₁ + a₂x₂ + b.
The decision boundary is where this equals 0. Points above the plane get one class, below get another.
The model is slicing space into two halves.
The decision boundary is where this equals 0. Points above the plane get one class, below get another.
The model is slicing space into two halves.

The logit in higher dimensions measures signed distance to the boundary.
It tells you how confidently the model classifies a point. Closer to 0 means more uncertainty.
It’s probability with geometric roots.
It tells you how confidently the model classifies a point. Closer to 0 means more uncertainty.
It’s probability with geometric roots.

Logistic regression is a blueprint for how modern models make decisions.
It blends math, geometry, and probability in one clean package.
Understand it deeply, and you’ll see it everywhere.
It blends math, geometry, and probability in one clean package.
Understand it deeply, and you’ll see it everywhere.
Most machine learning practitioners don’t understand the math behind their models.
That's why I've created a FREE roadmap for my 27,000+ newsletter subscribers.
Get the roadmap here: thepalindrome.org/p/the-roadmap-…
That's why I've created a FREE roadmap for my 27,000+ newsletter subscribers.
Get the roadmap here: thepalindrome.org/p/the-roadmap-…
The Mathematics of Machine Learning book is now at 10% on Amazon.
I have packed 20 years of math studies into 700 pages full of intuitive and application-oriented lessons, the ultimate learning resource for you.
Get it now: amazon.com/Mathematics-Ma…
I have packed 20 years of math studies into 700 pages full of intuitive and application-oriented lessons, the ultimate learning resource for you.
Get it now: amazon.com/Mathematics-Ma…
• • •
Missing some Tweet in this thread? You can try to
force a refresh