🚨 America’s labor market just slammed the brakes.
ADP showed only 54k jobs in August, hiring plans hit record lows, and claims ticked up.
The only thing moving higher? Productivity.
(a thread)
ADP showed only 54k jobs in August, hiring plans hit record lows, and claims ticked up.
The only thing moving higher? Productivity.
(a thread)

Start with ADP, the private payroll report.
It’s watched closely because many on Wall Street view it as a less “manipulated” datapoint compared to the official payrolls.
It uses payroll data from ~26M workers, giving a real-time pulse on jobs. Economists expected +68k. Instead: just +54k.
It’s watched closely because many on Wall Street view it as a less “manipulated” datapoint compared to the official payrolls.
It uses payroll data from ~26M workers, giving a real-time pulse on jobs. Economists expected +68k. Instead: just +54k.
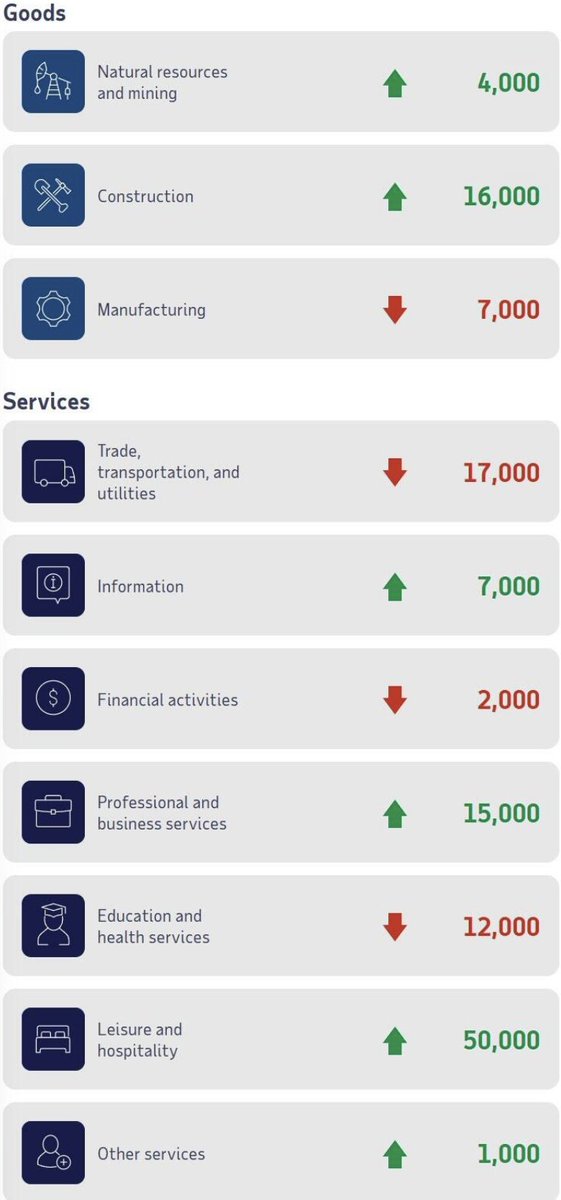
The breakdown is telling.
Leisure and hospitality added +50k jobs. Construction added +16k. These are cyclical sectors, they usually hold up until late in an expansion.
But manufacturing lost -7k. Trade/transport/utilities shed -17k. Education and health fell -12k. Weakness is spreading.
Leisure and hospitality added +50k jobs. Construction added +16k. These are cyclical sectors, they usually hold up until late in an expansion.
But manufacturing lost -7k. Trade/transport/utilities shed -17k. Education and health fell -12k. Weakness is spreading.
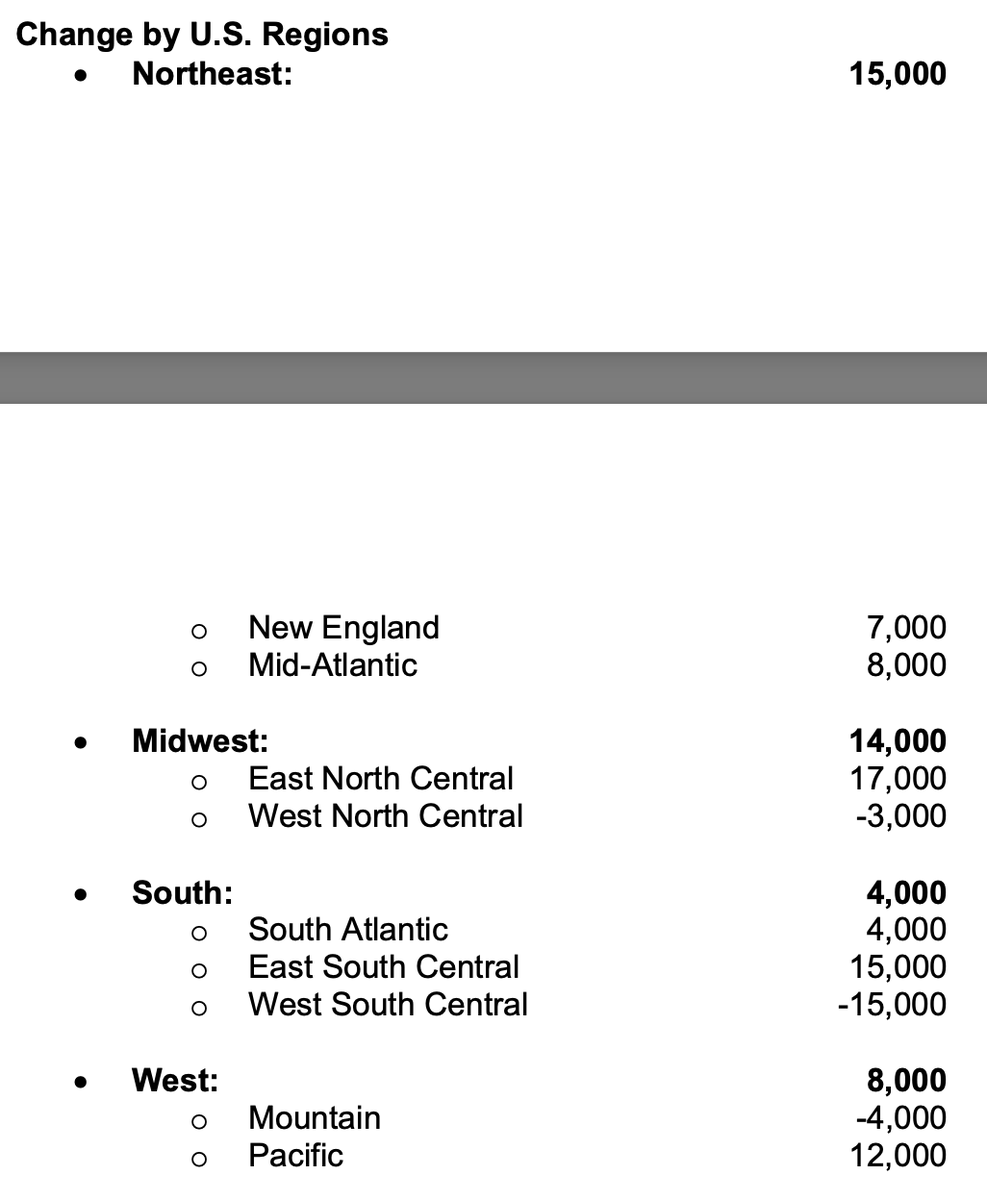
Geography shows the same fragility.
The South added just +4k jobs. The West added +8k, but Mountain states saw losses. The Midwest added +14k, only because the East North Central rose while the West North Central slipped.
Growth is fragmented, not broad.
The South added just +4k jobs. The West added +8k, but Mountain states saw losses. The Midwest added +14k, only because the East North Central rose while the West North Central slipped.
Growth is fragmented, not broad.
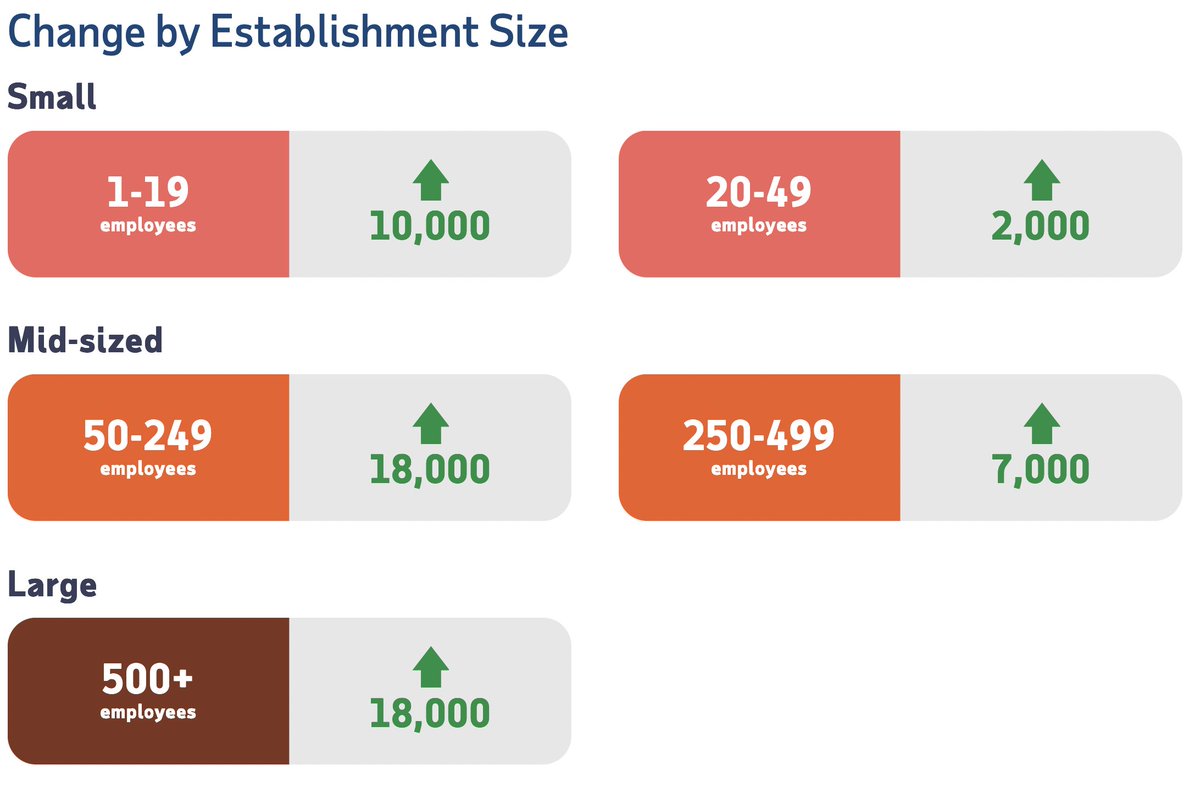
By company size, there’s no real leader.
Small businesses added +12k. Mid-sized firms added +25k. Large firms added +18k.
This isn’t just a small-business story. Big corporations aren’t aggressively hiring either. The slowdown is broad-based.
Small businesses added +12k. Mid-sized firms added +25k. Large firms added +18k.
This isn’t just a small-business story. Big corporations aren’t aggressively hiring either. The slowdown is broad-based.
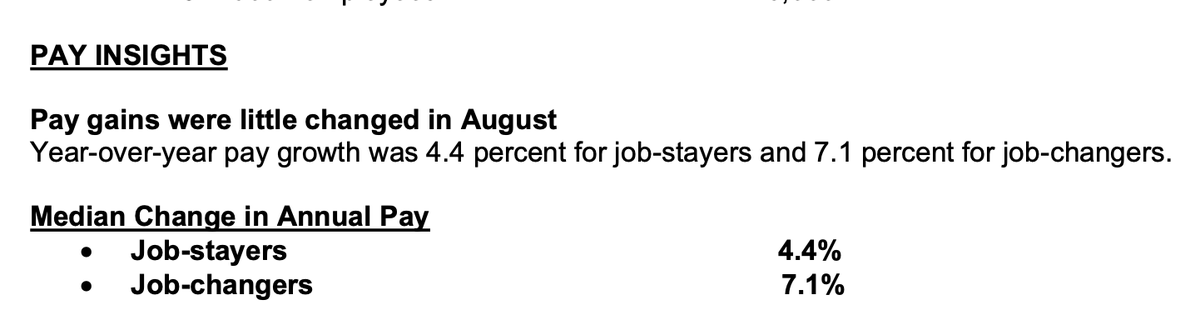
Wages are cooling too. ADP Pay Insights:
• Job-stayers (same employer) saw +4.4% pay growth, the weakest since June 2021.
• Job-changers (new employer) saw +7.1%.
Both are slowing. Less wage growth means less spending power for consumers.
• Job-stayers (same employer) saw +4.4% pay growth, the weakest since June 2021.
• Job-changers (new employer) saw +7.1%.
Both are slowing. Less wage growth means less spending power for consumers.
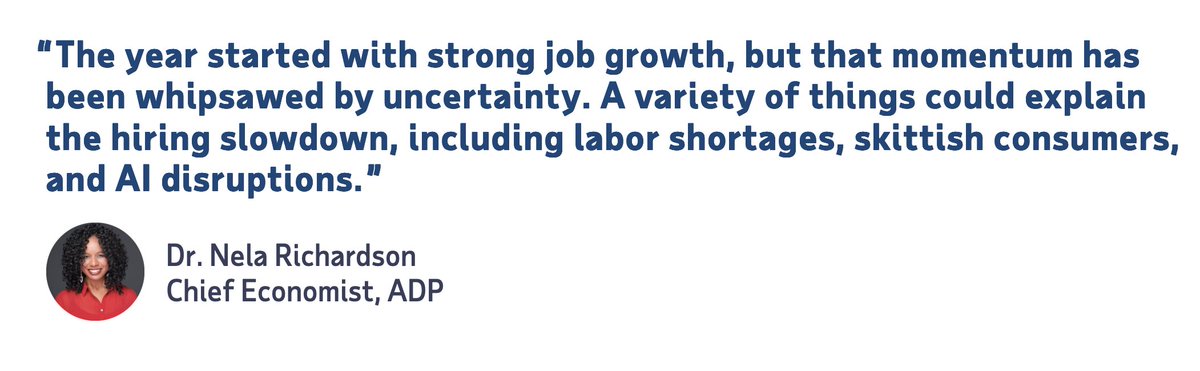
ADP’s chief economist summed it up: momentum has been “whipsawed by uncertainty"
The culprits:
• Lingering labor shortages
• Cautious consumers pulling back
• AI-driven disruption changing how firms hire
The culprits:
• Lingering labor shortages
• Cautious consumers pulling back
• AI-driven disruption changing how firms hire
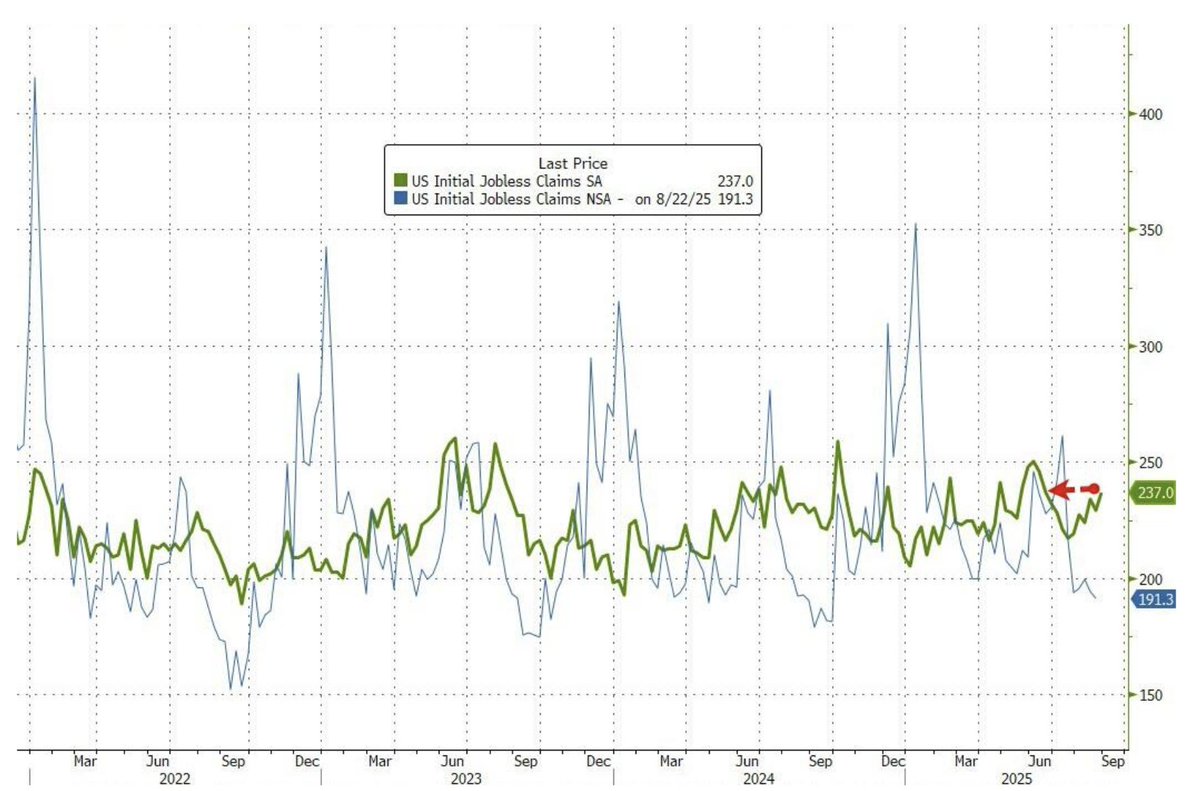
Now, unemployment claims.
Initial jobless claims rose to 237,000 last week, up from 229k. That’s the highest since June. The 4-week moving average ticked up to 231,000.
Still stable by historical standards, but creeping higher.
Initial jobless claims rose to 237,000 last week, up from 229k. That’s the highest since June. The 4-week moving average ticked up to 231,000.
Still stable by historical standards, but creeping higher.
Definitions again:
• Initial claims = new applications for unemployment benefits. Real-time measure of layoffs.
• Continuing claims = people still receiving benefits after the first week. Measure of how long joblessness lasts.
Both rising means layoffs are sticking, not clearing quickly.
• Initial claims = new applications for unemployment benefits. Real-time measure of layoffs.
• Continuing claims = people still receiving benefits after the first week. Measure of how long joblessness lasts.
Both rising means layoffs are sticking, not clearing quickly.
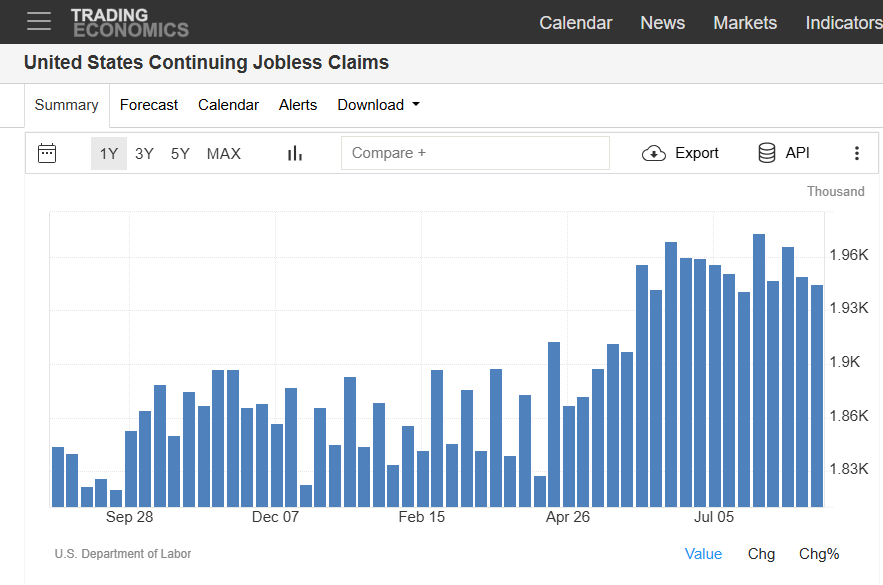
Continuing claims sit at 1.94 million. That keeps the insured unemployment rate at 1.3%.
Not a crisis, but it shows displaced workers are finding it harder to land new jobs.
That persistence is what turns slowdowns into something more damaging.
Not a crisis, but it shows displaced workers are finding it harder to land new jobs.
That persistence is what turns slowdowns into something more damaging.
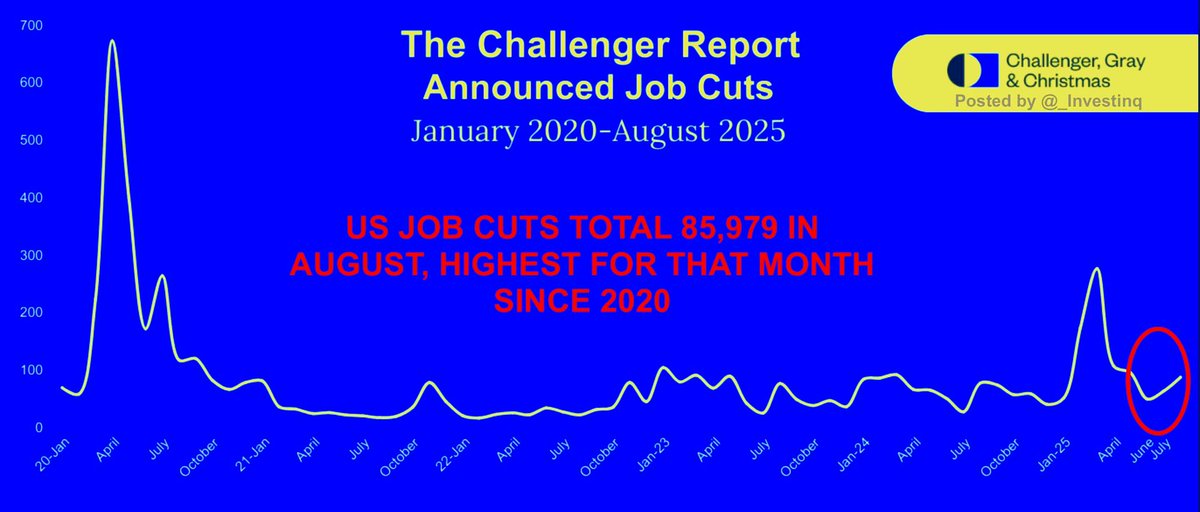
Challenger, Gray & Christmas confirmed the weakness.
They track announced job cuts and planned hiring.
In August, hiring plans fell to the weakest August on record. Job cuts mounted. Companies aren’t just hiring less, they’re actively planning fewer additions.
They track announced job cuts and planned hiring.
In August, hiring plans fell to the weakest August on record. Job cuts mounted. Companies aren’t just hiring less, they’re actively planning fewer additions.
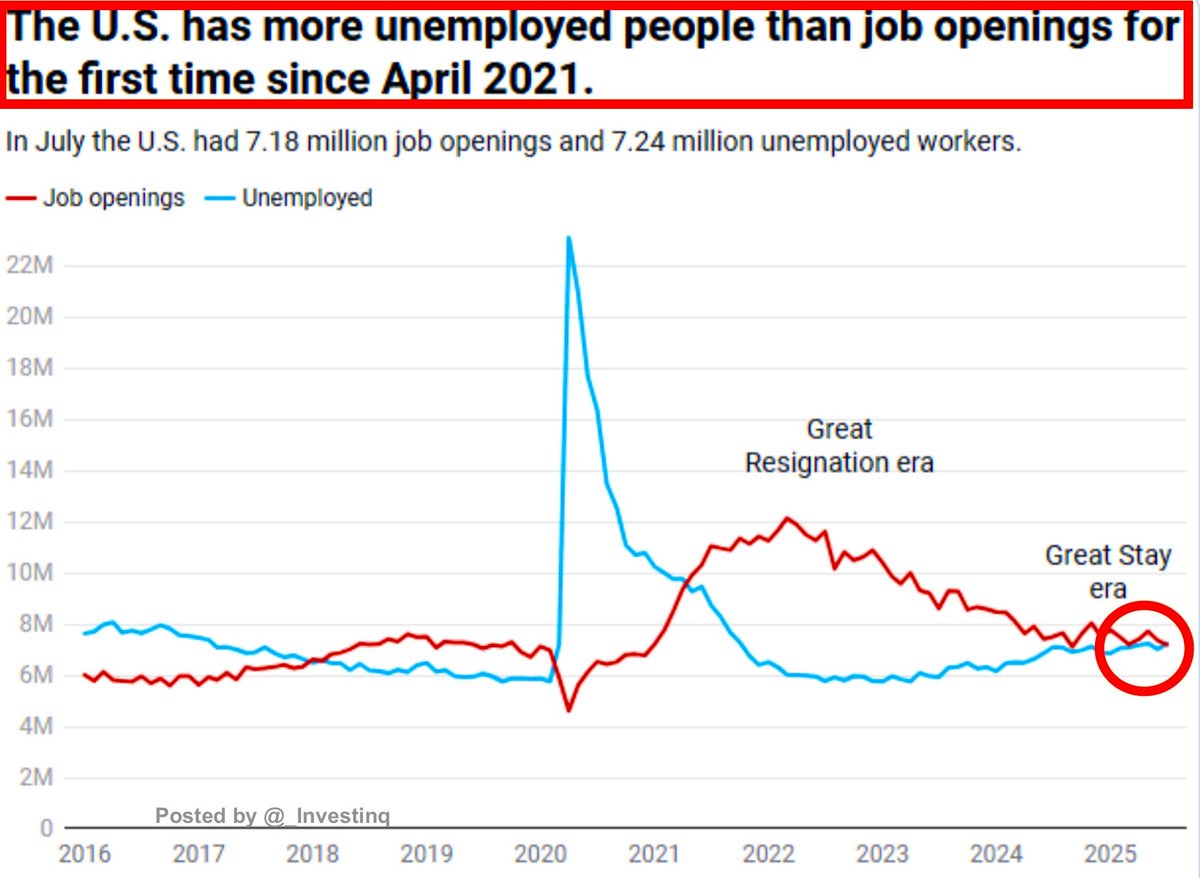
Add in JOLTS, the Job Openings and Labor Turnover Survey.
It showed fewer openings and, for the first time since 2021, unemployed workers now outnumber available jobs.
The quit rate also fell. When quits drop, it means workers don’t see better opportunities. Confidence is slipping.
It showed fewer openings and, for the first time since 2021, unemployed workers now outnumber available jobs.
The quit rate also fell. When quits drop, it means workers don’t see better opportunities. Confidence is slipping.
That’s now 4-for-4 this week.
• ADP hiring slowdown.
• Challenger hiring plans collapsing.
• JOLTS openings and quits falling.
• Jobless claims rising.
The “resilient labor market” narrative is breaking down.
• ADP hiring slowdown.
• Challenger hiring plans collapsing.
• JOLTS openings and quits falling.
• Jobless claims rising.
The “resilient labor market” narrative is breaking down.
But here’s the curveball. Productivity is soaring.
The Bureau of Labor Statistics reported nonfarm business productivity rose 3.3% in Q2 2025.
Output jumped 4.4%. Hours worked rose just 1.1%. Year-over-year, productivity is up 1.5%.
The Bureau of Labor Statistics reported nonfarm business productivity rose 3.3% in Q2 2025.
Output jumped 4.4%. Hours worked rose just 1.1%. Year-over-year, productivity is up 1.5%.
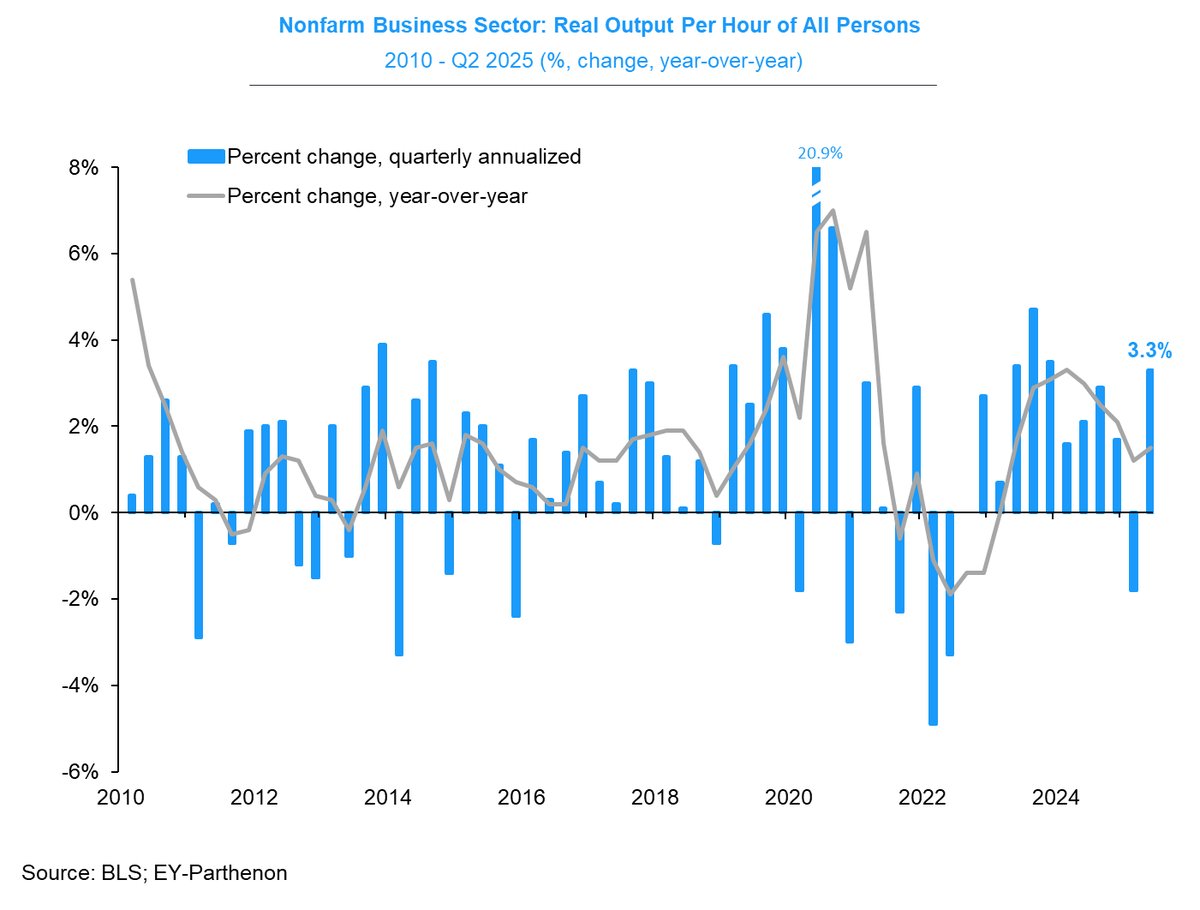
What does productivity mean? Its output per hour worked.
When productivity rises faster than hours, companies can produce more without adding workers.
That explains why job growth is slowing even though output keeps climbing.
When productivity rises faster than hours, companies can produce more without adding workers.
That explains why job growth is slowing even though output keeps climbing.
Costs confirm the story.
Unit labor costs rose just 1.0% in Q2.
Compensation was up 4.3%, but productivity gains offset most of it. Lower costs mean less pressure on businesses to raise prices.
Unit labor costs rose just 1.0% in Q2.
Compensation was up 4.3%, but productivity gains offset most of it. Lower costs mean less pressure on businesses to raise prices.
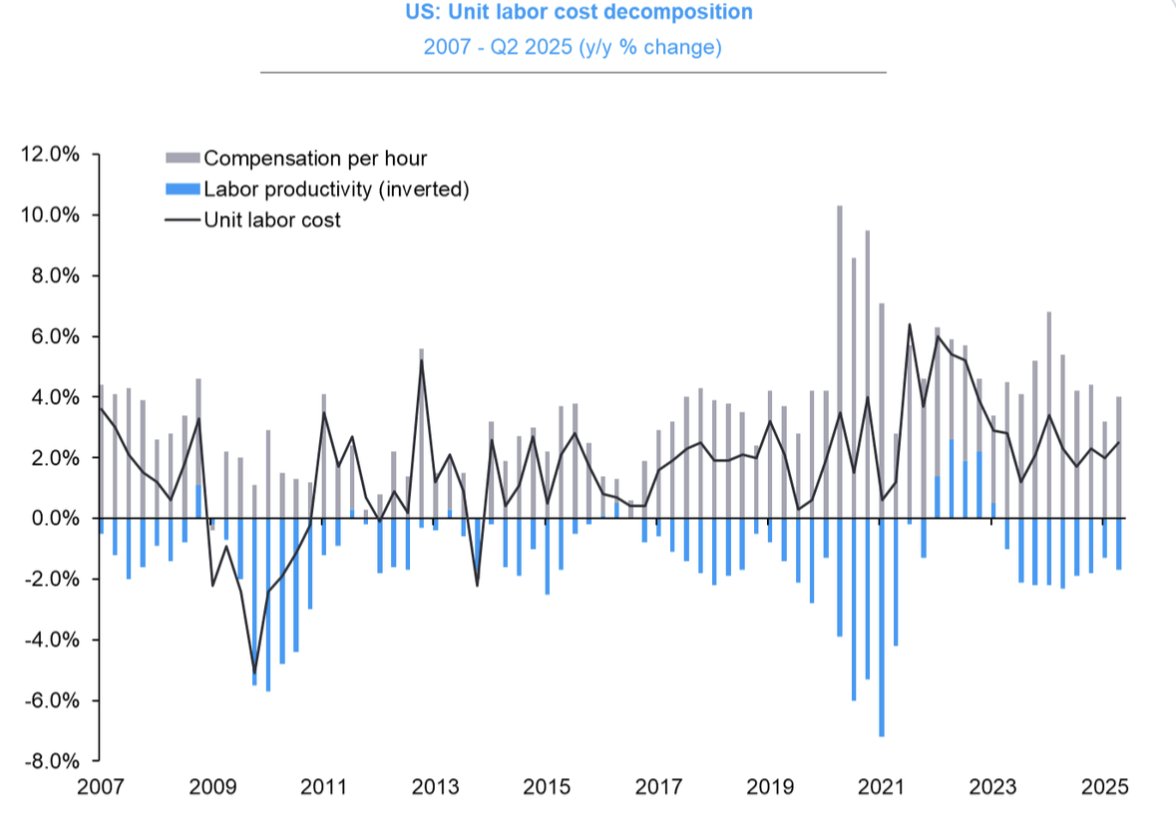
Real hourly compensation rose 2.6% in Q2.
Workers got modest real gains.
But if productivity keeps climbing while nominal wages cool, employers regain leverage. Raises get harder to come by.
Workers got modest real gains.
But if productivity keeps climbing while nominal wages cool, employers regain leverage. Raises get harder to come by.
Manufacturing shows the same pattern.
Productivity rose 2.5% in Q2, the largest four-quarter gain since mid-2021.
Durable goods output jumped 3.5% while hours barely moved. Factories are producing more with leaner workforces.
Productivity rose 2.5% in Q2, the largest four-quarter gain since mid-2021.
Durable goods output jumped 3.5% while hours barely moved. Factories are producing more with leaner workforces.
This creates a paradox. Higher productivity is good for growth and taming inflation.
But it weakens the short-term need for hiring. Companies can “do more with less.”
That’s why jobs data looks soft even as production stays strong.
But it weakens the short-term need for hiring. Companies can “do more with less.”
That’s why jobs data looks soft even as production stays strong.
Put it all together.
• ADP weak.
• Challenger bleak.
• JOLTS softer.
• Claims rising.
• Productivity surging.
Employers don’t feel pressure to hire. They’re producing more with what they’ve got. That eases inflation but leaves the labor market fragile.
• ADP weak.
• Challenger bleak.
• JOLTS softer.
• Claims rising.
• Productivity surging.
Employers don’t feel pressure to hire. They’re producing more with what they’ve got. That eases inflation but leaves the labor market fragile.
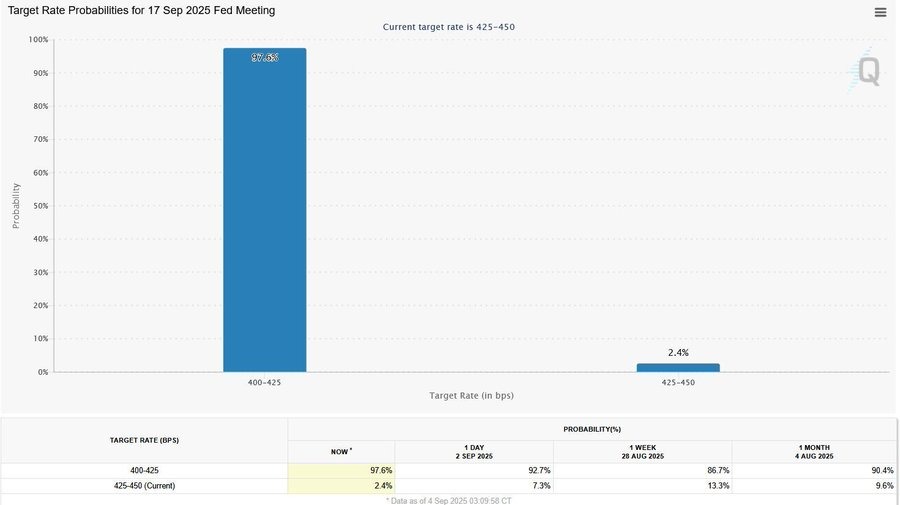
The Fed’s position is shifting. Markets now price a 97,6 % chance of a rate cut.
Weak jobs plus high productivity reduces inflation risk, giving the Fed room to ease.
But cuts won’t fix AI disruption, shrinking demand, or consumer caution. They just cushion the landing.
Weak jobs plus high productivity reduces inflation risk, giving the Fed room to ease.
But cuts won’t fix AI disruption, shrinking demand, or consumer caution. They just cushion the landing.
Bottom line: The U.S. labor market isn’t in freefall.
But cracks are forming. Hiring is weak. Openings are fewer. Quits are down. Claims are higher. Productivity masks inflation but reduces labor demand.
Efficient, but fragile.
But cracks are forming. Hiring is weak. Openings are fewer. Quits are down. Claims are higher. Productivity masks inflation but reduces labor demand.
Efficient, but fragile.
And remember, Friday is the main event: the U.S. Jobs Report.
It measures Nonfarm Payrolls, the Unemployment Rate, and Wages.
This release is the single biggest monthly market mover. Tomorrow will show if this slowdown is just noise or something deeper.
It measures Nonfarm Payrolls, the Unemployment Rate, and Wages.
This release is the single biggest monthly market mover. Tomorrow will show if this slowdown is just noise or something deeper.
If payrolls miss and revisions turn negative, the Fed’s path to cuts gets even clearer.
If wages cool further, inflation pressure fades.
But if the data surprises strong, markets may need to rethink just how “soft” this landing really is.
If wages cool further, inflation pressure fades.
But if the data surprises strong, markets may need to rethink just how “soft” this landing really is.
If you found these insights valuable: Sign up for my FREE newsletter! thestockmarket.news
I hope you've found this thread helpful.
Follow me @_Investinq for more.
Like/Repost the quote below if you can:
Follow me @_Investinq for more.
Like/Repost the quote below if you can:
https://x.com/_investinq/status/1963600204017377451?s=46
• • •
Missing some Tweet in this thread? You can try to
force a refresh