New @The_Budget_Lab tariff analysis incorporating all tariffs through Sept 3. This is a major update. We:
• incorporate higher assumptions about Canada & Mexico tariff-free import shares;
• show 2 scenarios: all tariffs & no IEEPA tariffs after Jun 2026.
In brief...
1/12
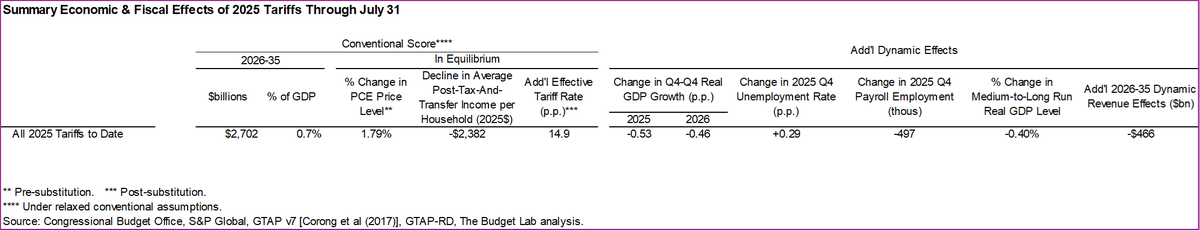
@The_Budget_Lab Under our all-tariff baseline, consumers face an effective tariff rate of 17.4%, a 15.0pp increase from 2024 & the highest since 1935. After shifts in spending in reaction to the tariffs, the effective tariff rate will be 16.4%, a 13.9pp increase & the highest since 1936
2/12
@The_Budget_Lab The price level from all 2025 tariffs rises by 1.7% in the short-run under our all-tariff baseline, an average per-household income loss of $2,300 in 2025$. The post-substitution price increase settles at 1.4%, a $1,900 loss per household.
3/12
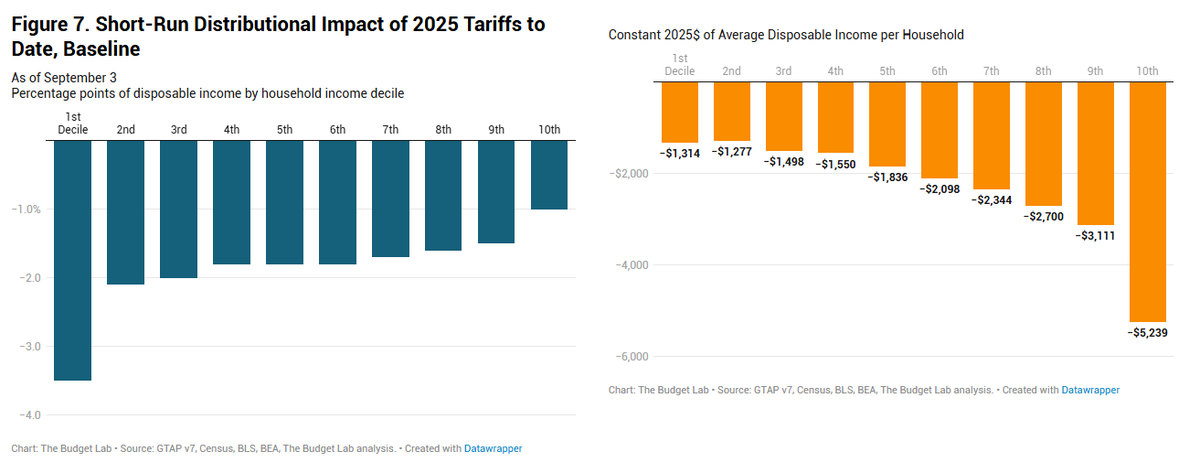
@The_Budget_Lab Tariffs are a regressive tax, especially in the short-run. The short-run burden on 1st decile households (as a % of income) is >3x that of the top decile (-3.5% versus -1.0%). The average annual cost to the 1st & top decile are $1,300 & $5,200 respectively; median is $2,000.
4/12
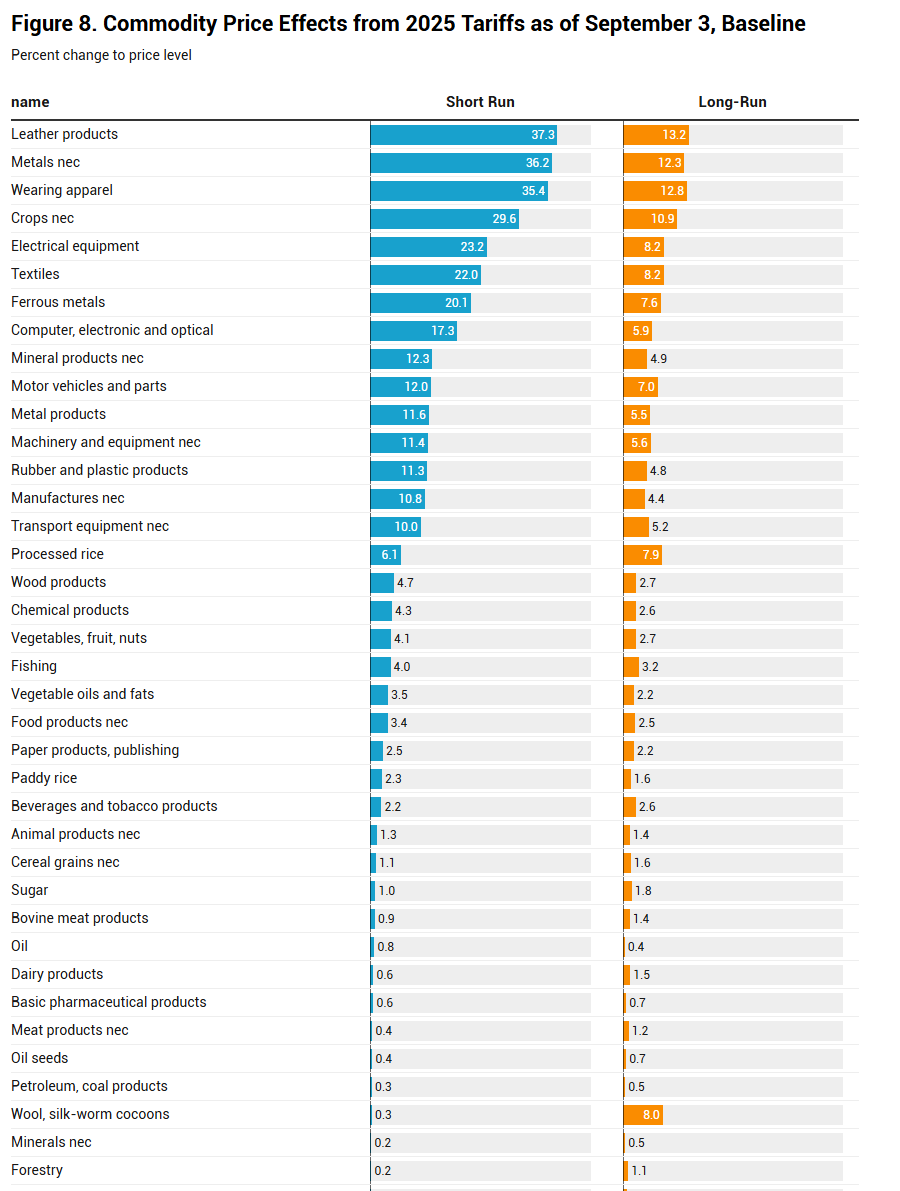
@The_Budget_Lab The 2025 tariffs disproportionately affect clothing and textiles, with consumers facing 37% higher shoe prices and 35% higher apparel prices in the short-run. Shoes and apparel prices stay 13% higher in the long-run.
5/12
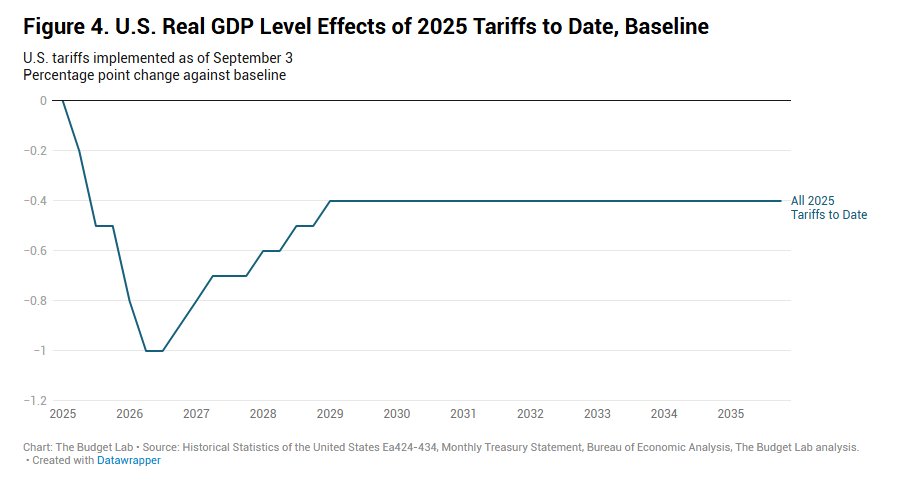
@The_Budget_Lab US real GDP growth over 2025 & 2026 is 0.5pp & 0.4pp lower respectively from all 2025 tariffs. In the long-run, the US economy is persistently 0.4% smaller, the equivalent of $120B annually in 2024$.
The unemployment rate rises 0.3pp by the end of 2025, & 0.7pp by end-2026.
6/12
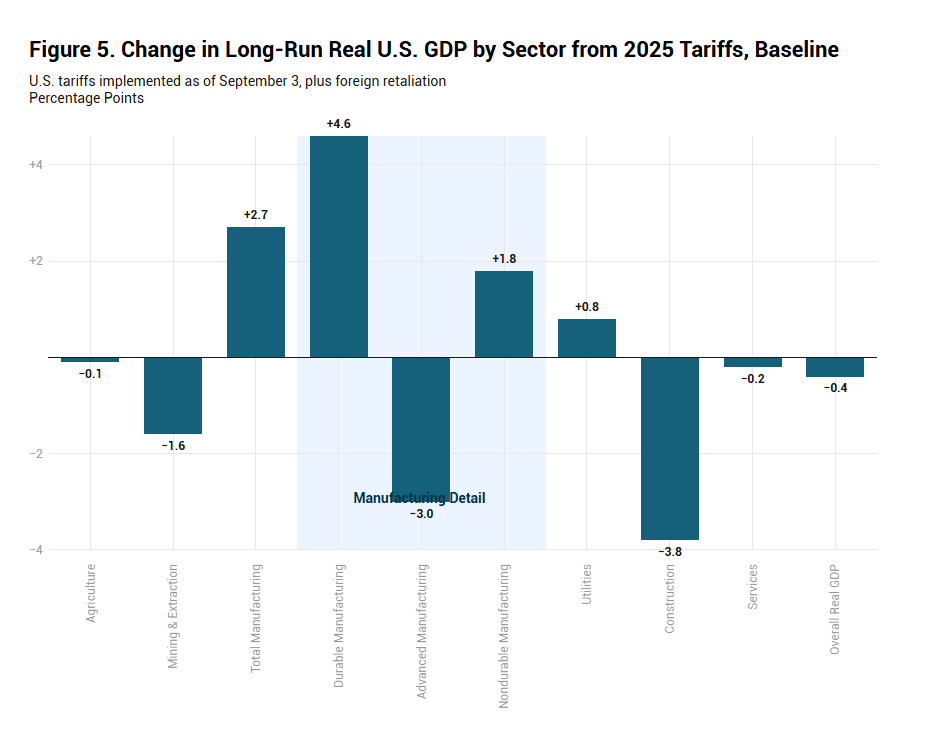
@The_Budget_Lab In the long-run, tariffs present a trade-off. US manufacturing output expands by 2.7%, but these gains are more than crowded out by other sectors: construction output contracts by 3.8% and mining declines by 1.6%.
7/12
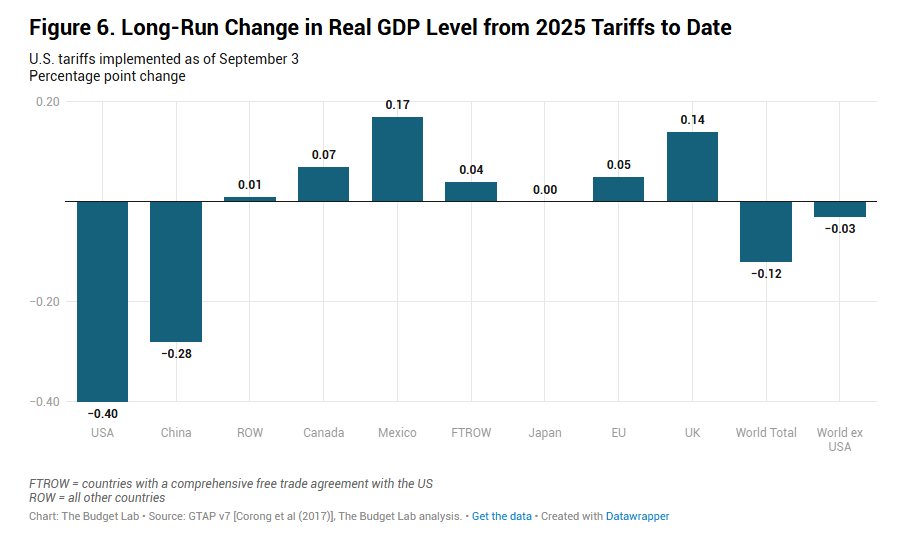
@The_Budget_Lab Canada cessation of most retaliation significantly eases the economic burden they bear relative to our prior estimates: long-run Canadian real GDP is now 0.1% higher. China’s economy is -0.3% smaller, nearly 3/4 as large as the hit to the US.
8/12
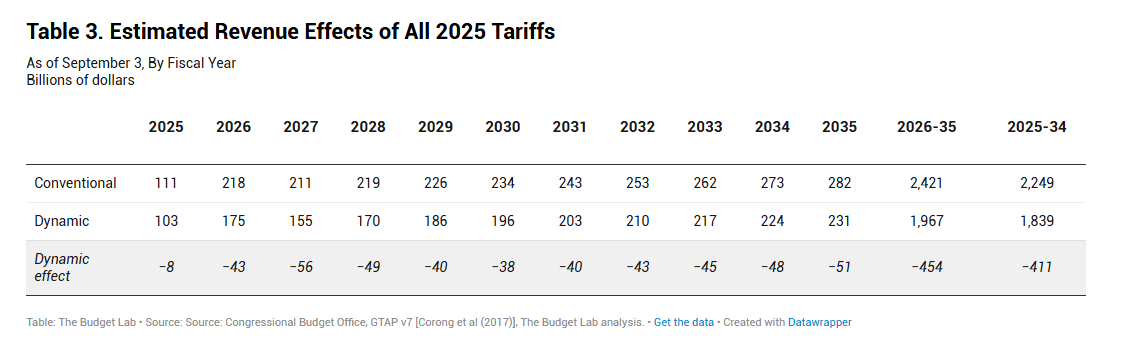
@The_Budget_Lab All tariffs to date in 2025 raise $2.4 trillion over 2026-35, with $454 billion in negative dynamic revenue effects, bringing dynamic revenues to $2.0 trillion.
9/12
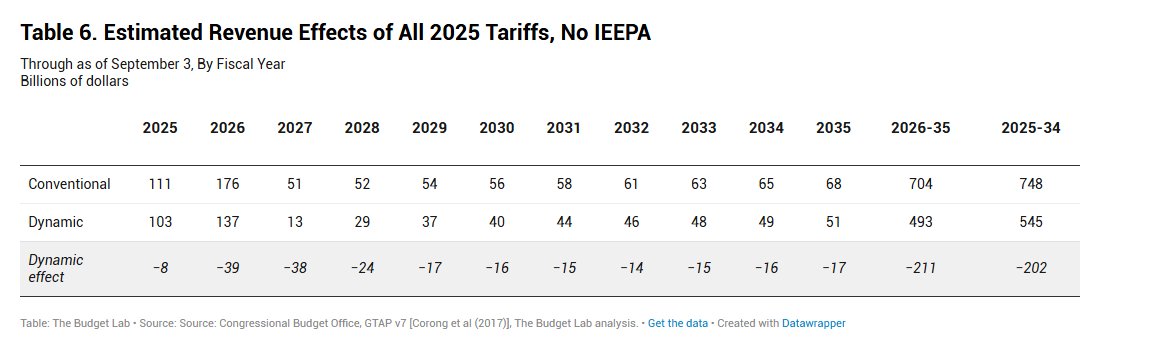
@The_Budget_Lab But what if the IEEPA tariffs were both 1) overturned, & 2) not replaced? We show a "No IEEPA" scenario assuming a SCOTUS decision in June 2026. A few highlights:
1. IEEPA tariffs make up ~70% of the 2025 tariffs to date. 2. Revenues shrink to $700B over 2026-2035.
10/12
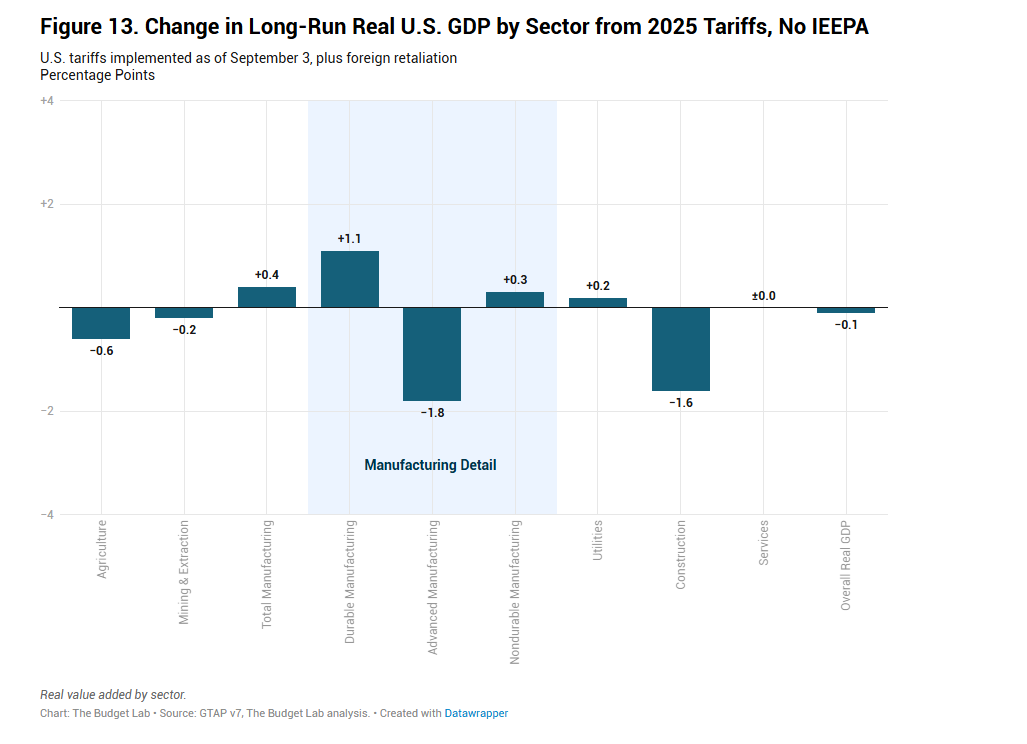
@The_Budget_Lab 3. The long-run hit to US real GDP levels is now only -0.1%, but there is still an outsized negative effect on advanced manufacturing (due to the remaining 232 tariffs). 4. The effective tariff rate would be 6.8%, still the highest since 1969.
11/12
We have a new @The_Budget_Lab report out today looking at the short-run effects of tariffs so far. Basically, we asked the questions, "What do we see in actual data to date, and how does it compare to our priors." In brief...
1/13
@The_Budget_Lab REVENUE & TARIFF RATES. New 2025 tariffs have raised ~$88B thru Aug, with $23B in Aug alone. The actual effective tariff rate was ~11.5% in Aug vs 18.2% statutory. The wedge b/t the actual & statutory rates is due to factors that lag revenues & low tariff shares from Canada.
2/13
@The_Budget_Lab GOODS PRICES. Goods prices are higher than they would be absent tariffs. Durable goods prices (furniture, appliances, electronics, etc.) & all core goods prices (durables plus apparel & other nondurable goods) were 2.3% & 1.9% above their pre-2025 price levels in Jun & Jul.
3/13
Headline CPI 0.29% MM/2.70% YY, core CPI 0.32% MM/3.06% YY. Small upside surprise on monthly headline inflation, rest in line with expectations.
Grocery & energy prices declined MM, core goods inflation stayed at a warm 0.2%, & core services inflation picked up to 0.4%.
In June, excess monthly core inflation was largely a goods story, in large part driven by tariff price adjustments.
In July, the excess is a bit larger on net but more split between goods & services.
On the core goods side, several tariff-sensitive items are still above pre-2025 trend price levels. The most significant are furniture, windows/floor coverings, & household equipment. Appliances & electronics also above trend. Girl's apparel slightly below trend.
New @The_Budget_Lab tariff analysis incorporating the Administration's new list of "reciprocal" tariffs published last night and going into effect August 7, as well as maintaining the 25% rate on Mexico. In brief...
1/10
@The_Budget_Lab Consumers face an overall average effective tariff rate of 18.3%, a 15.9pp increase from 2024 & the highest since 1934. After consumers & businesses shift spending in reaction to the tariffs, the average tariff rate will be 17.3%, a 14.9pp increase & the highest since 1935
2/10
@The_Budget_Lab The price level from all 2025 tariffs rises by 1.8% in the short-run, an average per household income loss of $2,400 in 2025$, assuming no Fed reaction & full consumer passthrough. The post-substitution price increase settles at 1.5%, a $2,000 loss per household.
3/10
New @The_Budget_Lab tariff analysis incorporating 1) the 50% copper tariff, and 2) the July 7 & 9 letters to 22 countries with new "reciprocal" tariff rates. Both go into effect August 1. In brief...
1/10
• Consumers face an overall average effective tariff rate of 18.0%, a 15.6pp increase from 2024 & the highest since 1934. After consumers & businesses shift spending in reaction to the tariffs, the average tariff rate will be 16.9%, a 14.5pp increase & the highest since 1935
2/10
@The_Budget_Lab • The price level from all 2025 tariffs rises by 1.8% in the short-run, the equivalent of an average per household income loss of $2,400 in 2025$, assuming no Federal Reserve reaction. The post-substitution price increase settles at 1.5%, a $2,000 loss per household.
3/10
New @The_Budget_Lab tariff analysis incorporating 1) the US-Vietnam framework announced July 2, and 2) the July 7 letters to 14 countries with new "reciprocal" tariff rates, which go into effect August 1.
In brief...
1/10
• Consumers face an overall average effective tariff rate of 17.6%, a 15.2pp increase from 2024 & the highest since 1934. After consumers & businesses shift spending in reaction to the tariffs, the average tariff rate will be 16.5%, a 14.1pp increase & the highest since 1936
2/10
@The_Budget_Lab • The price level from all 2025 tariffs rises by 1.7% in the short-run, the equivalent of an average per household income loss of $2,300 in 2025$, assuming no Federal Reserve reaction. The post-substitution price increase settles at 1.5%, a $1,900 loss per household.
3/10
Yesterday's US Court of International Trade decision invalidates the recent tariffs imposed under IEEPA, including the "reciprocal" tariffs & most tariffs on China, Canada, & Mexico, leaving only the Section 232 commodity tariffs in place. What are the economic implications?
1/8
• The average effective US tariff rate falls to 6.9% pre-substitution without the IEEPA tariffs, the highest since 1969, down from 17.8% prior. Even after consumption shifts, the average tariff rate will be 7.0%, also the highest since 1969. 2/8
• The price level from all non-IEEPA 2025 tariffs rises by 0.6% in the short-run, the equivalent of an average per household consumer loss of $950 in 2024$.
• The 2025 tariffs raise $686 billion over 2026-35, with $101 billion in negative dynamic revenue effects. 3/8