🚨 The Fed’s worst nightmare is here: Stagflation.
Growth is stalling, unemployment is rising, and inflation is still sticky.
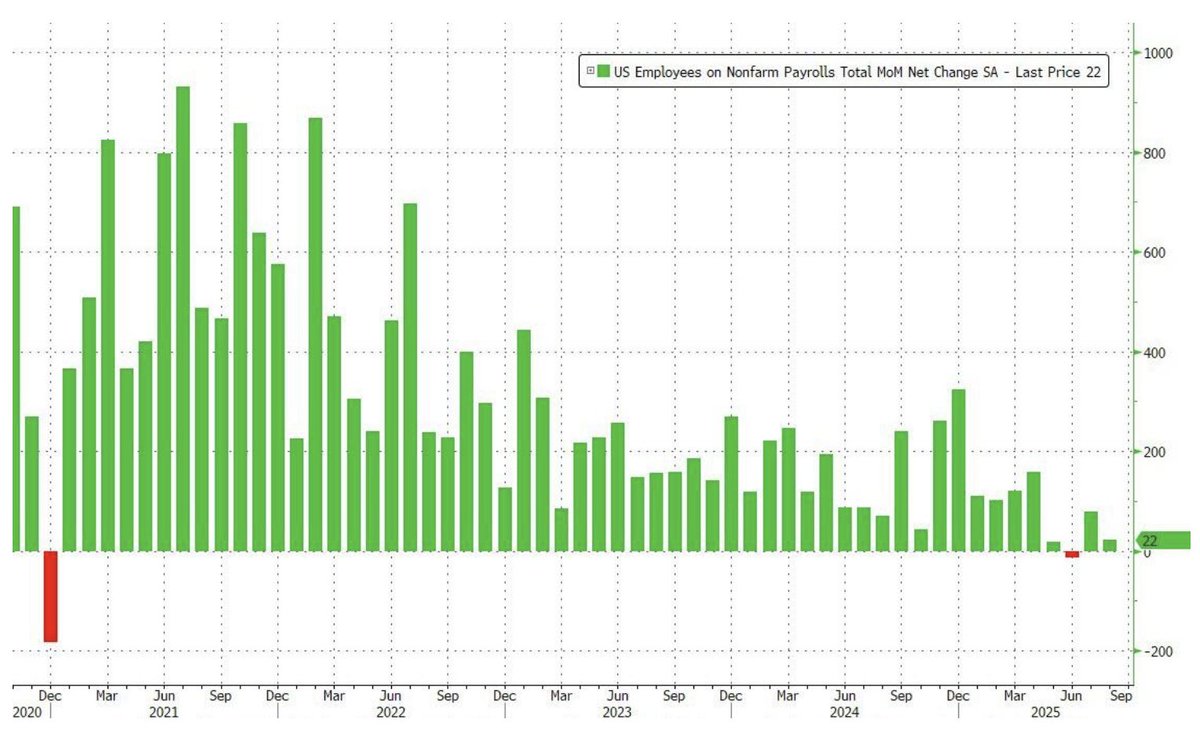
And today’s payrolls confirmed it: just 22,000 jobs were added in August.
(a thread)
Growth is stalling, unemployment is rising, and inflation is still sticky.
And today’s payrolls confirmed it: just 22,000 jobs were added in August.
(a thread)

Stagflation is the rare moment when an economy gets hit from both sides.
Growth is too weak to create jobs, but inflation is still too strong to give households relief.
Normally, one eases when the other worsens. When both run together, the result is painful.
Growth is too weak to create jobs, but inflation is still too strong to give households relief.
Normally, one eases when the other worsens. When both run together, the result is painful.

For the Fed, stagflation is a nightmare because the usual tools don’t work.
Cutting rates might ease job losses, but it risks fueling more inflation.
Hiking rates might tame prices, but it will kill more jobs. It’s a corner with no good exits.
Cutting rates might ease job losses, but it risks fueling more inflation.
Hiking rates might tame prices, but it will kill more jobs. It’s a corner with no good exits.
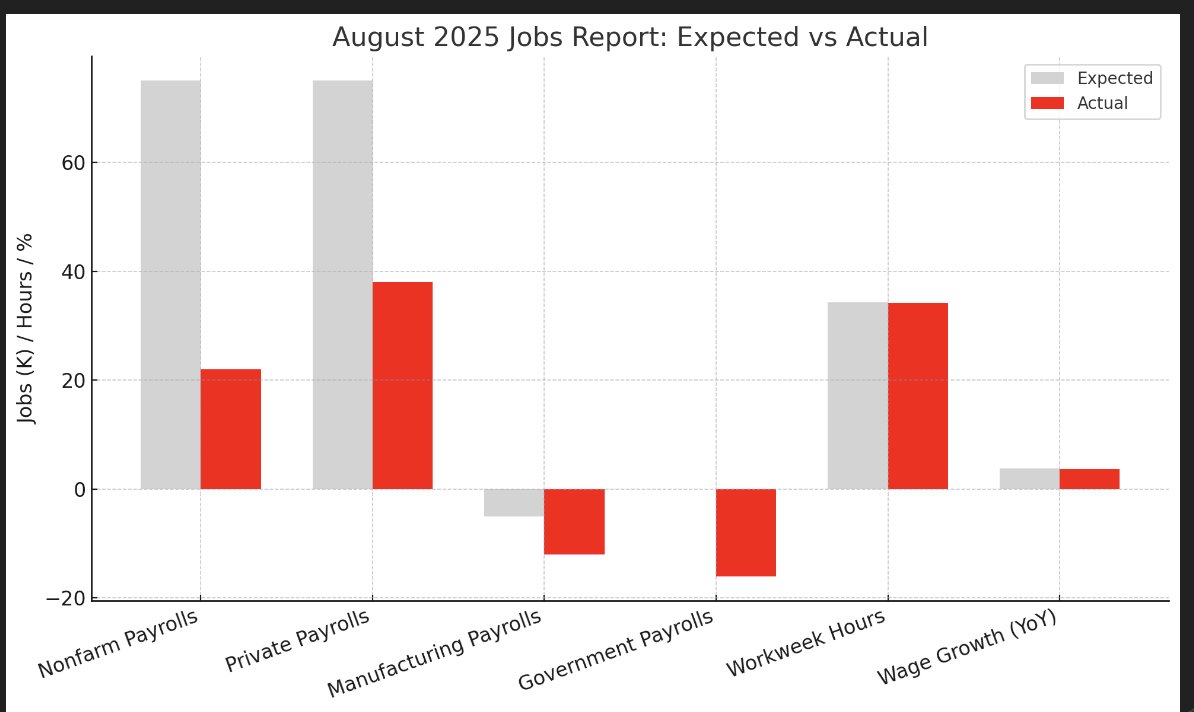
That’s why the August jobs report hit so hard.
Wall Street expected between 40k and 100k jobs to be added.
Instead, the economy barely managed 22k.
Wall Street expected between 40k and 100k jobs to be added.
Instead, the economy barely managed 22k.
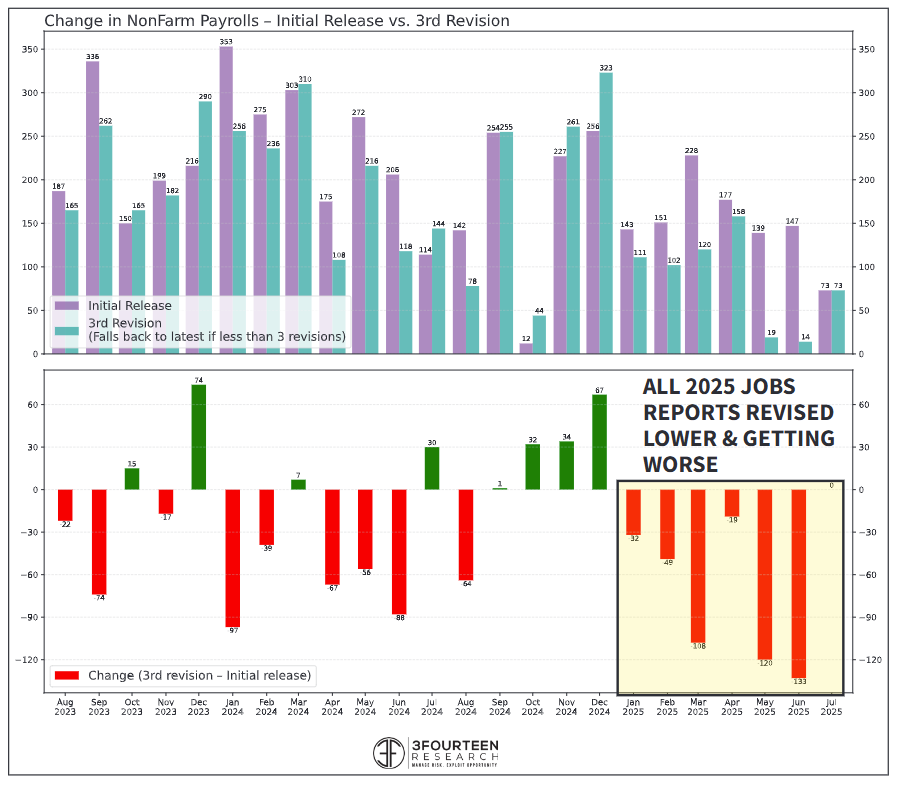
The revisions made the story worse. June was first reported as a gain of 147,000 jobs.
Then it was cut to 27,000.
Now, after another downward adjustment, June shows the economy actually lost 13,000 jobs. It is the first negative print since 2020.
Then it was cut to 27,000.
Now, after another downward adjustment, June shows the economy actually lost 13,000 jobs. It is the first negative print since 2020.
Think about that: what started as a healthy gain of 147k turned into a loss of 13k.
That means revisions erased more jobs than were initially said to exist. It’s not just a correction.
It’s a reversal of reality. That is deeply troubling for data credibility.
That means revisions erased more jobs than were initially said to exist. It’s not just a correction.
It’s a reversal of reality. That is deeply troubling for data credibility.
The damage is larger when you add it up.
May and June together have now been revised lower by 280,000 jobs.
Every single jobs report in 2025, except July, has been revised down. By the time the truth shows up months later, the slowdown has already hit.
May and June together have now been revised lower by 280,000 jobs.
Every single jobs report in 2025, except July, has been revised down. By the time the truth shows up months later, the slowdown has already hit.
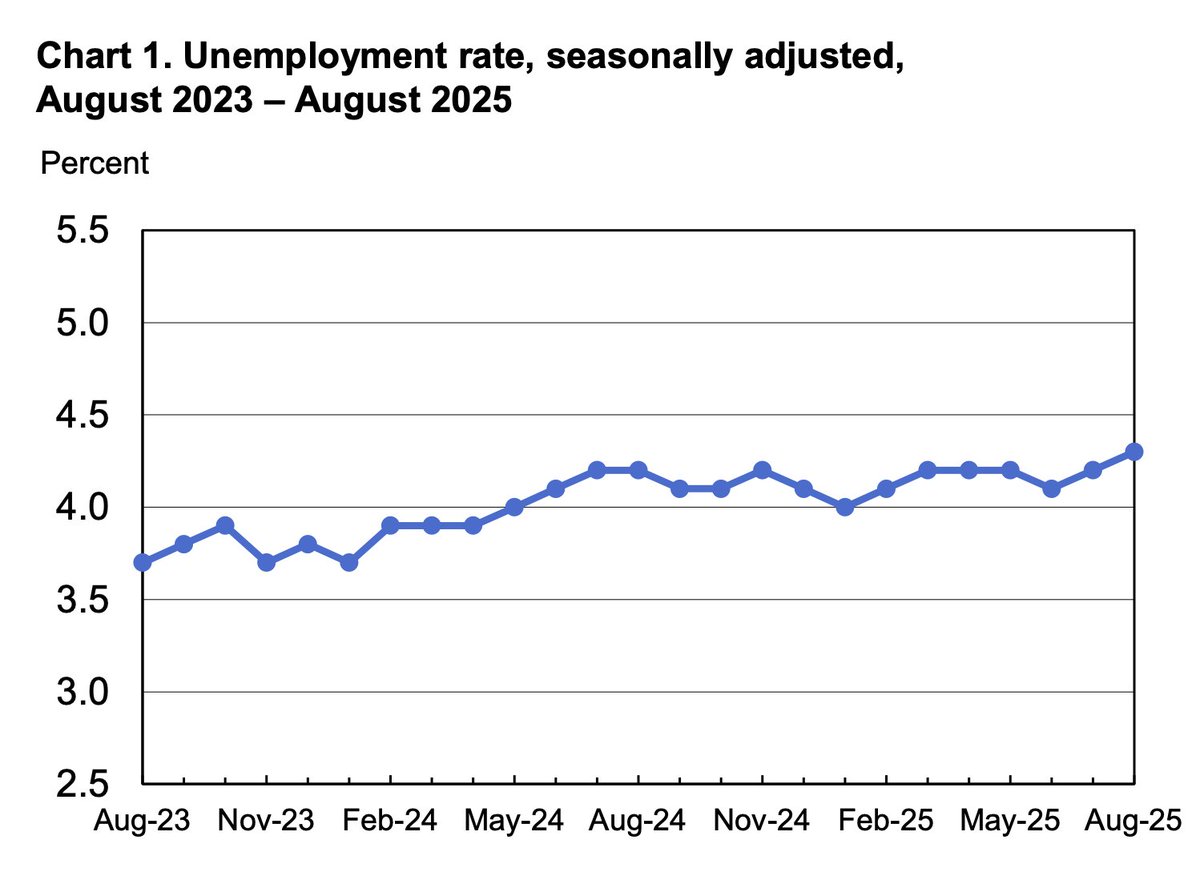
The unemployment rate climbed to 4.3 percent.
This figure, known as the U-3 rate, only counts people who are out of work and have actively searched in the last four weeks.
Anyone who has stopped looking is excluded, which is why the number often looks cleaner than reality.
This figure, known as the U-3 rate, only counts people who are out of work and have actively searched in the last four weeks.
Anyone who has stopped looking is excluded, which is why the number often looks cleaner than reality.
The household survey, which asks people directly if they are working, painted a more complicated picture.
It showed employment rising by 288k, the biggest increase since April.
But unemployment also rose, because more people entered the labor force than the economy could absorb.
It showed employment rising by 288k, the biggest increase since April.
But unemployment also rose, because more people entered the labor force than the economy could absorb.
The labor force participation rate, which measures the share of working-age people who are employed or looking, ticked up to 62.3 percent.
The employment-population ratio, which shows how many are actually working, stayed at 59.6 percent. Both remain lower than a year ago.
The employment-population ratio, which shows how many are actually working, stayed at 59.6 percent. Both remain lower than a year ago.
The broader U-6 measure of unemployment jumped to 8.1 percent, the highest since 2021.
This number doesn’t just count the officially unemployed.
It also includes people stuck in part-time jobs who want full-time work, as well as discouraged workers who have given up looking.
This number doesn’t just count the officially unemployed.
It also includes people stuck in part-time jobs who want full-time work, as well as discouraged workers who have given up looking.
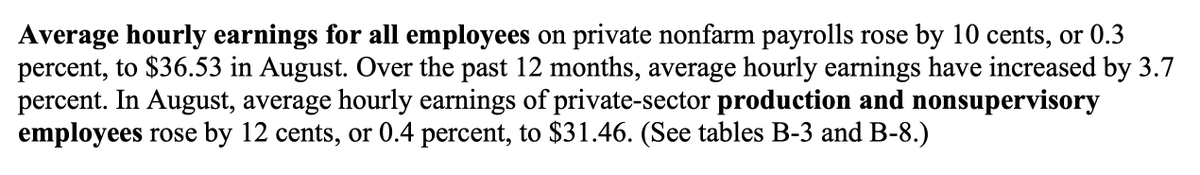
Wages cooled as well. Average hourly earnings rose just 0.3 percent in August, with annual growth slowing to 3.7 percent.
Last month, that pace was 3.9 percent. Forecasts called for 3.8 percent.
Workers are earning slightly more, but the gains are slipping while inflation lingers.
Last month, that pace was 3.9 percent. Forecasts called for 3.8 percent.
Workers are earning slightly more, but the gains are slipping while inflation lingers.
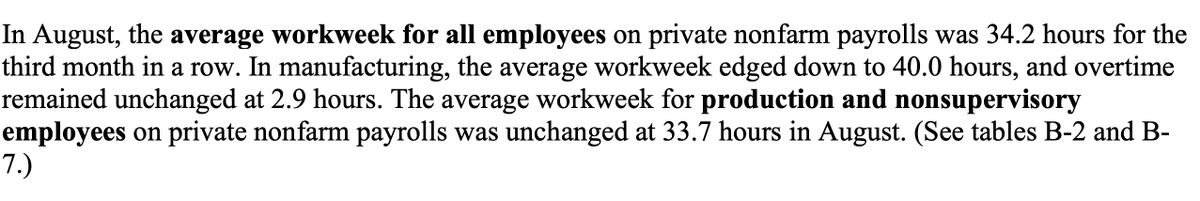
The length of the workweek stayed flat. Employees averaged 34.2 hours for the third straight month.
In manufacturing, hours edged lower to 40.0, with overtime unchanged at 2.9.
Hours worked act as a leading signal, and flat hours often mean employers don’t plan to expand hiring.
In manufacturing, hours edged lower to 40.0, with overtime unchanged at 2.9.
Hours worked act as a leading signal, and flat hours often mean employers don’t plan to expand hiring.
The composition of jobs tells the ugliest story.
Full-time positions fell by 357,000 in August. Part-time work surged by 597,000, the biggest increase since February.
Stable employment is shrinking, while patchwork hours are rising. That is not strength. That is weakness.
Full-time positions fell by 357,000 in August. Part-time work surged by 597,000, the biggest increase since February.
Stable employment is shrinking, while patchwork hours are rising. That is not strength. That is weakness.
The breakdown by origin also matters.
Native-born employment fell by 561,000, the sharpest decline since August 2024. At the same time, foreign-born employment rose by 50,000, the first gain since March.
The shifts are uneven, and they deepen the cracks.
Native-born employment fell by 561,000, the sharpest decline since August 2024. At the same time, foreign-born employment rose by 50,000, the first gain since March.
The shifts are uneven, and they deepen the cracks.
More people are working two or more jobs. The number of multiple jobholders soared by 443,000 to 8.8 million.
That’s the biggest monthly increase since the pandemic.
When households need multiple jobs to cover costs, the economy isn’t creating prosperity, it’s creating survival.
That’s the biggest monthly increase since the pandemic.
When households need multiple jobs to cover costs, the economy isn’t creating prosperity, it’s creating survival.
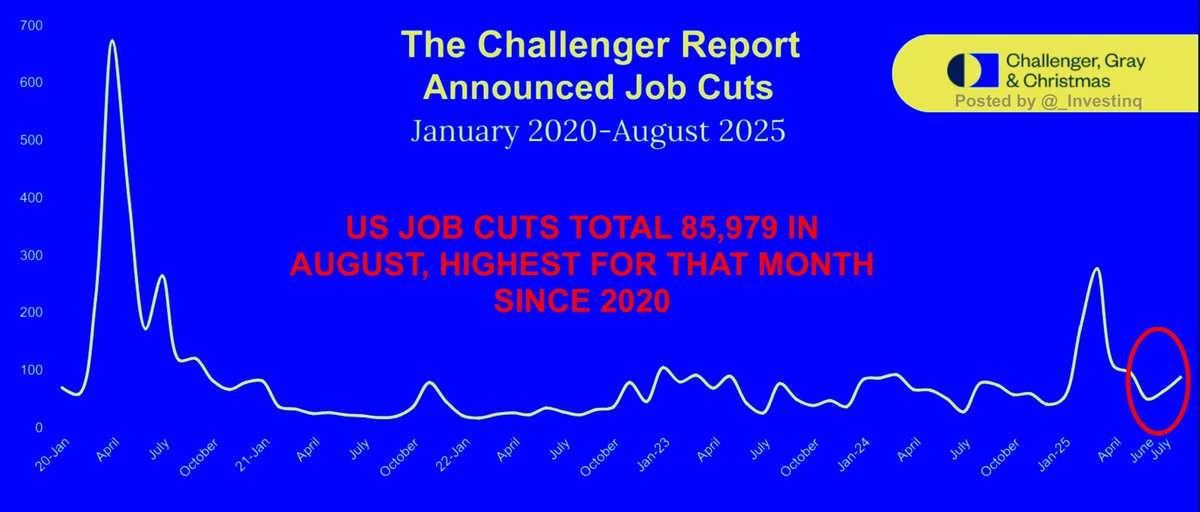
Announced job cuts show the same strain.
Challenger reported 88,736 layoffs in August, the highest August total since 2020. Year-to-date, companies have announced 892,362 job cuts, up 66 percent from last year.
Aside from 2020, you’d have to go back to 2008 to see August that bad.
Challenger reported 88,736 layoffs in August, the highest August total since 2020. Year-to-date, companies have announced 892,362 job cuts, up 66 percent from last year.
Aside from 2020, you’d have to go back to 2008 to see August that bad.
Long-term unemployment stayed at 1.9 million. But compared to a year ago, that figure is up by 385,000.
These are people who have been jobless for 27 weeks or more.
They now make up more than a quarter of all unemployed. The longer you’re out, the harder it is to re-enter.
These are people who have been jobless for 27 weeks or more.
They now make up more than a quarter of all unemployed. The longer you’re out, the harder it is to re-enter.
Hidden weakness shows up in those who aren’t officially counted.
4.7 million people are stuck in part-time jobs they don’t want.
Another 6.4 million say they want a job but haven’t searched recently, so they don’t show up in the unemployment rate. That is shadow slack.
4.7 million people are stuck in part-time jobs they don’t want.
Another 6.4 million say they want a job but haven’t searched recently, so they don’t show up in the unemployment rate. That is shadow slack.
Among those not in the labor force, 1.8 million are considered marginally attached.
These are people who want work, are available for it, and have looked sometime in the last year but not in the past four weeks.
Inside that group are 514,000 discouraged workers who believe no jobs exist.
These are people who want work, are available for it, and have looked sometime in the last year but not in the past four weeks.
Inside that group are 514,000 discouraged workers who believe no jobs exist.
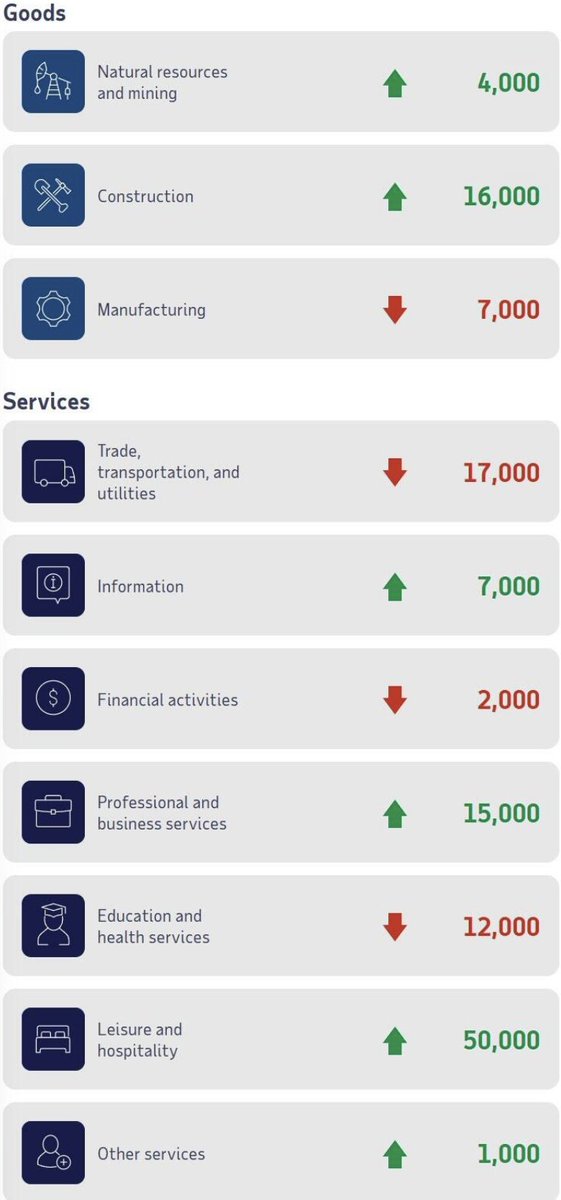
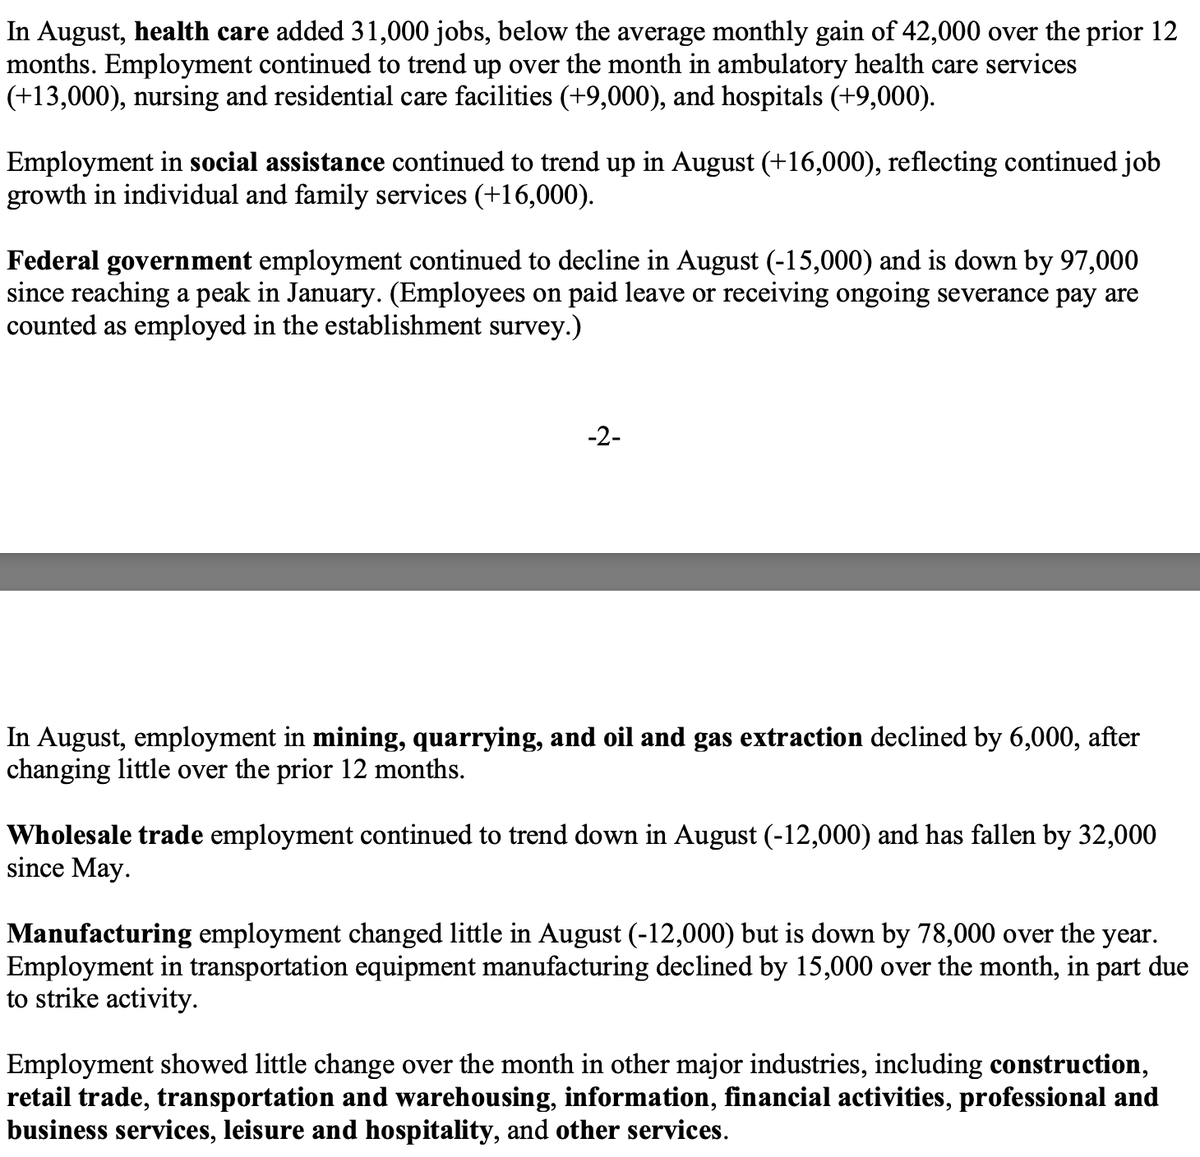
Industries reflected the imbalance.
Health care added 31,000 jobs. Social assistance added 16,000. But the federal government lost 15,000.
Manufacturing fell by 12,000. Wholesale trade dropped 12,000. Mining and oil declined by 6,000. Transportation equipment dropped 15,000, partly from strikes.
Health care added 31,000 jobs. Social assistance added 16,000. But the federal government lost 15,000.
Manufacturing fell by 12,000. Wholesale trade dropped 12,000. Mining and oil declined by 6,000. Transportation equipment dropped 15,000, partly from strikes.
The diffusion index, which measures how many industries are adding jobs, came in at 49.6.
A score of 50 would mean half of industries growing and half shrinking.
Anything below 50 means more are declining. The current number signals narrow gains and broad losses.
A score of 50 would mean half of industries growing and half shrinking.
Anything below 50 means more are declining. The current number signals narrow gains and broad losses.
Taken together, this was the ugliest jobs report since COVID relative to expectations.
Full-time employment collapsing. Part-time rising. Native-born employment plunging.
Multiple jobholding soaring. Job cuts spiking. And revisions destroying prior optimism.
Full-time employment collapsing. Part-time rising. Native-born employment plunging.
Multiple jobholding soaring. Job cuts spiking. And revisions destroying prior optimism.
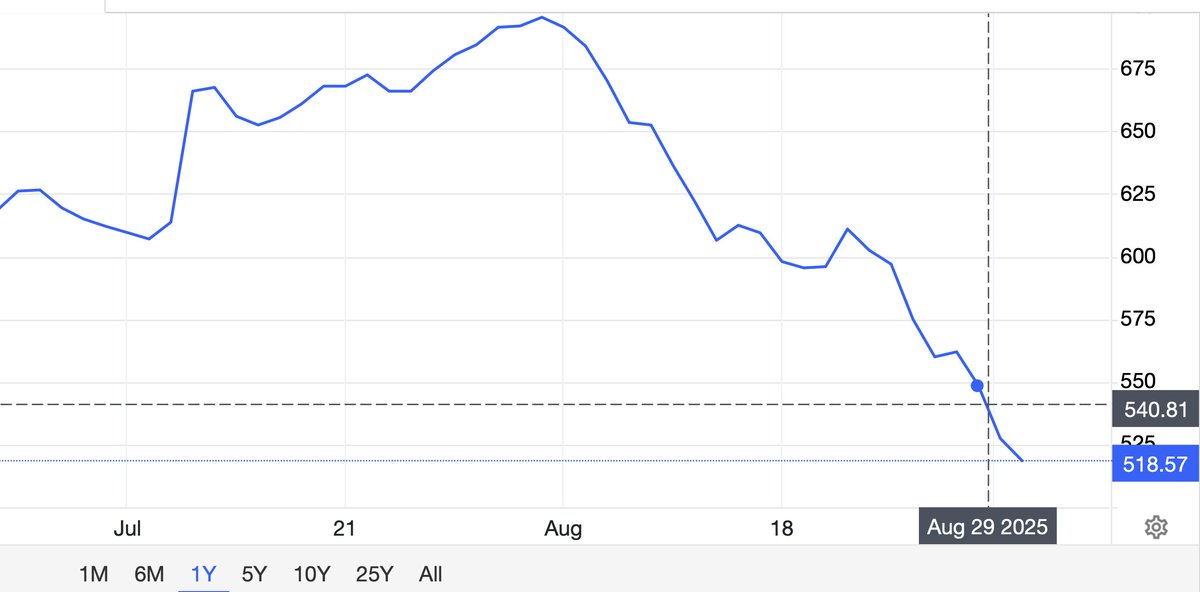
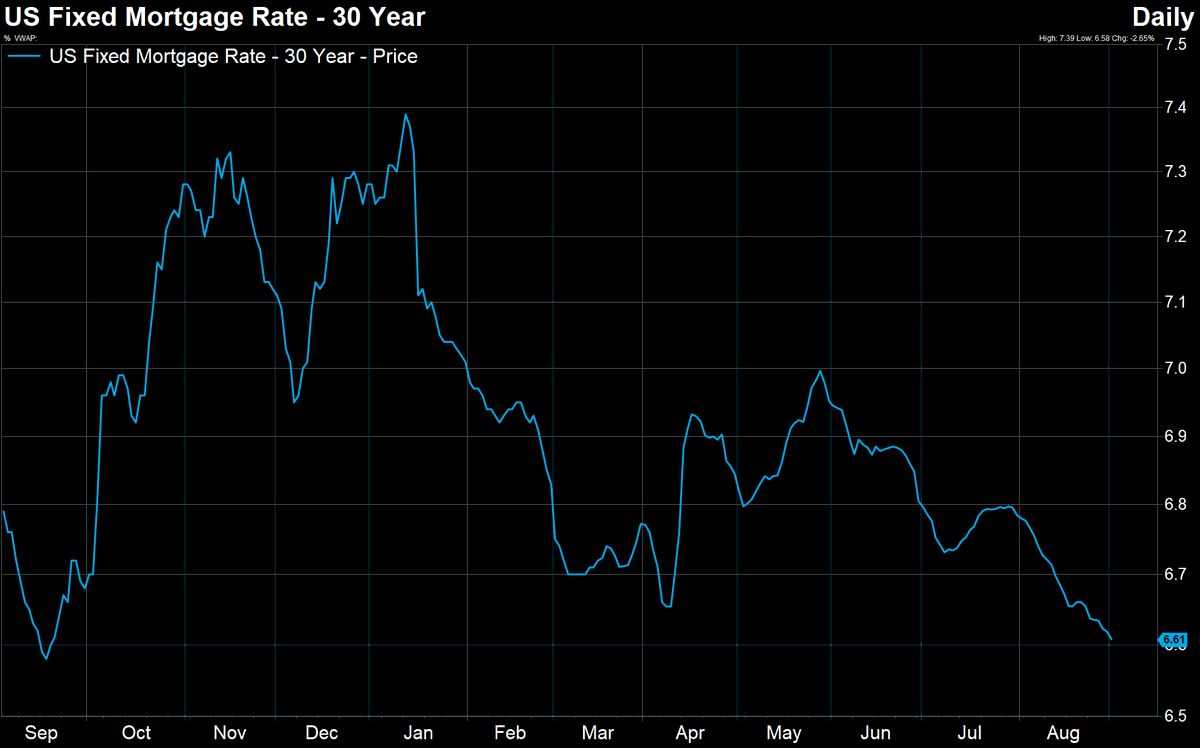
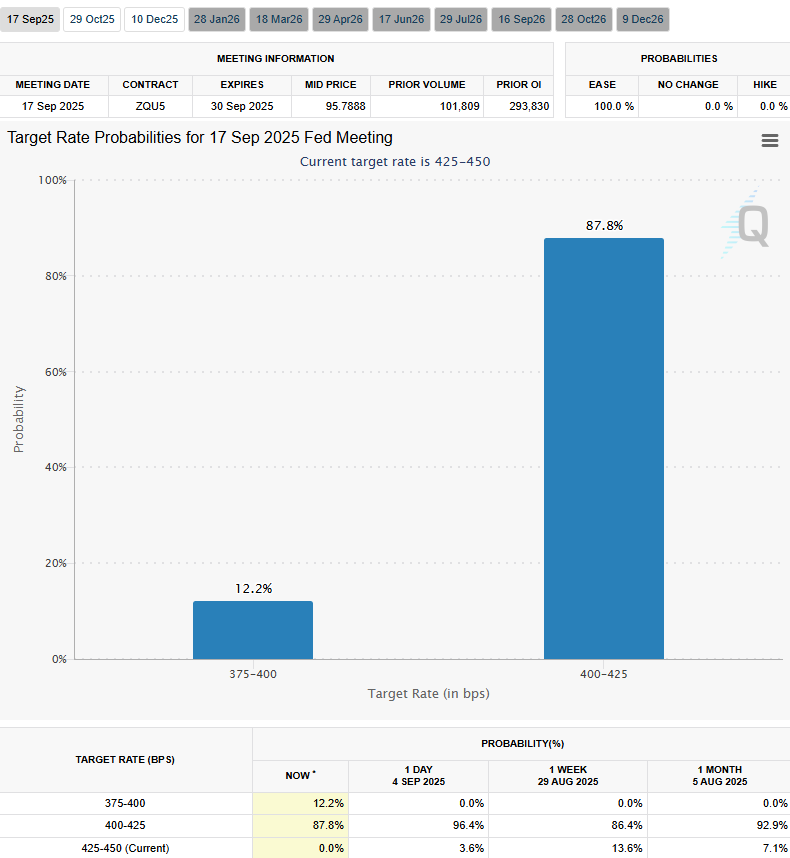
Markets reacted immediately.
Before the report, a September rate cut was highly likely but not guaranteed. After, the odds of a 25 basis point cut hit 88 percent. Odds of a larger 50 basis point cut jumped to 12 percent.
Yields collapsed as investors shifted from cautious to panicked.
Before the report, a September rate cut was highly likely but not guaranteed. After, the odds of a 25 basis point cut hit 88 percent. Odds of a larger 50 basis point cut jumped to 12 percent.
Yields collapsed as investors shifted from cautious to panicked.
This is stagflation in motion. Growth is fading. Jobs are disappearing.
Wages are cooling. Inflation is still sticky. Families are falling behind while the Fed is boxed in.
Cut too little and unemployment rises. Cut too much and inflation flares back up.
Wages are cooling. Inflation is still sticky. Families are falling behind while the Fed is boxed in.
Cut too little and unemployment rises. Cut too much and inflation flares back up.
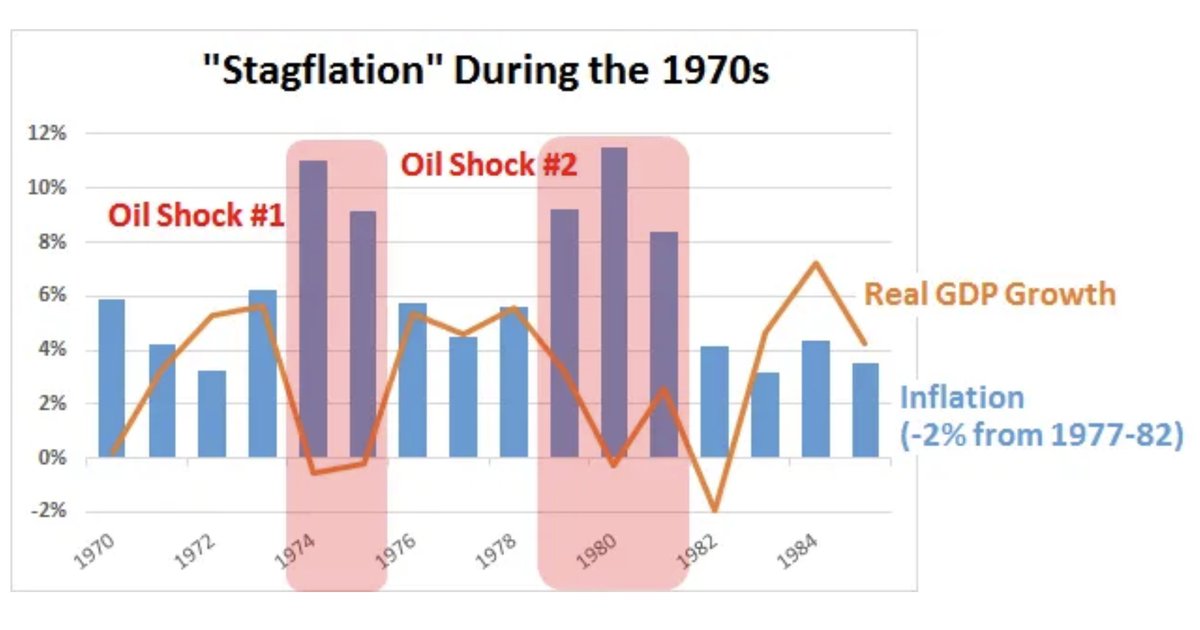
The last time stagflation gripped the U.S. was in the 1970s. Oil shocks drove prices higher while growth slowed.
The Fed hiked rates sky-high to crush inflation, triggering back-to-back recessions.
Today, the risks are even sharper with higher debt and fragile supply chains.
The Fed hiked rates sky-high to crush inflation, triggering back-to-back recessions.
Today, the risks are even sharper with higher debt and fragile supply chains.
And this may only be the beginning.
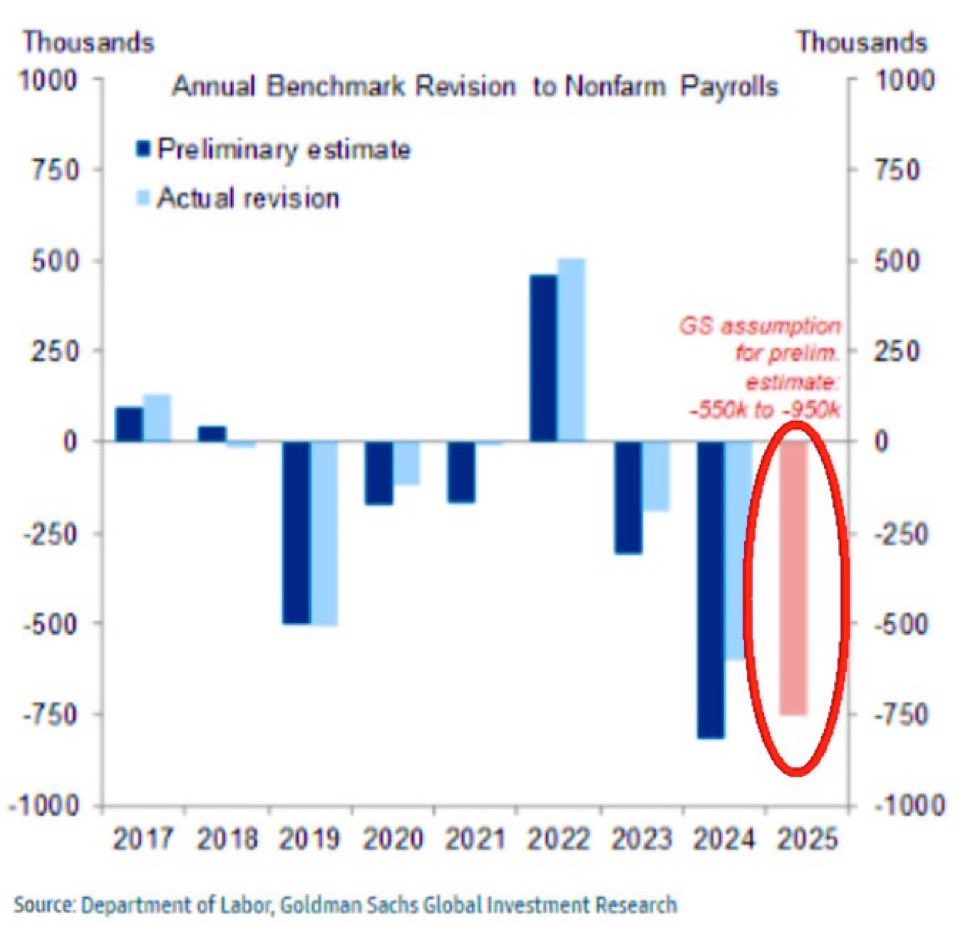
In just a few days, the BLS will publish its annual revision covering the past year of job data. Wall Street expects 550k to 950k jobs could be erased from the books.
That would be the largest downward adjustment since 2010.
In just a few days, the BLS will publish its annual revision covering the past year of job data. Wall Street expects 550k to 950k jobs could be erased from the books.
That would be the largest downward adjustment since 2010.
If that happens, the already fragile numbers we just saw won’t just look weak. They’ll look overstated for months.
It would mean the labor market has been softer all along, and the slowdown is sharper than people thought in real time.
It would mean the labor market has been softer all along, and the slowdown is sharper than people thought in real time.
If you found these insights valuable: Sign up for my FREE newsletter! thestockmarket.news
I hope you've found this thread helpful.
Follow me @_Investinq for more.
Like/Repost the quote below if you can:
Follow me @_Investinq for more.
Like/Repost the quote below if you can:
https://x.com/_investinq/status/1963974232842424585?s=46
@VladTheInflator @FinanceLancelot @StealthQE4
• • •
Missing some Tweet in this thread? You can try to
force a refresh