Capital Flows Profile picture
Sep 5 9 tweets 2 min read Read on X
MACRO FLOWS 🧵

Every asset lives on two axes of risk:

Duration risk → how inflation erodes value over time

Credit risk → how growth enables or undermines repayment

These forces connect across the entire risk curve. Understanding them is the foundation of macro attribution
Duration risk = time.
The longer you wait to be paid, the more exposed you are to inflation and rate shifts.

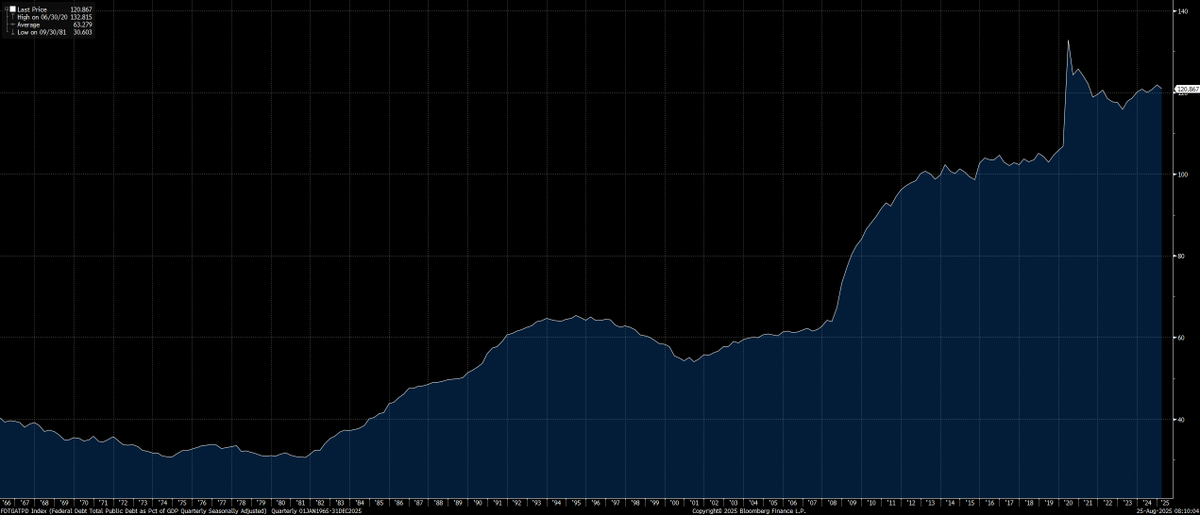
Credit risk = solvency.
The weaker growth is, the higher the chance of default.

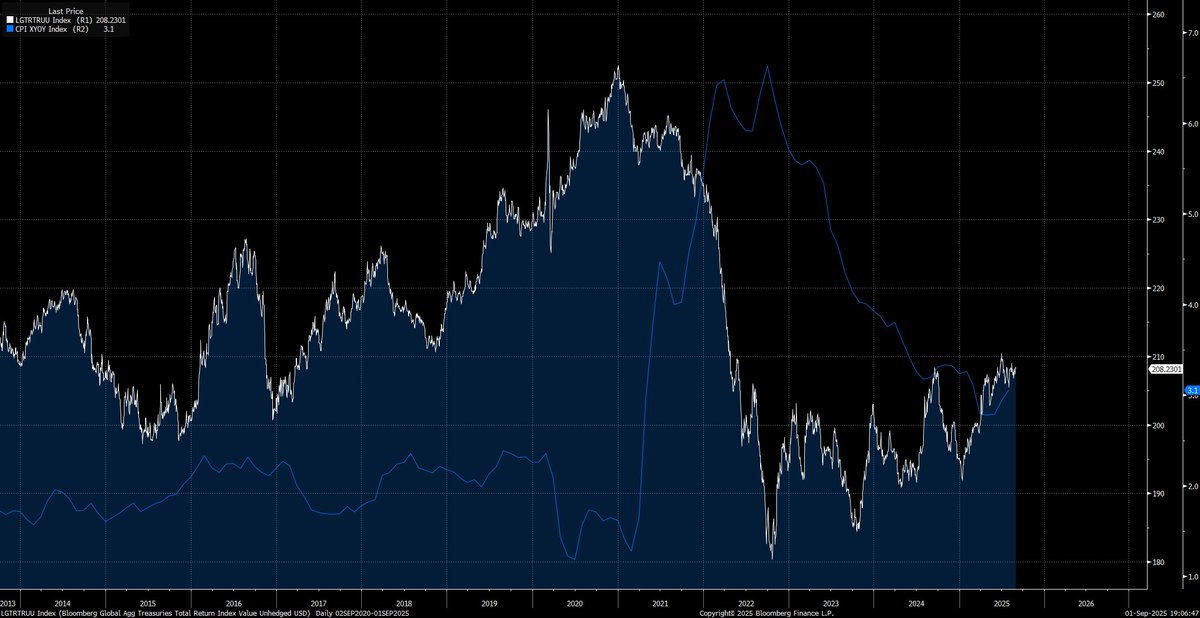
Inflation amplifies duration risk.
Growth amplifies credit risk.
Map it to the duration risk curve:

Bills = near zero duration.

Long bonds, growth stocks, real estate = high duration.

When inflation is stable, the curve is flat.
When inflation spikes, the curve steepens violently: long-duration assets underperform.
Map it to the credit risk curve:

Sovereign bills = near zero credit risk.

IG → HY → EM → equities → alts = progressively higher credit risk.

When growth is strong, spreads compress outward.
When growth stalls, spreads blow out and capital rushes back to safety.
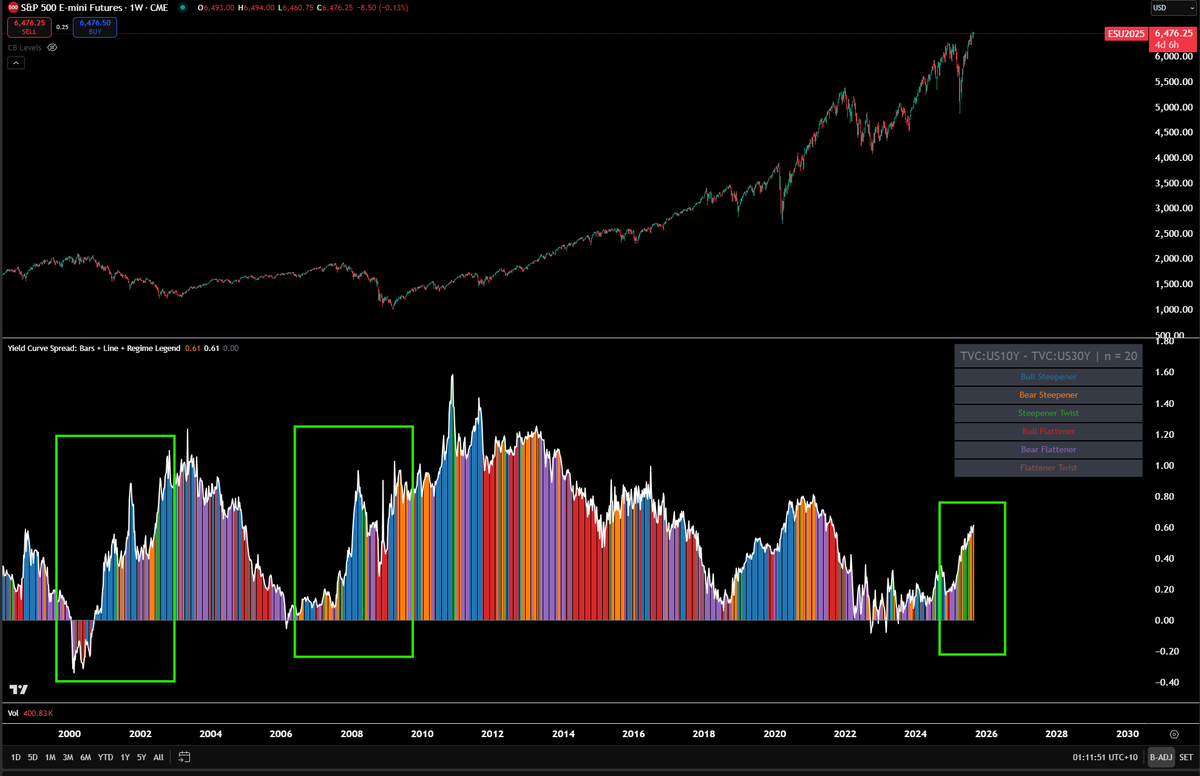
Together, these two curves form a multivariate map of capital flows:

Inflation shock? Duration curve steepens. Bonds and growth equities sell off.

Growth shock? Credit curve steepens. Credit spreads widen, risk assets underperform.

Assets reprice along both curves at once.
Attribution analysis means asking:
How much of today’s asset move is duration-driven vs. credit-driven?
Tech stocks falling in 2022 → mostly duration risk repricing.

HY spreads widening in 2020 → credit risk repricing.

2022 stagflation → both curves steepened at once. That’s why nothing worked.
The net effect across the risk curve comes from the interaction of the two.

Growth with stable inflation = sweet spot. Duration and credit risks both compressed. All assets rally.

Inflation with weak growth = toxic. Both curves steepen. Correlations go to one.

That’s the macro map.
This is the simplest framework that explains why assets move together or diverge.

Duration risk maps to inflation.
Credit risk maps to growth.

The balance between the two curves sets the distribution of outcomes across the risk curve.

That’s the core of macro attribution.
All the educational primers explaining these forces are free here: capitalflowsresearch.com/p/research-syn…

• • •

Missing some Tweet in this thread? You can try to force a refresh
 

Keep Current with Capital Flows

Capital Flows Profile picture

Stay in touch and get notified when new unrolls are available from this author!

Read all threads

This Thread may be Removed Anytime!

PDF

Twitter may remove this content at anytime! Save it as PDF for later use!

Try unrolling a thread yourself!

how to unroll video
  1. Follow @ThreadReaderApp to mention us!

  2. From a Twitter thread mention us with a keyword "unroll"
@threadreaderapp unroll

Practice here first or read more on our help page!

More from @Globalflows

Sep 5
Positioning in Gold and Bitcoin right now is at a bit of an inflection point

These are very important to know in relation to macro flows, and if we hold these 110k levels in Bitcoin 🧵
First, gold skew has been blowing out as traders pay a premium to have long exposure

This is directly connected to how we are seeing the Fed's stance as they allow cuts to be priced into the forward curve post Jackson Hole. The red line shows 25DC vs 25DP implied volatility. Image
The call skew in gold has occurred at the same time gold rallies and outperforms Bitcoin. Notice that the same time call skew in gold started to rise, Bitcoin starts underperforming gold (recent red regime)

If you want to use the script for this, its linked in here for free: capitalflowsresearch.com/p/research-syn…Image
Read 7 tweets
Sep 5
The NFP print today and other labor market prints we have seen this week fall directly in line with the credit cycle flows that are taking place

Here is a full breakdown of how the flows are functioning and what is likely to take place into FOMC 🧵
When we were at the lows in equities earlier in April, it was clear that a recession was NOT on the table due to the resilience in the labor market. However, the market was pricing almost 150bps of cuts for 2025 in the Z5 SOFR contract. Since that time, the entire forward curve has unwound to price LESS cuts. The last NFP print was the data release that set the low in the Z5 SOFR contract but this also overlapped with the Fed beginning to overemphasize growth as opposed to inflation risk in their rhetoric.

After all the labor markets this week, we are now at a points where the forward curve is pricing almost 75bps of cuts for this year which means a 25bps cut at all of the 3 remaining meetings for this year.Image
The question we need to ask is, HOW STRONG is the labor market, and HOW does this connect to the credit cycle?

First, we know the 3 month trend in NFP is at a lower LEVEL than it was in 2024. Image
Read 15 tweets
Sep 2
Mapping the Risk Curve and How Credit & Duration Risk Shape Every Asset 🧵

This is HOW you can know WHEN the credit cycle is likely coming to an end

(bookmark this one) Image
The “risk curve” is the map of capital flows.
On the far left sit safe assets—cash, T-bills, short Treasuries.

Move outward and you climb the ladder: investment grade bonds, high yield, equities, emerging markets, private credit, crypto.

This is how capital rotates.
Two forces steer this curve:

Credit risk → will you get your money back?

Duration risk → what will your money be worth when you get it back?

Every asset sits somewhere on this spectrum. Shift one of these risks, and capital rotates.
Read 17 tweets
Sep 2
Everyone maps the credit cycle as “sentiment shifts.”

Hope>Optimism>Belief>Thrill>Euphoria>Complacency>Anxiety>Denial>Panic>Anger>Depression>Disbelief

That framing is outdated because it misses the real driver: macro flows across balance sheets🧵 Image
The cycle isn’t psychology.
It’s accounting.

Balance sheets expand when nominal growth outpaces discount rates.

Flows push outward along the risk curve—not because investors “feel good,” but because debt service improves.
As I laid out earlier this year, investors are CONSTRAINED to buy or sell. This is WHY we have seen the rally thus far YTD.
Read 8 tweets
Sep 2
The Time Bomb of Duration Risk 🧵
1/ Duration risk is the silent killer in portfolios. It’s not about price today; it’s about how much tomorrow’s cash flows are worth when inflation and interest rates move. Image
Every asset has a clock built into it. A 30-year bond? Long clock. A 3-month T-bill? Short clock. The longer the clock runs, the more uncertainty inflation injects into those future dollars.
That’s why inflation is the enemy of bonds. A bond that pays 2% while inflation runs at 5% is just a slow-motion loss machine. Duration magnifies the pain.

(Chart below is CORE CPI and the Bloomberg Treasuries index) Image
Read 7 tweets
Aug 25
While many people have misunderstood the changes in the yield curve over the last 3 years, we are seeing a clear indication that recession risk remains LOW and nominal growth is rising

The changes in the curve and currency that will frame all flows as we move into FOMC

🧵👇 Image
As we see an increase in the amount of government debt in the system, everything is becoming leveraged to changes in interest rates in a more concentrated way.

When debt to GDP is this high (chart below), the government won't have issues refinancing but they will have issues in how this transmits through the economy, balance of payments, and currency.Image
Why have so many people bet on recession and misunderstood the changes we are seeing in interest rates, though?

One of the main reasons is that people are not looking at WHY the yield curve is moving up or down. In the steepening that took place during the 2000 and 2008 crash, it was bull steepening which was the Fed cutting as long end rates fall. We are seeing the OPPOSITE now with bear steepening and steepener twist which is long end rates RISING.

You can find the yield curve indicator here: tradingview.com/chart/3zwnYfTw/Image
Read 11 tweets

Did Thread Reader help you today?

Support us! We are indie developers!


This site is made by just two indie developers on a laptop doing marketing, support and development! Read more about the story.

Become a Premium Member ($3/month or $30/year) and get exclusive features!

Become Premium

Don't want to be a Premium member but still want to support us?

Make a small donation by buying us coffee ($5) or help with server cost ($10)

Donate via Paypal

Or Donate anonymously using crypto!

Ethereum

0xfe58350B80634f60Fa6Dc149a72b4DFbc17D341E copy

Bitcoin

3ATGMxNzCUFzxpMCHL5sWSt4DVtS8UqXpi copy

Thank you for your support!

Follow Us!

:(