
Christian | Mapping the macro regime across rates, FX & equities to find home run trades | Streaming live every weekday at 8:30am MST | Free daily reports ⬇️
 All of these factors as well as the models to map them will be laid out in the livestream I am doing in a few hours. If you want a deeper explanation with all of the tensions and qualifications for trading, you can join by saving this link

 Most people only think about price action relative to fundamentals when there are so many microstructure changes and positioning changes that influence it. For example, across all expirations, we only have strikes up to $18 right now. As traders buy more OTM calls, market makers need to hedge their risk by buying the underlying stock as the price goes higher or volatility rises. Once new strikes get listed, this immediately creates an opportunity for traders to roll their calls. This is especially attractive if the stock is melting up as implied volatilitiy is rising. And guess what is happening right now with $PURR ? (next tweet shows the chart of this)
 I will be covering this entire idea in depth on the livestream starting in 30 mins: youtube.com/watch?v=XnNtPg…
 The current credit cycle melt-up is being driven by two things:
  I explained in my last thread how the changes in inflation and response of central banks is creating a net liquidity injection as real rates fall and capital moves out the risk curve into the largest IPOs in US history.
  First, you need to understand how capital works in the system. Melt ups NEVER occur because of "investor sentiment" or euphoria, those are simply a reflection of the liquidity changes under the surface.
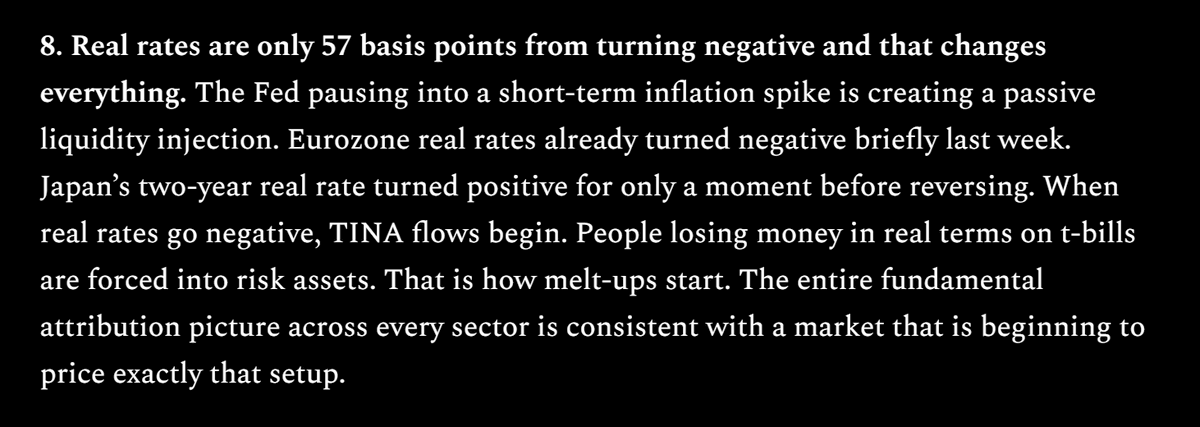
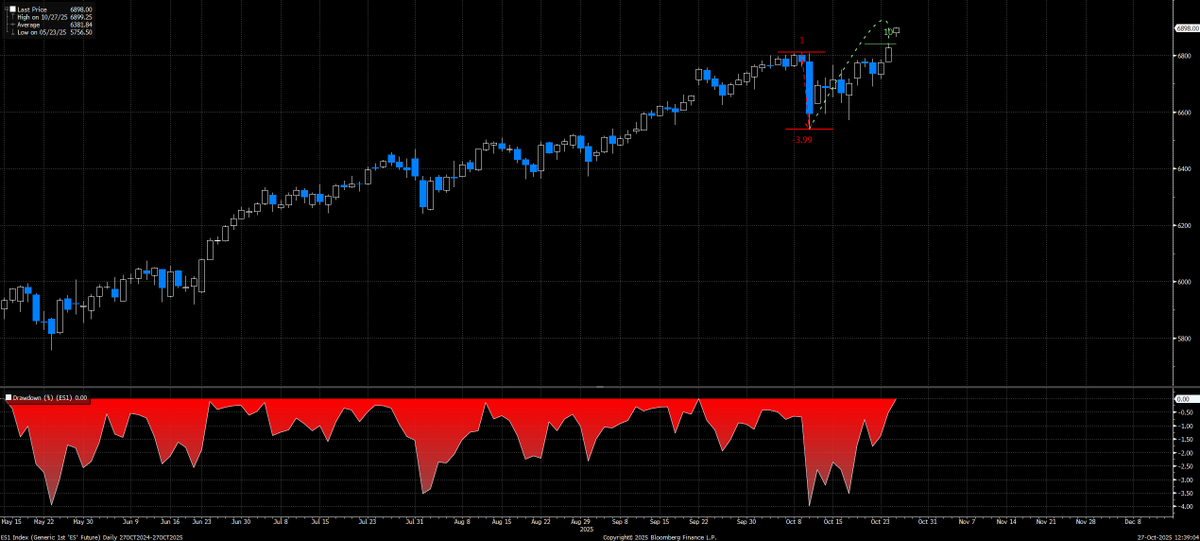
 The view I have been laying out for FOMC is straightforward. The exit is getting more and more crowded as traders bid up large premiums across equities, FX, bonds, and crude.
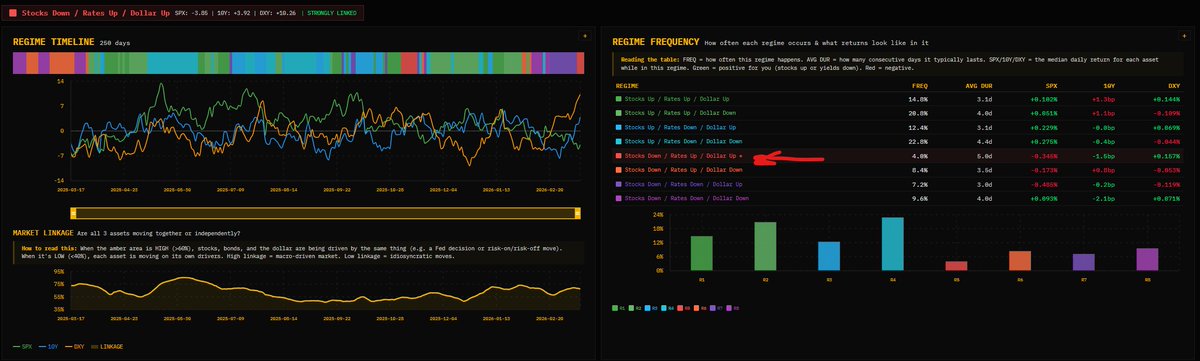 I explained the mechanics of the dashboard above, along with an extensive breakdown of the macro regime in the livestream earlier today. You can find the full recording here:
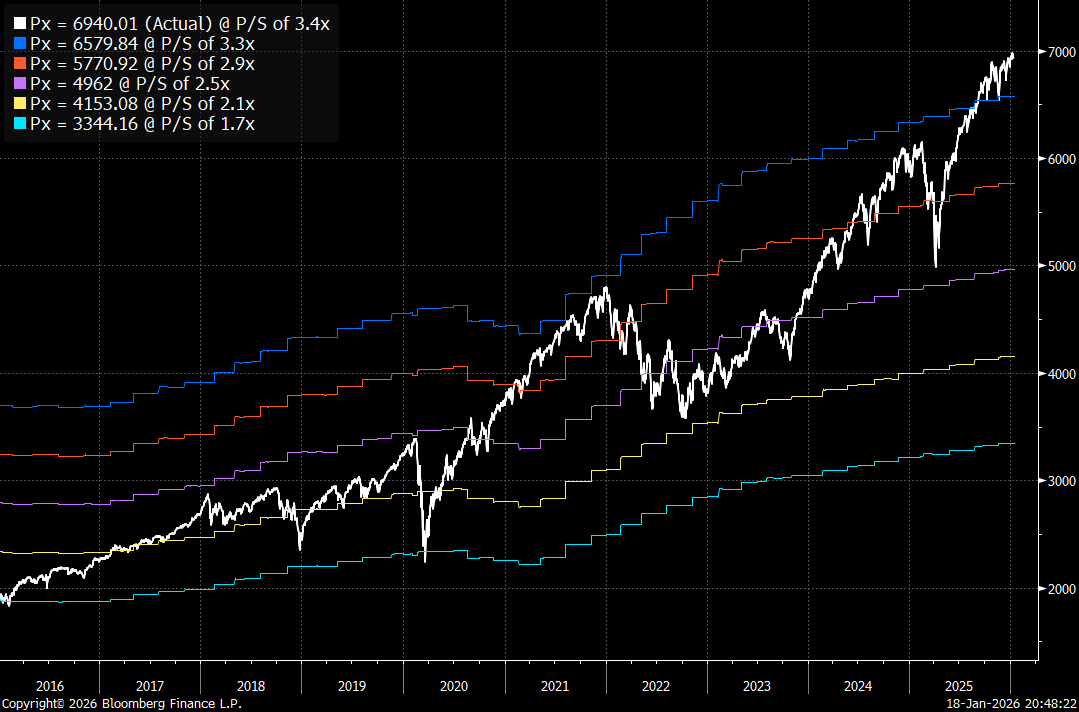 I am going to explain WHERE we are in the credit and liquidity cycle and then break down HOW I am looking at the signals for taking risk. These set the stage for the S&P500, Bitcoin, gold, silver, and every major asset.
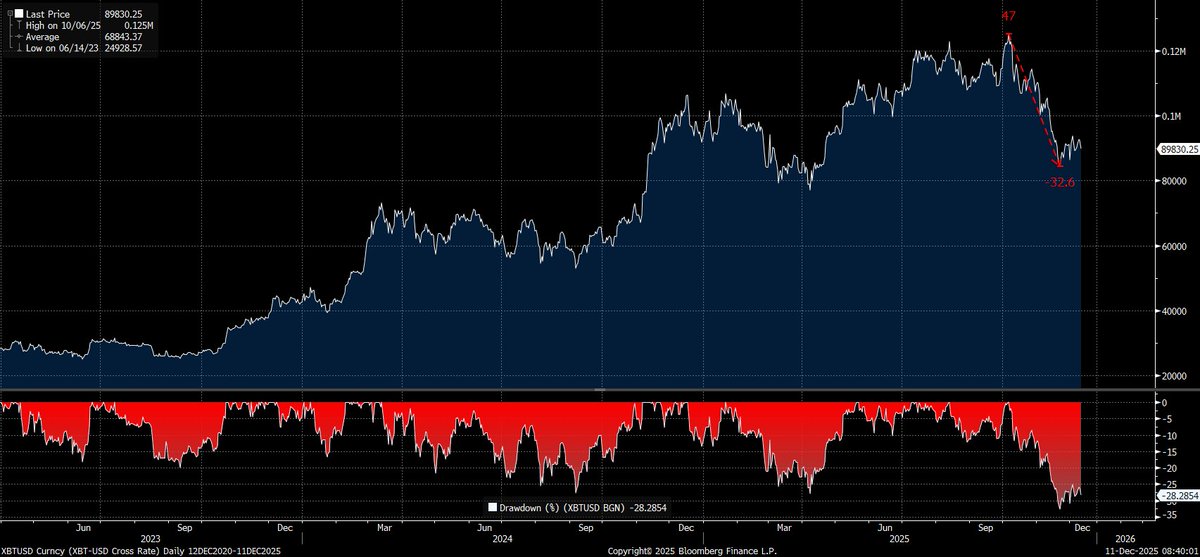 First, Bitcoin functions as a release valve for macro liquidity on the RISK CURVE. This means Bitcoin is telling you that it is a risk asset.
  First, my macro thesis is simple: Since April we had a massive injection of credit into the underlying economy and liquidity into financial markets. This created procyclical liquidity where growth and liquidity rose at the same time. This is why asset prices melted up.
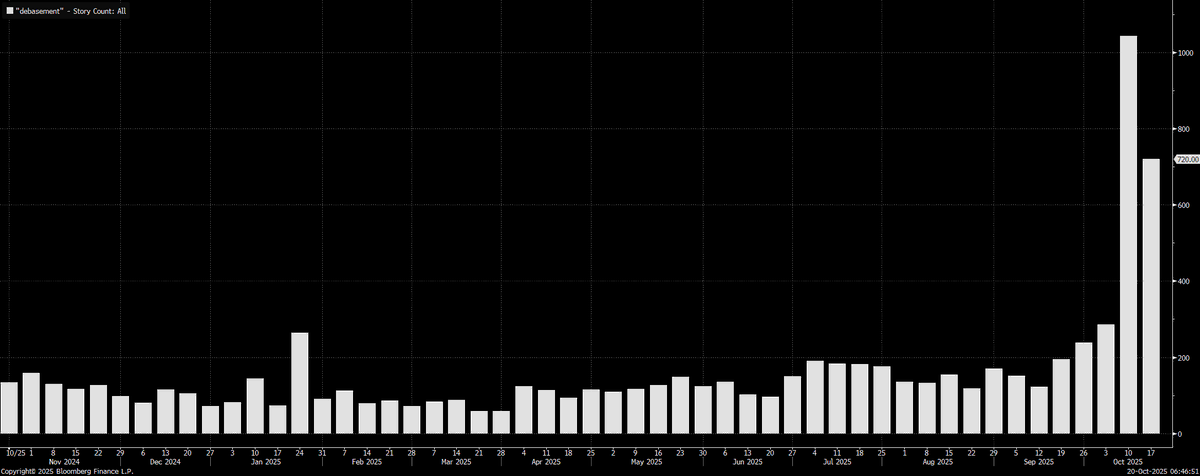
 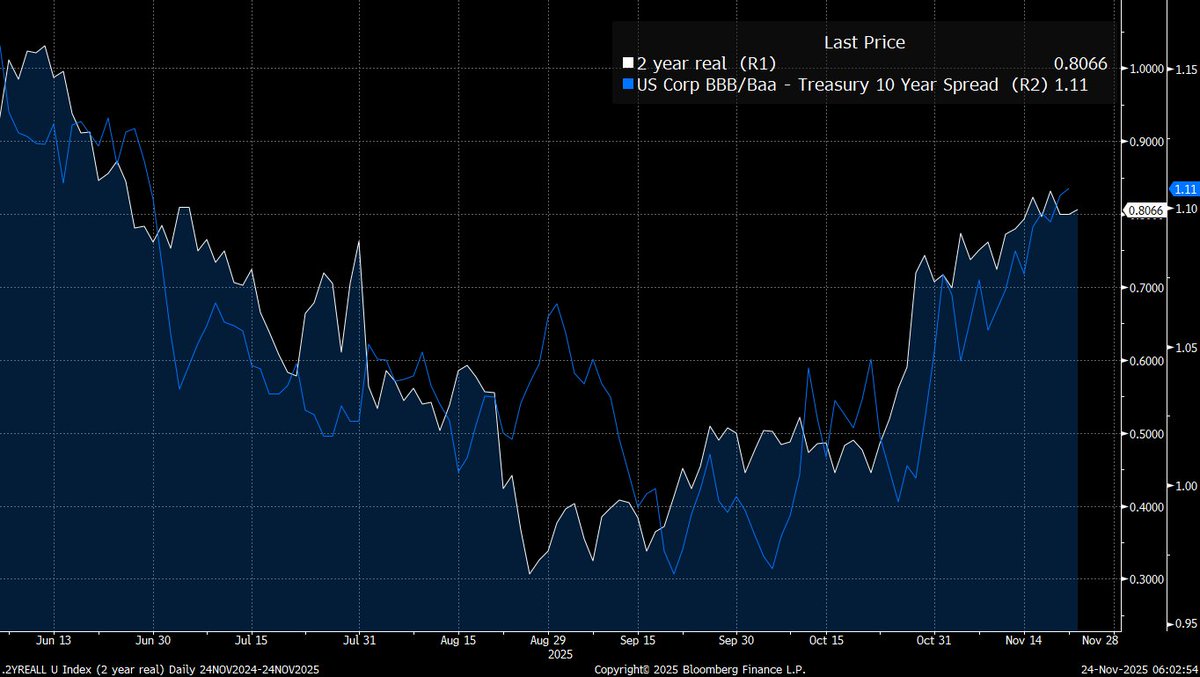 Real rates tell you the true cost of money after adjusting for inflation.
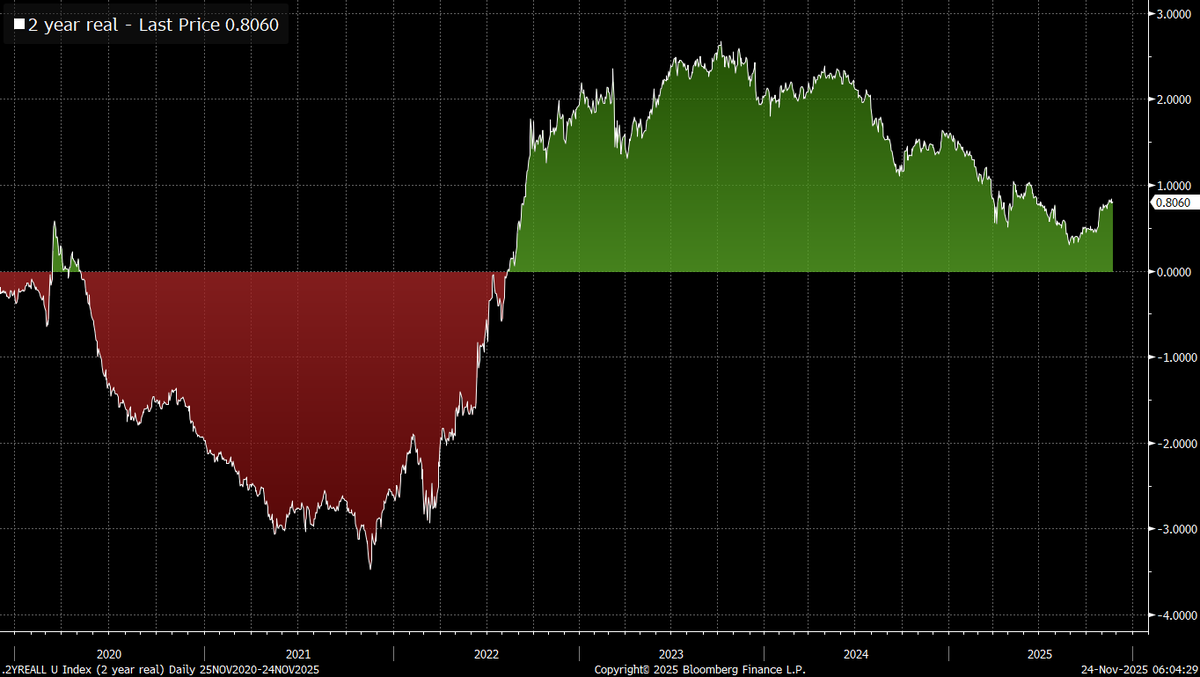
 First,
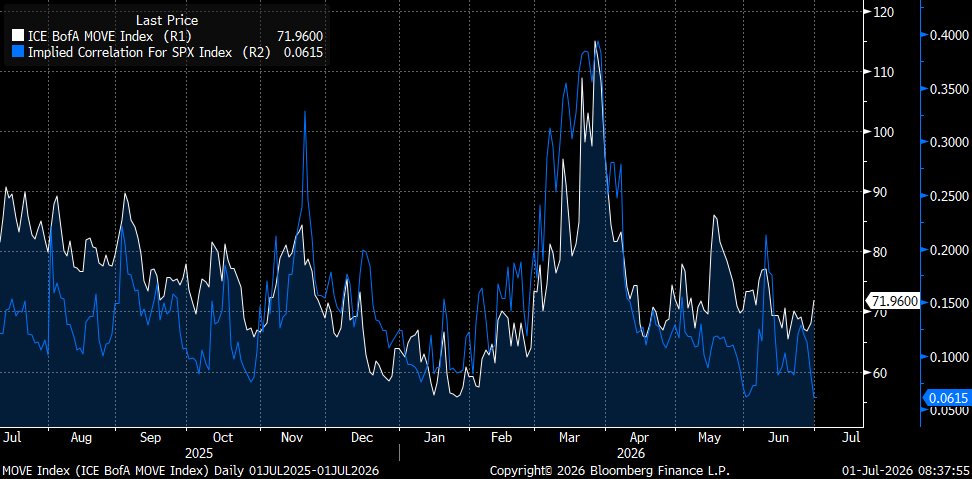
 The primary place to start is HOW interest rates are impacting equities
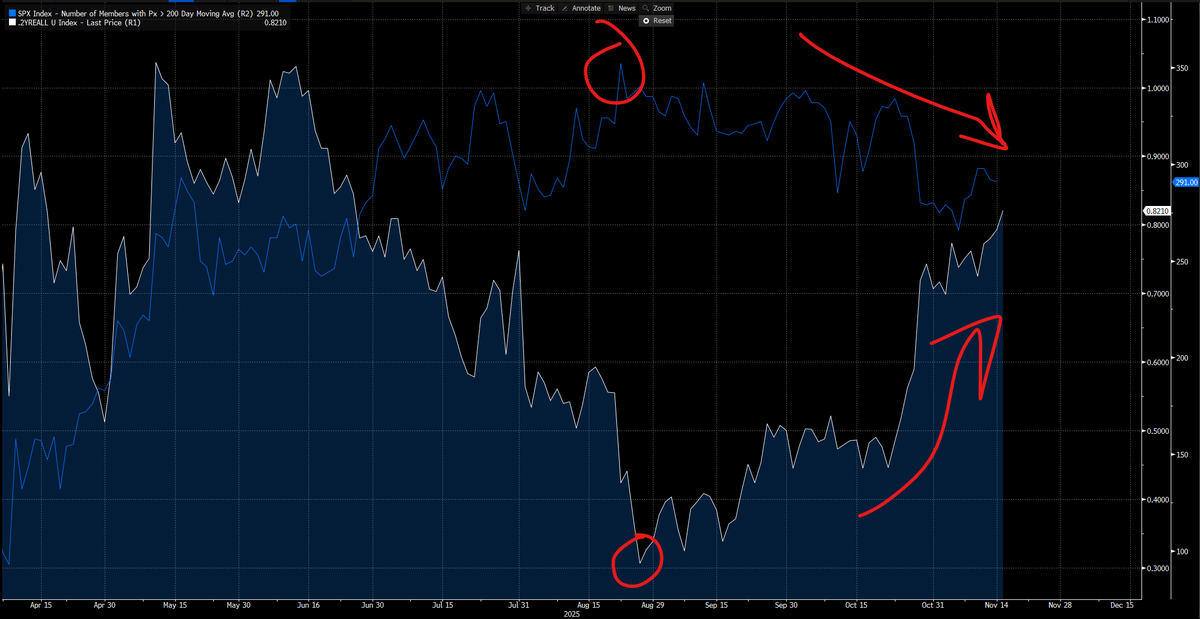
 The main divergence we are seeing taking place right now is Mag7 (blue) has been pulling the index HIGHER as the broad market breadth is falling
 The Fed’s transmission mechanism lifts asset prices faster than wages. QE and low rates raise the price of duration assets first. Households with assets gain. Households living on labor incomes lag.
 Many people are saying the rate cut this week is WHY equities are rallying, but this is completely wrong.
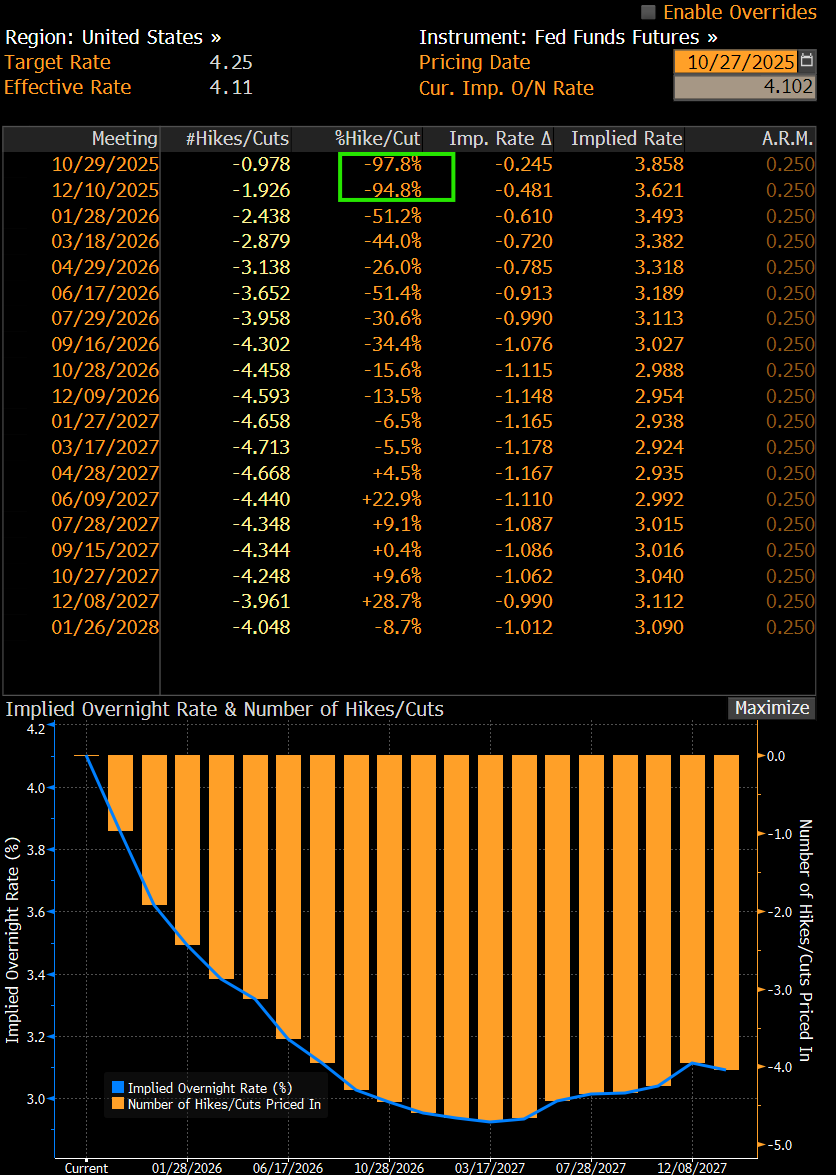
 When I analyze the macro flows across every asset, I am always looking for where expectations have a significant divergence from what is likely to take place. The key thing I look for is when expectations are based on an uninformed presupposition.