In this THREAD I will explain “Basic Trading Indicators”
1. MACD
2. Orderbook
3. Trend Bands
4. Volume Delta
🧵(1/15)
1. MACD
2. Orderbook
3. Trend Bands
4. Volume Delta
🧵(1/15)

1. MACD
MACD indicator is used to identify trends, potential reversals and momentum in a given asset.
MACD consists of three main parts:
- The MACD line
- The Signal line
- The Histograms
MACD indicator is used to identify trends, potential reversals and momentum in a given asset.
MACD consists of three main parts:
- The MACD line
- The Signal line
- The Histograms

1.1 MACD
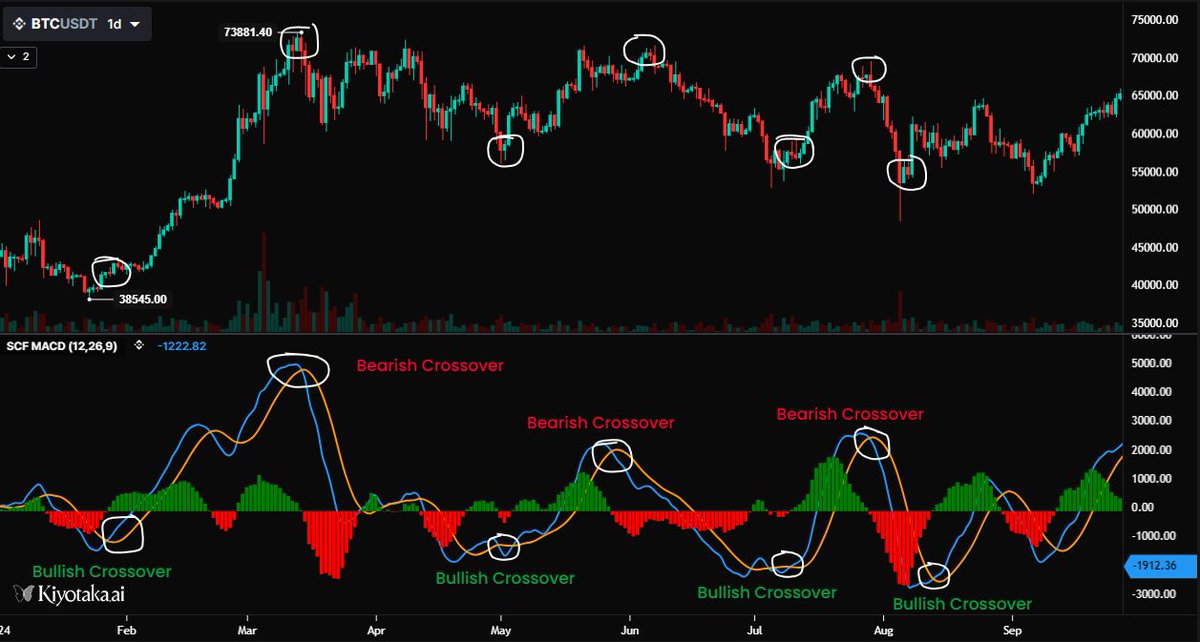
MACD Crossovers signal momentum shifts:
Bullish Crossover: Blue line crosses above orange = potential uptrend
Bearish Crossover: Blue line drops below orange = potential downtrend
MACD Crossovers signal momentum shifts:
Bullish Crossover: Blue line crosses above orange = potential uptrend
Bearish Crossover: Blue line drops below orange = potential downtrend
1.2 MACD
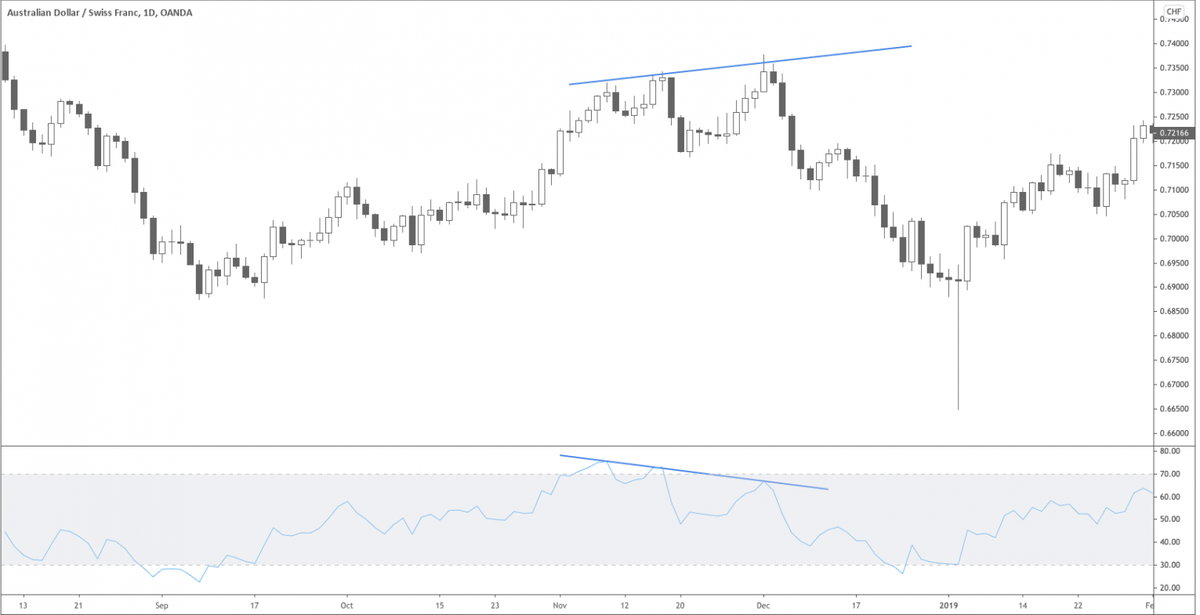
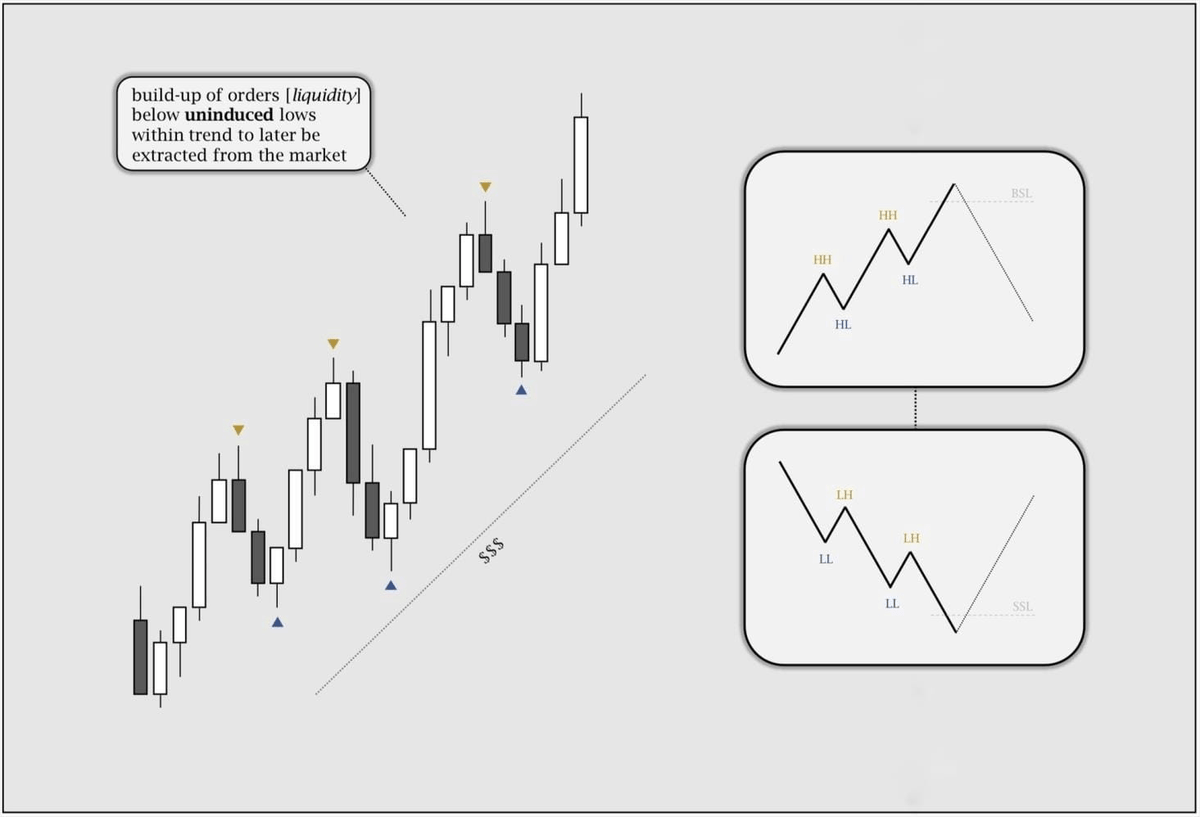
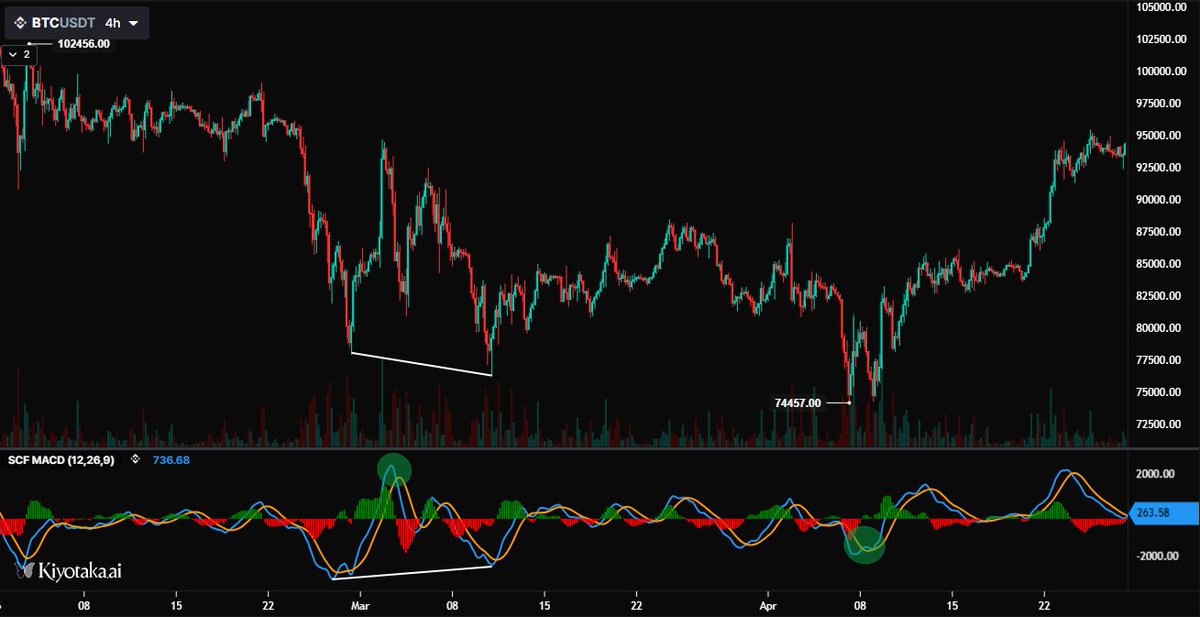
This chart shows a classic MACD Bullish Divergence setup:
Price makes a Lower Low
MACD makes a Higher Low
This signals weakening bearish momentum and a potential trend reversal to the upside.
The divergence + bullish MACD crossover = strong buy signal
This chart shows a classic MACD Bullish Divergence setup:
Price makes a Lower Low
MACD makes a Higher Low
This signals weakening bearish momentum and a potential trend reversal to the upside.
The divergence + bullish MACD crossover = strong buy signal
1.3 MACD
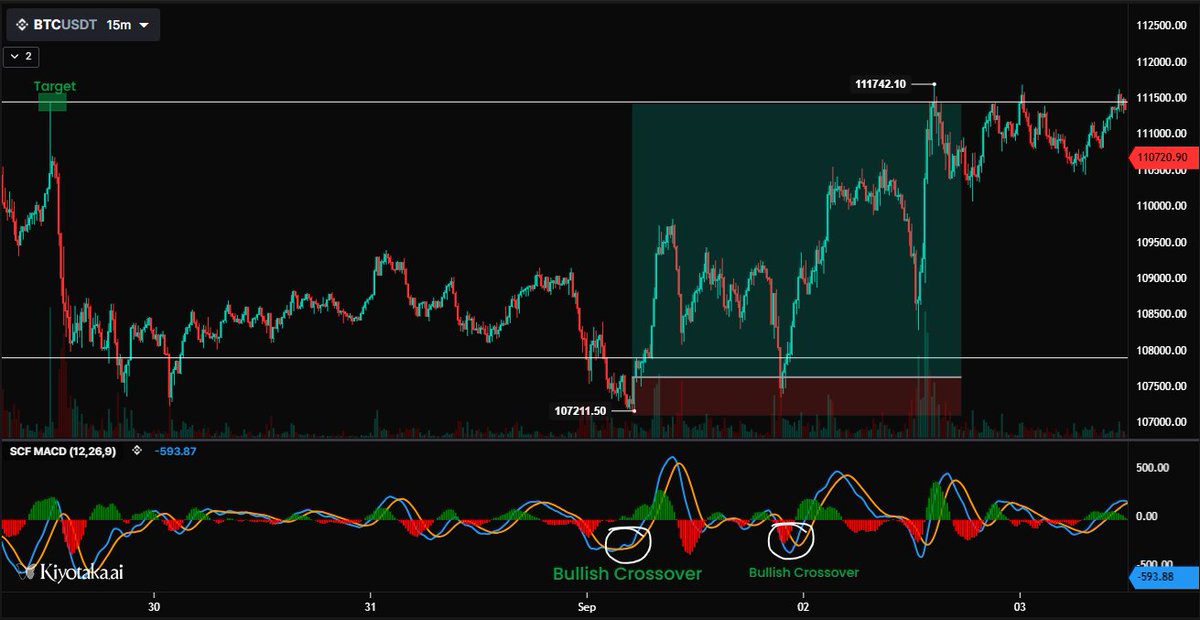
Successful BTC LONG on the 15m Timeframe:
1. Price forms a local bottom at $107k
2. A Bullish Crossover on the MACD confirms entry. Blue line crosses above orange
3. Strong momentum, price hits the target
MACD helped time the entry with trend confirmation
Successful BTC LONG on the 15m Timeframe:
1. Price forms a local bottom at $107k
2. A Bullish Crossover on the MACD confirms entry. Blue line crosses above orange
3. Strong momentum, price hits the target
MACD helped time the entry with trend confirmation
2. Orderbook
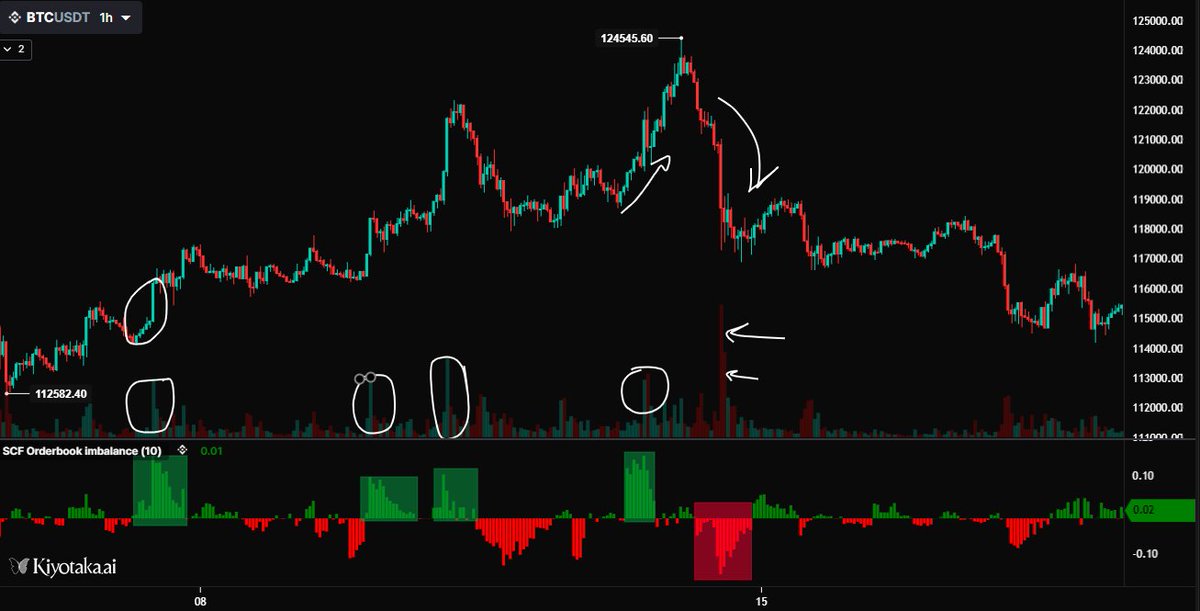
Orderbook Imbalance Indicator highlights buying vs. selling pressure using data from the Orderbook
🔴 Red bars = Sell-side dominance (more asks than bids) → Bearish pressure
🟢 Green bars = Buy-side dominance (more bids than asks) → Bullish pressure
Orderbook Imbalance Indicator highlights buying vs. selling pressure using data from the Orderbook
🔴 Red bars = Sell-side dominance (more asks than bids) → Bearish pressure
🟢 Green bars = Buy-side dominance (more bids than asks) → Bullish pressure
2.1 Orderbook
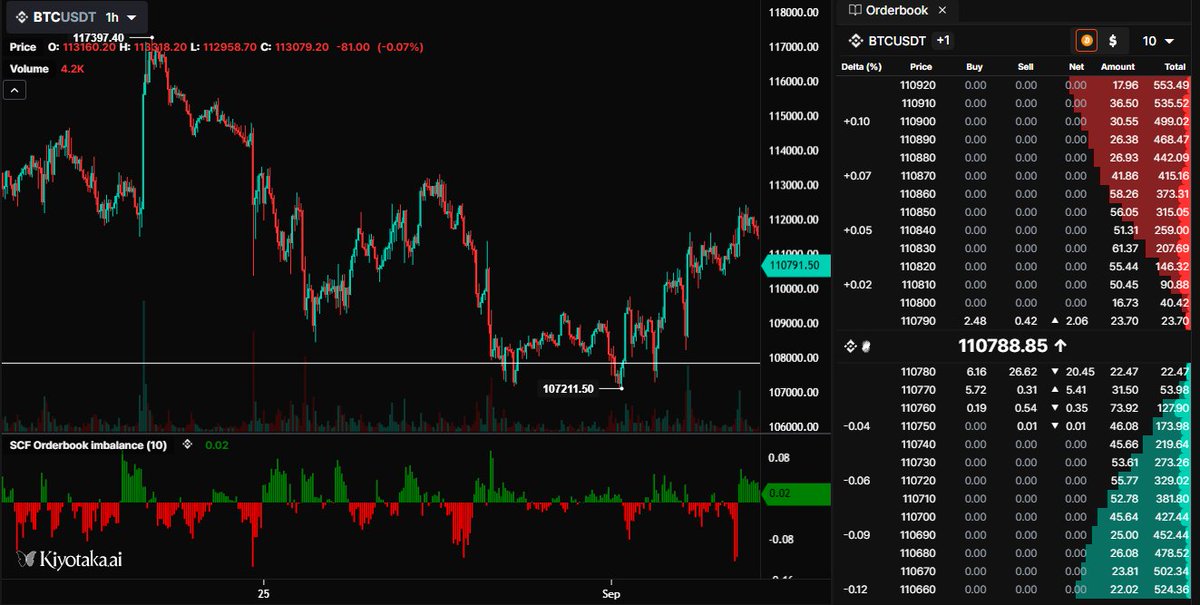
Orderbook Panel:
The Orderbook (right side) shows real-time buy (bids) and sell (asks) liquidity stacked at different price levels
🔴 Red = ask walls (sellers)
🔵 Blue = bid walls (buyers)
Above price = potential resistance
Below price = potential support
Orderbook Panel:
The Orderbook (right side) shows real-time buy (bids) and sell (asks) liquidity stacked at different price levels
🔴 Red = ask walls (sellers)
🔵 Blue = bid walls (buyers)
Above price = potential resistance
Below price = potential support
2.2 Orderbook
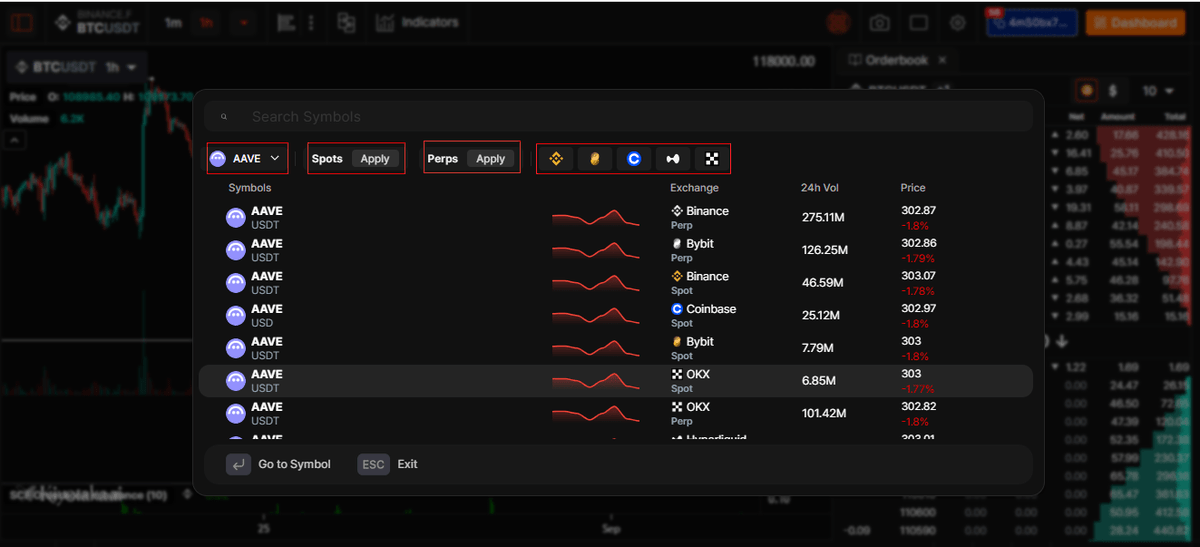
By accessing the Orderbook you will be able to choose the Altcoin you want.
In the Exchanges available in Kiyotaka
You can also choose whether you want to see the Spot or Perps OrderBook
By accessing the Orderbook you will be able to choose the Altcoin you want.
In the Exchanges available in Kiyotaka
You can also choose whether you want to see the Spot or Perps OrderBook
2.3 Orderbook
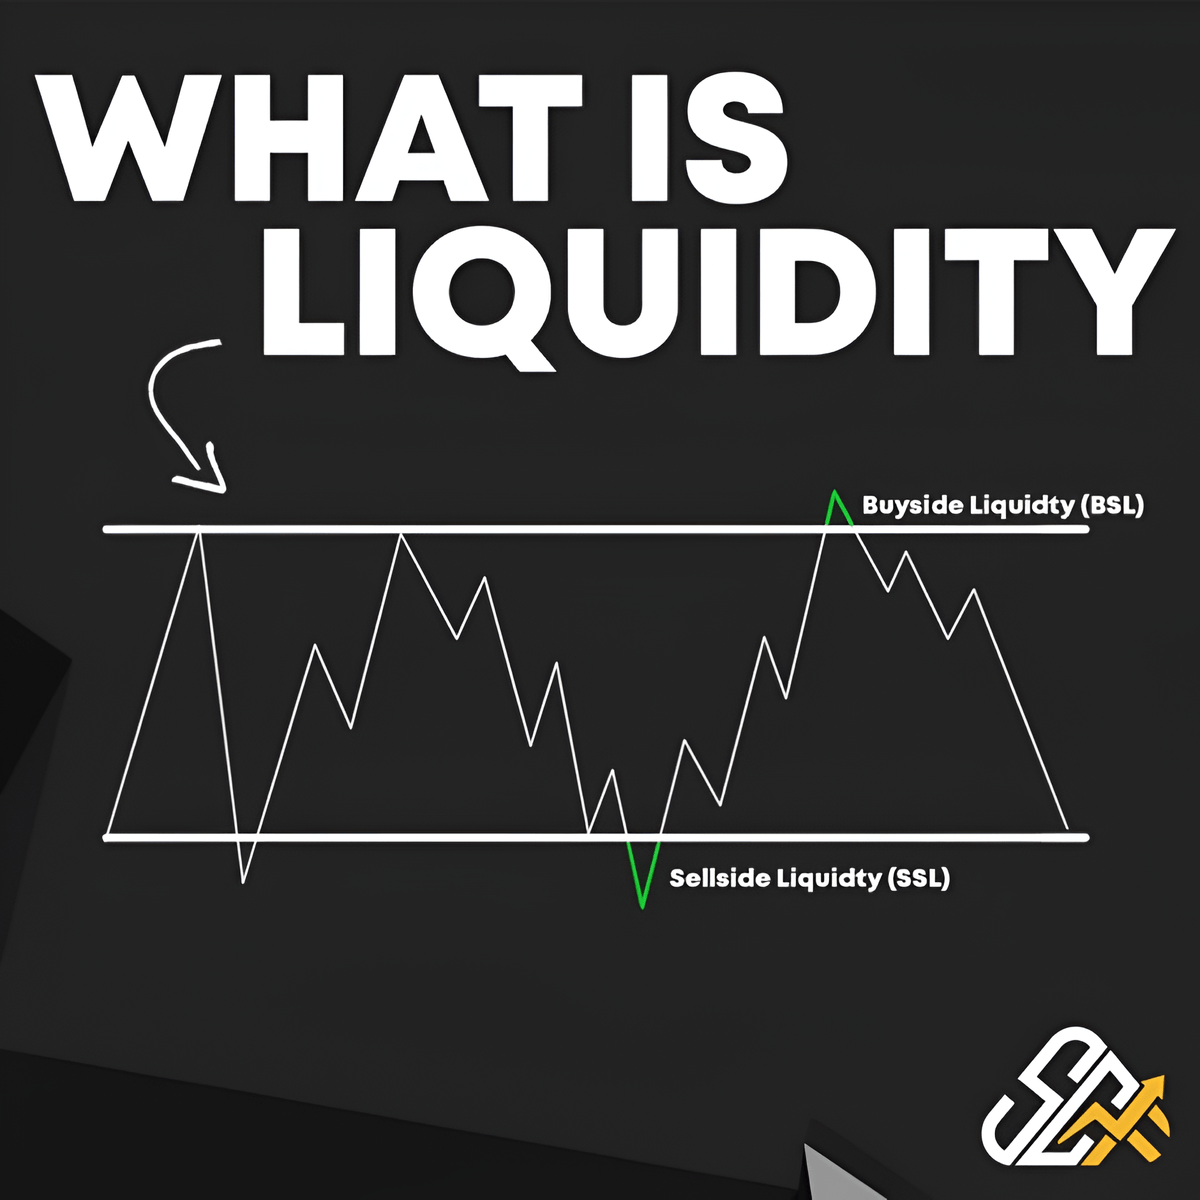
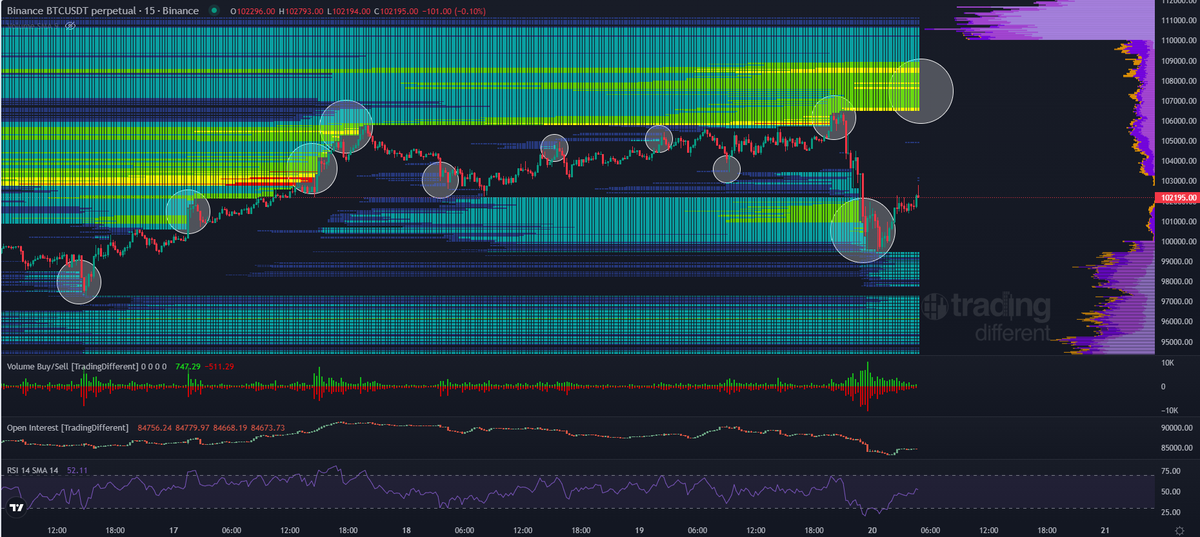
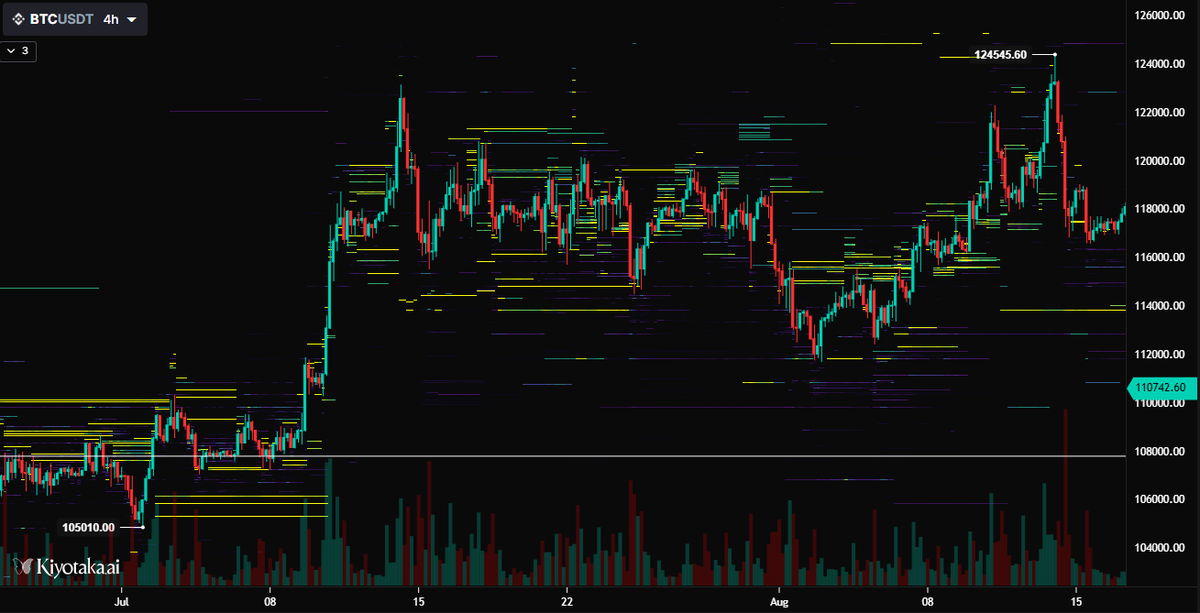
This chart uses an Orderbook Heatmap, which visualizes Liquidity Levels across time:
🔥 Yellow/bright zones = high resting orders (liquidity walls)
🟣 Dark zones = Low liquidity
These zones often act as Support/Resistance
This chart uses an Orderbook Heatmap, which visualizes Liquidity Levels across time:
🔥 Yellow/bright zones = high resting orders (liquidity walls)
🟣 Dark zones = Low liquidity
These zones often act as Support/Resistance
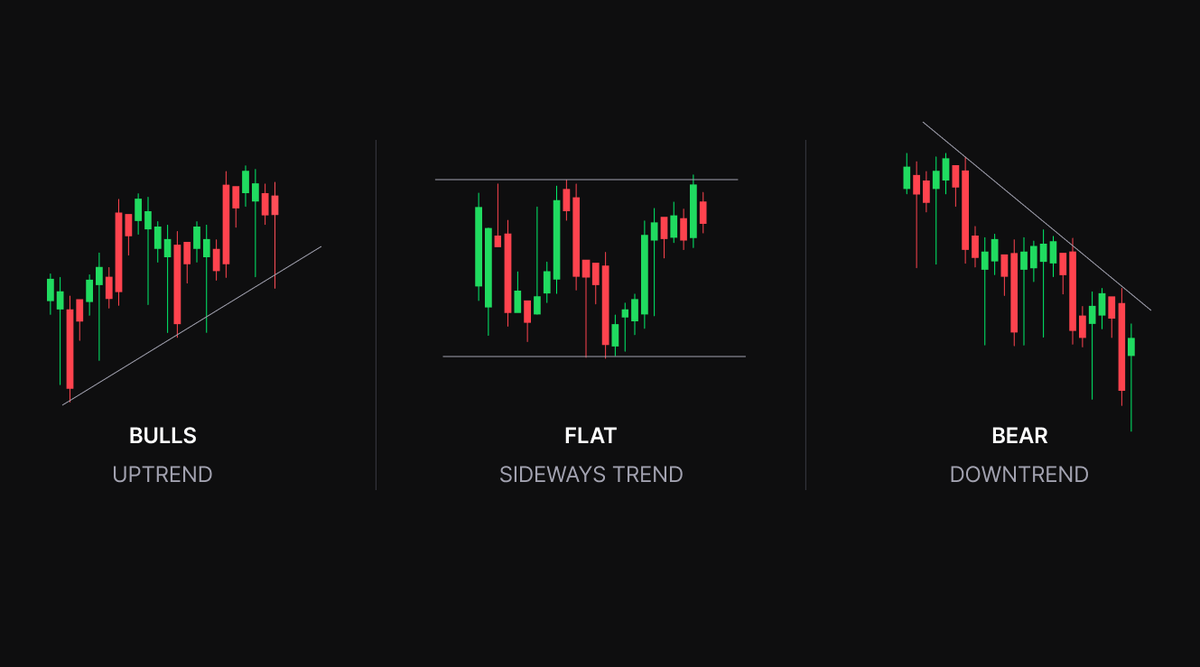
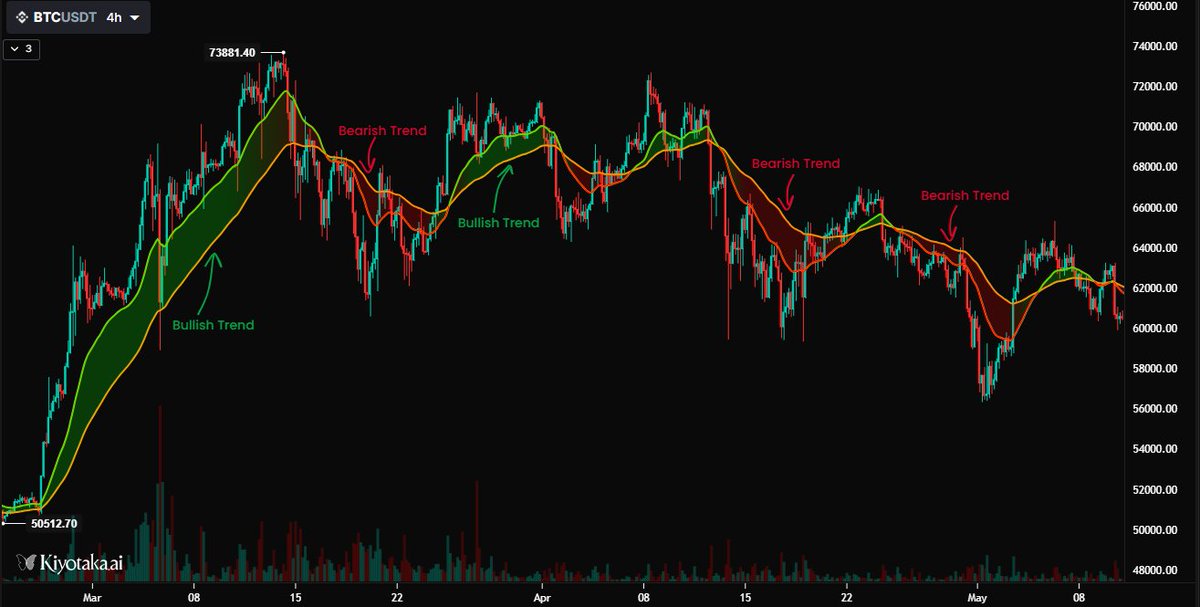
3. Trend Bands
Trend Band Indicator is used to visualize trend direction with moving averages and color shading:
📈 When green appears, it signals upward momentum: Good spot for long setups.
📉 Red shading shows sellers in control: Time to avoid longs and look for shorts.
Trend Band Indicator is used to visualize trend direction with moving averages and color shading:
📈 When green appears, it signals upward momentum: Good spot for long setups.
📉 Red shading shows sellers in control: Time to avoid longs and look for shorts.
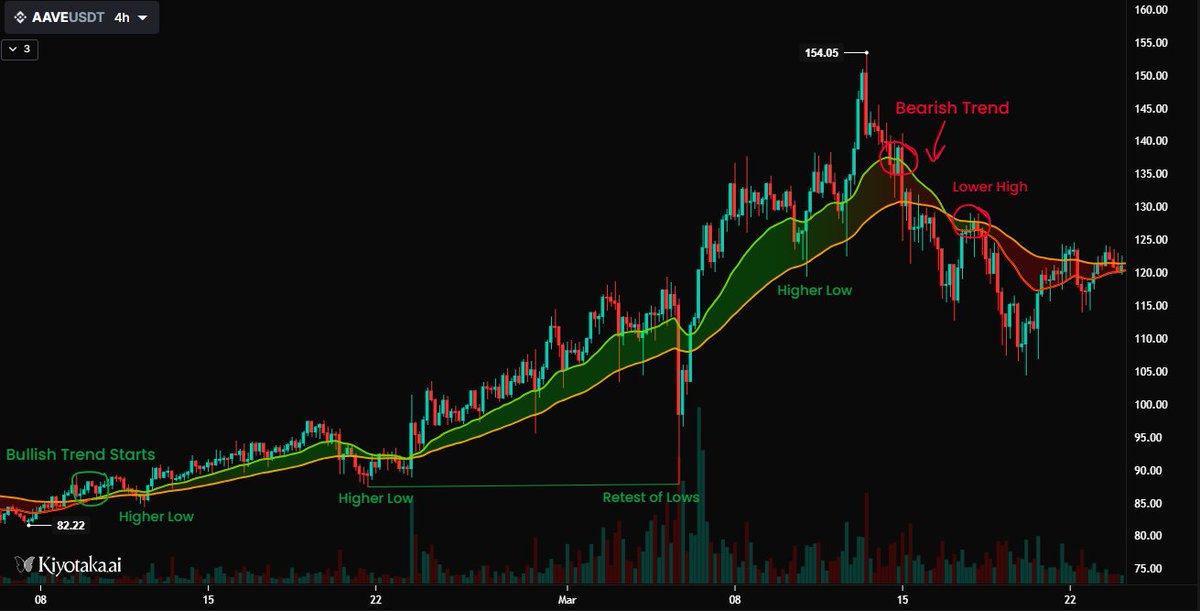
3.1 Trend Bands
The Trend Band turned green, confirming the start of a Bullish trend with successive Higher Lows.
Momentum stayed intact until the band flipped red near the peak.
Signaling a bearish reversal with lower highs forming.
The Trend Band turned green, confirming the start of a Bullish trend with successive Higher Lows.
Momentum stayed intact until the band flipped red near the peak.
Signaling a bearish reversal with lower highs forming.
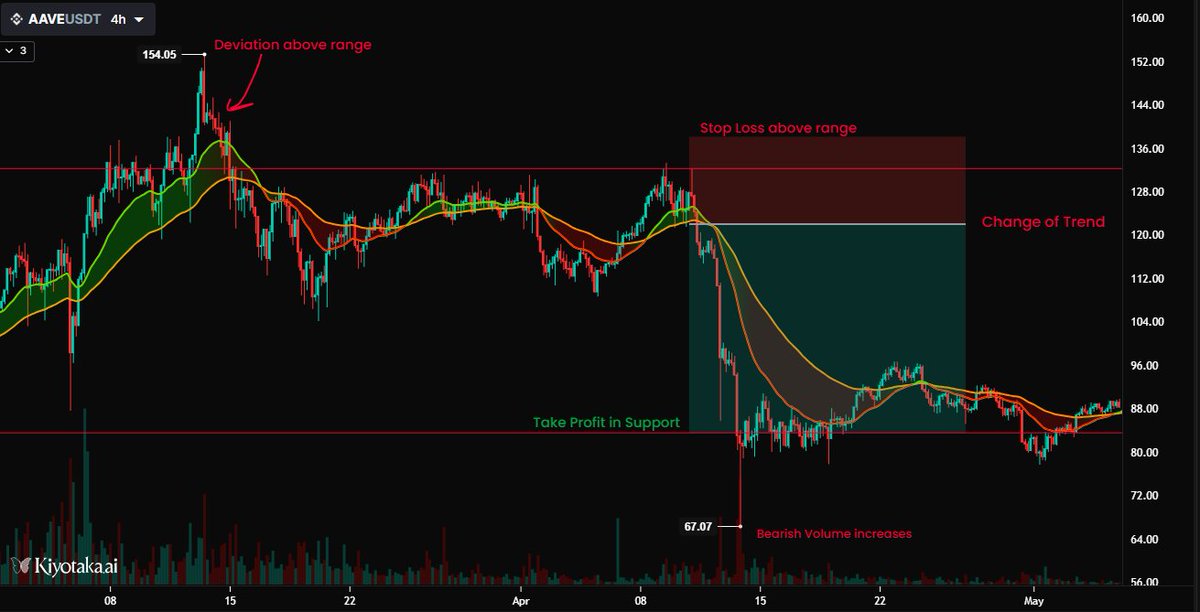
3.2 Trend Bands
Short trade in AAVE
The Trend Band shows a failed breakout with deviation above range.
Followed by a color shift that confirms the change of trend.
The band turns red as bearish volume increases, with stop loss above range and taking profit at support.
Short trade in AAVE
The Trend Band shows a failed breakout with deviation above range.
Followed by a color shift that confirms the change of trend.
The band turns red as bearish volume increases, with stop loss above range and taking profit at support.
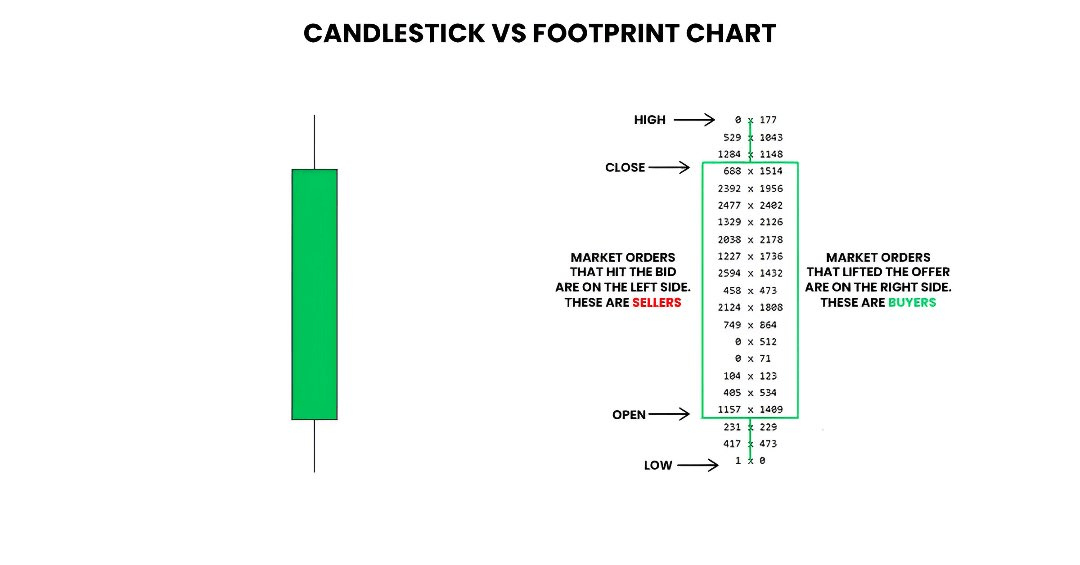
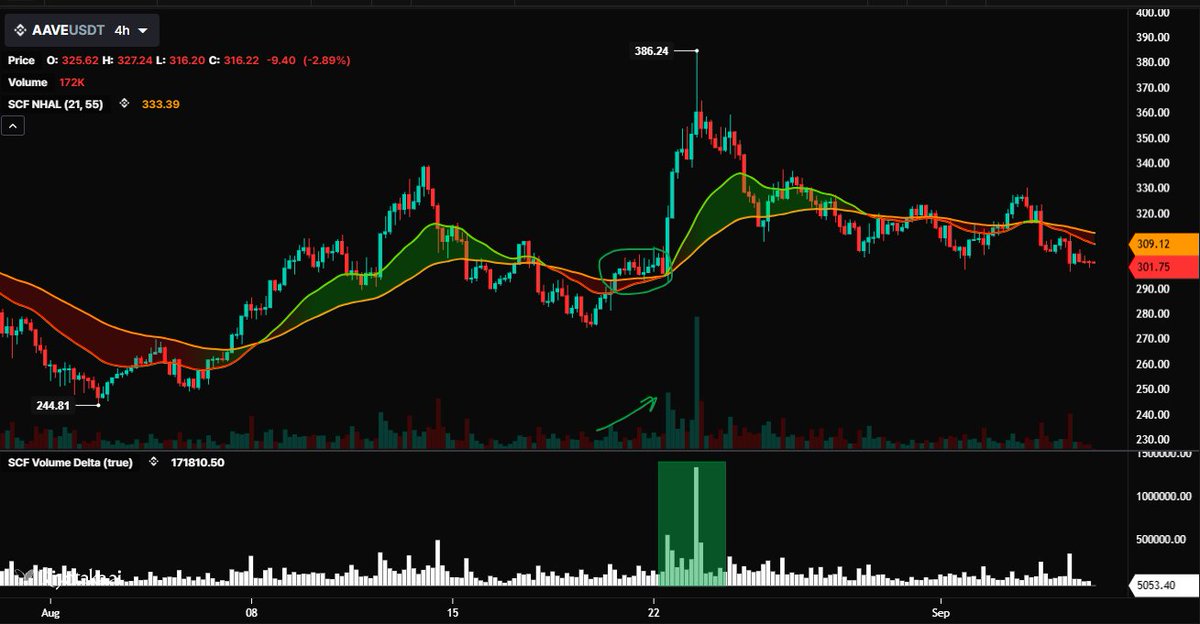
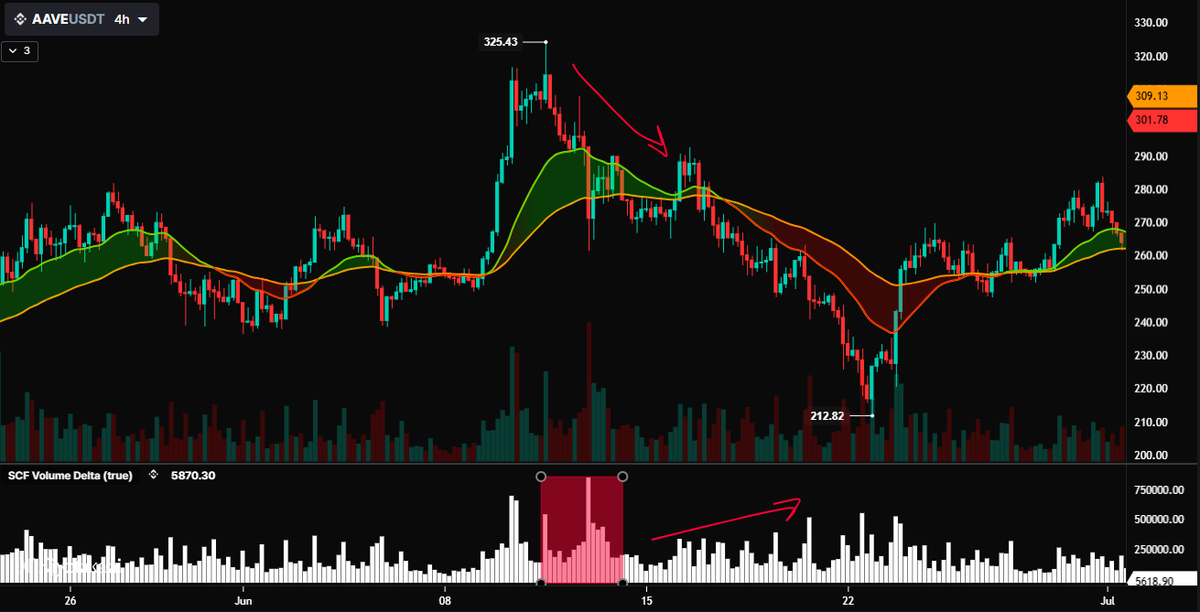
4. Volume Delta
Volume Delta tracks the imbalance between aggressive buyers and sellers.
In this chart, a strong positive delta spike confirmed accumulation before the breakout.
This validates the bullish move and signals real demand behind the price rally.
Volume Delta tracks the imbalance between aggressive buyers and sellers.
In this chart, a strong positive delta spike confirmed accumulation before the breakout.
This validates the bullish move and signals real demand behind the price rally.
4.1 Volume Delta
Bearish volume delta shows big negative delta bars at the peak while volume climbs.
Meaning aggressive sellers outnumbered buyers.
Price failed to hold highs and the Trend indicator rolled over
Bearish volume delta shows big negative delta bars at the peak while volume climbs.
Meaning aggressive sellers outnumbered buyers.
Price failed to hold highs and the Trend indicator rolled over
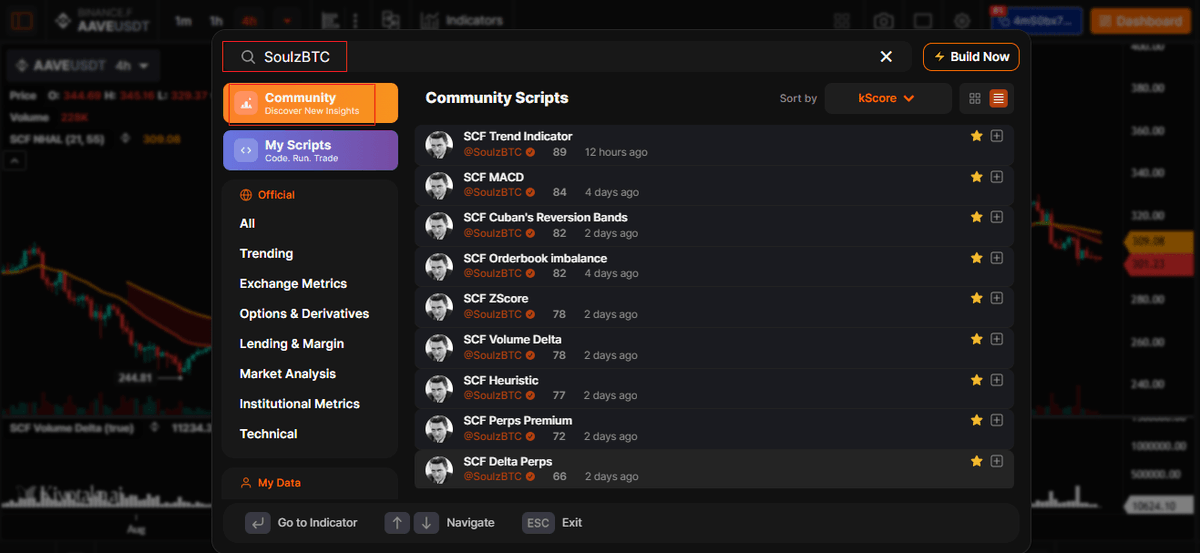
This Thread has been a brief explanation of the indicators I created.
To access them, register here:
I will publish a complete and free PDF today on how to use these indicators. kiyotaka.ai/ref=4mS0bx7xQg
To access them, register here:
I will publish a complete and free PDF today on how to use these indicators. kiyotaka.ai/ref=4mS0bx7xQg
• • •
Missing some Tweet in this thread? You can try to
force a refresh