It's worse than you think:
After a SECOND data revision, the US went from "adding" 147,000 jobs in June 2025, to LOSING -13,000 jobs.
Cumulative payrolls have now officially been revised down by -1.1 MILLION jobs since February 2022.
What is happening here?
(a thread)
After a SECOND data revision, the US went from "adding" 147,000 jobs in June 2025, to LOSING -13,000 jobs.
Cumulative payrolls have now officially been revised down by -1.1 MILLION jobs since February 2022.
What is happening here?
(a thread)

This is completely broken.
If you take a look at NET revisions just for 2025, the US has seen -482,000 jobs revised out of the initially reported data.
This is roughly equivalent to the entire population of Atlanta, GA.
All revised out of just 2025's data year-to-date.
If you take a look at NET revisions just for 2025, the US has seen -482,000 jobs revised out of the initially reported data.
This is roughly equivalent to the entire population of Atlanta, GA.
All revised out of just 2025's data year-to-date.

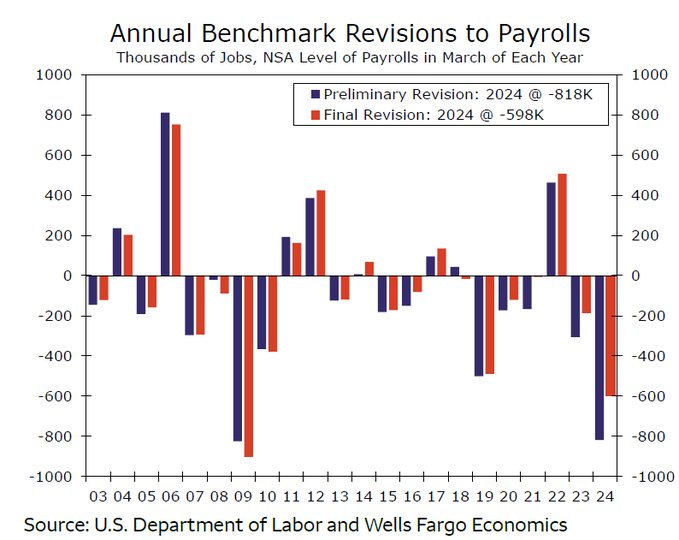
In August 2024, this issue began gaining some publicity.
This was when the BLS revised 12-month job growth down by a massive -818,000 jobs.
It marked the largest downward revision since 2008 in an economy where the Fed was calling for a "soft landing."
It's getting worse.
This was when the BLS revised 12-month job growth down by a massive -818,000 jobs.
It marked the largest downward revision since 2008 in an economy where the Fed was calling for a "soft landing."
It's getting worse.

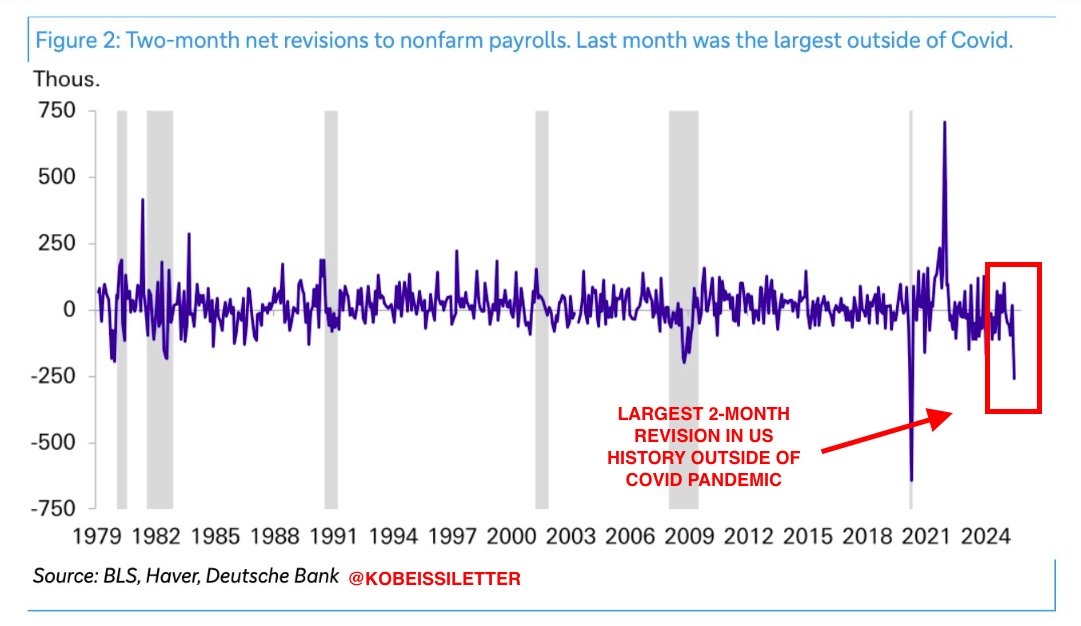
Last month, the US revised -258,000 jobs out of the June and May jobs report.
If you factor in the revisions from yesterday, June fell by another -27,000 jobs, for a total of -285,000.
This now marks the LARGEST negative 2-month net revision in US history, outside of 2020.
If you factor in the revisions from yesterday, June fell by another -27,000 jobs, for a total of -285,000.
This now marks the LARGEST negative 2-month net revision in US history, outside of 2020.
In exactly 3 days, we will receive this data for the 12-months ending March 2025.
Estimates range from -500,000 to up to -950,000 jobs set to be revised OUT of reported data.
If Goldman Sachs' top end estimate of -950,000 revisions occurs, it would be the largest since 2010.
Estimates range from -500,000 to up to -950,000 jobs set to be revised OUT of reported data.
If Goldman Sachs' top end estimate of -950,000 revisions occurs, it would be the largest since 2010.
The even bigger issue is that confidence in economic data has been lost.
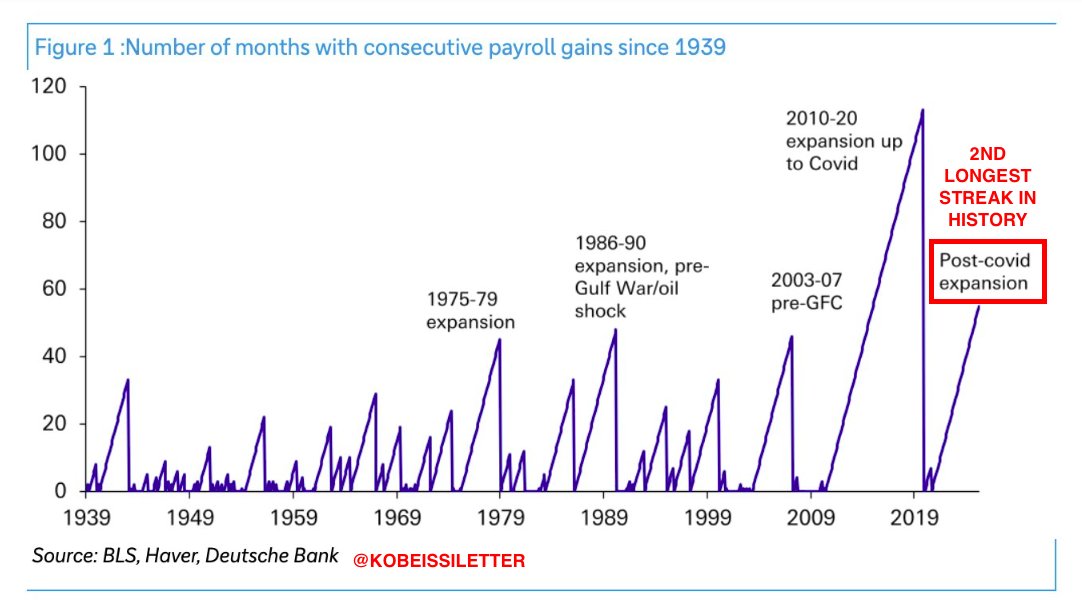
The post-COVID expansion period saw 60+ months of consecutive payroll gains, the 2nd longest streak in history.
After June's double-revision, this streak has ENDED.
But, is the data even accurate?
The post-COVID expansion period saw 60+ months of consecutive payroll gains, the 2nd longest streak in history.
After June's double-revision, this streak has ENDED.
But, is the data even accurate?
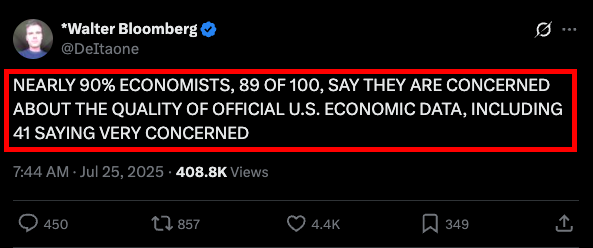
In July 2025, a poll was conducted regarding the reliability of US economic data.
89% of economists that were polled agreed that the reliability of this data is a "big problem."
In fact, we no longer base our analysis on initially reported jobs data.
We wait for revisions.
89% of economists that were polled agreed that the reliability of this data is a "big problem."
In fact, we no longer base our analysis on initially reported jobs data.
We wait for revisions.
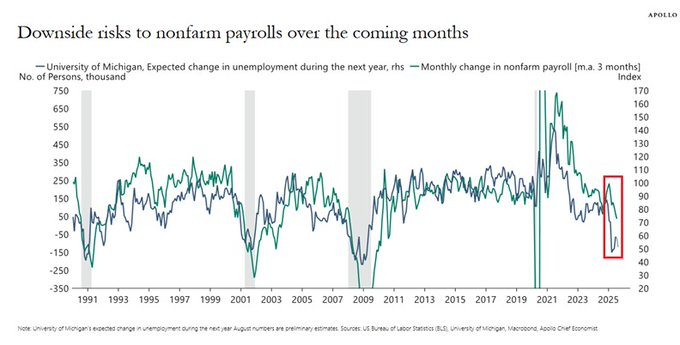
In August, 63% of consumers expected higher unemployment over the next 12 months, the third-highest reading since 2008.
This has been a leading indicator for the job market.
This suggests the 3-month average of payrolls could fall to -50,000 to -100,000 in the coming months.
This has been a leading indicator for the job market.
This suggests the 3-month average of payrolls could fall to -50,000 to -100,000 in the coming months.
We are in the midst of another major shift in the macroeconomy.
The implications of these shifts on stocks, commodities, bonds, and crypto are investable.
Want to see how we are doing it?
Subscribe to access our premium analysis below:
thekobeissiletter.com/subscribe
The implications of these shifts on stocks, commodities, bonds, and crypto are investable.
Want to see how we are doing it?
Subscribe to access our premium analysis below:
thekobeissiletter.com/subscribe
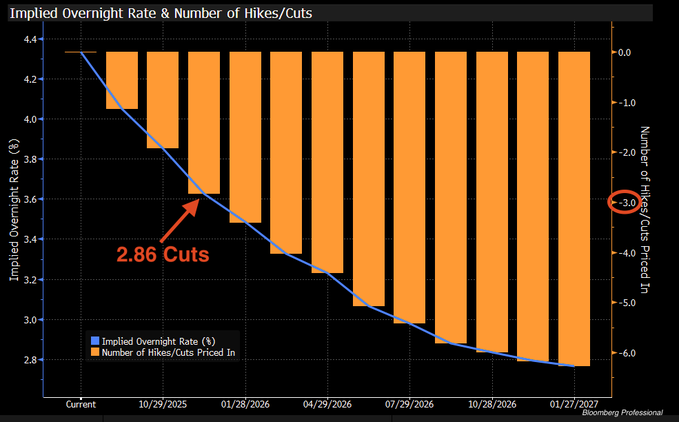
The reality of these massive downward revisions is they have put the Fed behind the 8-ball.
The Fed will play catch-up again, with markets pricing in 3 cuts by year-end.
Rate cuts are coming into inflation.
Follow us @KobeissiLetter for real time analysis as this develops.
The Fed will play catch-up again, with markets pricing in 3 cuts by year-end.
Rate cuts are coming into inflation.
Follow us @KobeissiLetter for real time analysis as this develops.
• • •
Missing some Tweet in this thread? You can try to
force a refresh