#DuringCOVID is today.
Image pack 1 of 9 🧵
Image pack 1 of 9 🧵

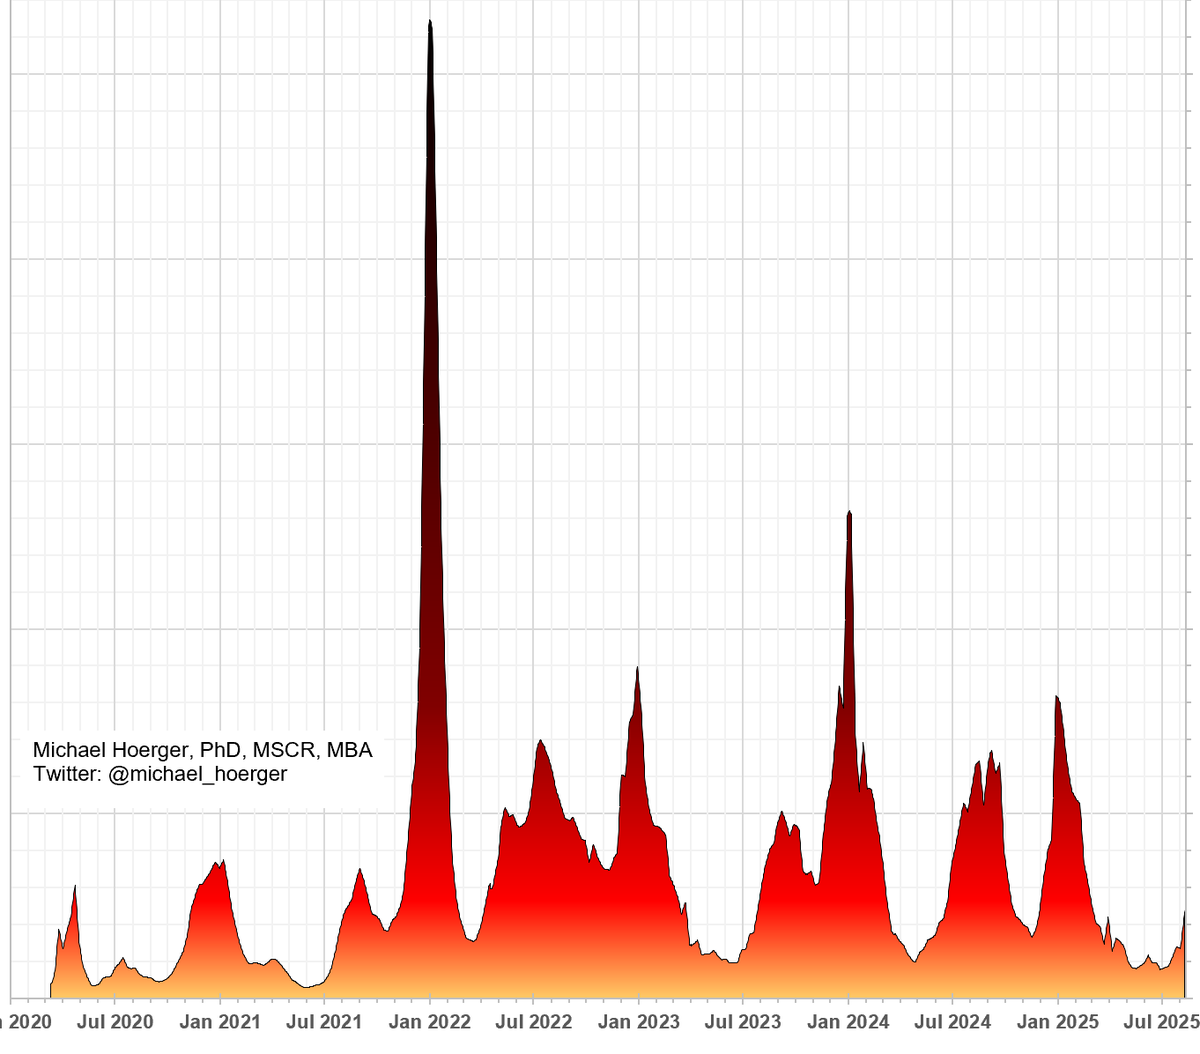
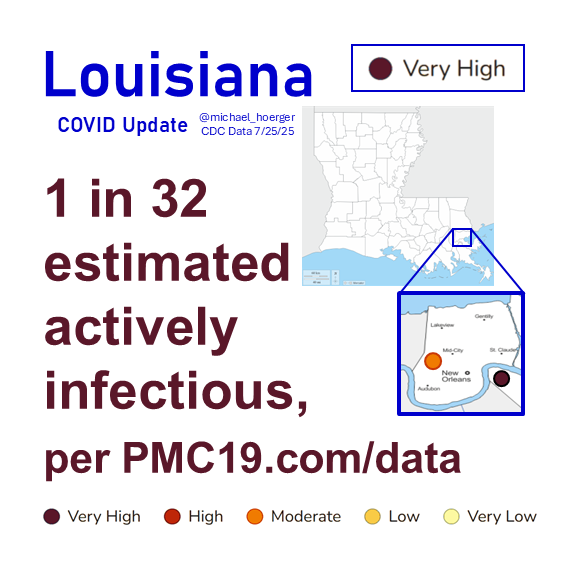
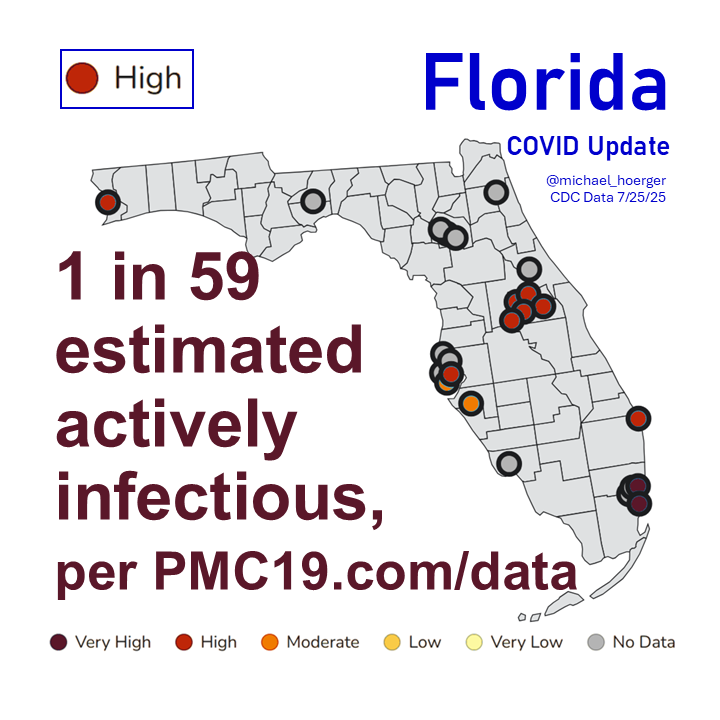
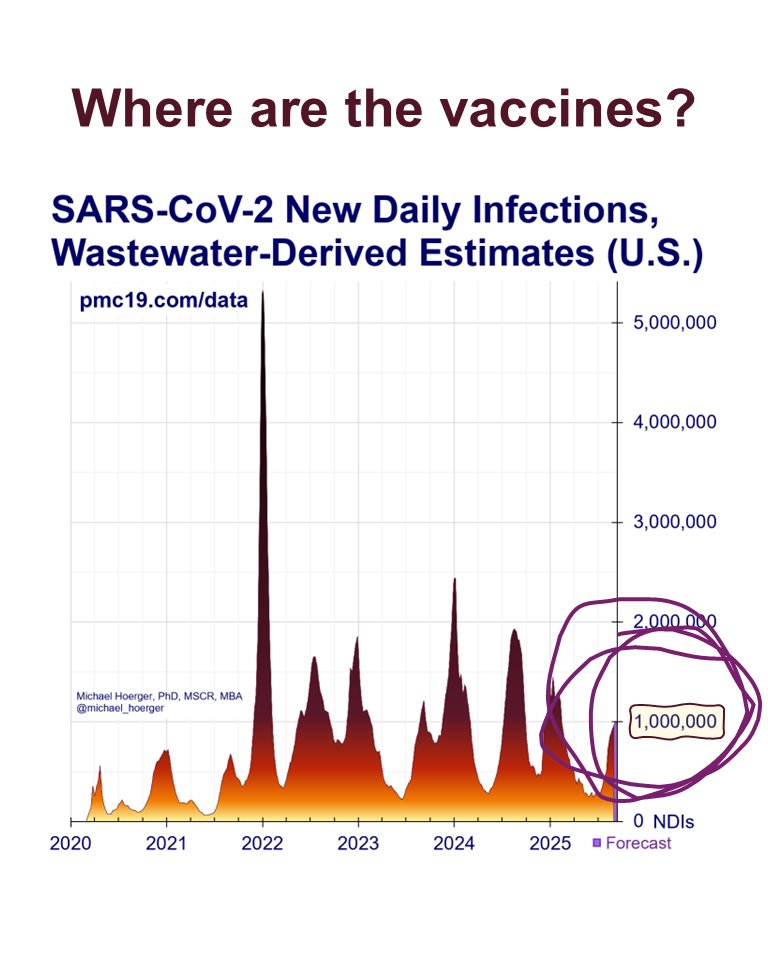
1 million New Daily Infections.
Today!
Image pack 2 of 9 🧵
Today!
Image pack 2 of 9 🧵

Where are the free vaccines, N95s, and tests?
Image pack 3 of 9 🧵
Image pack 3 of 9 🧵

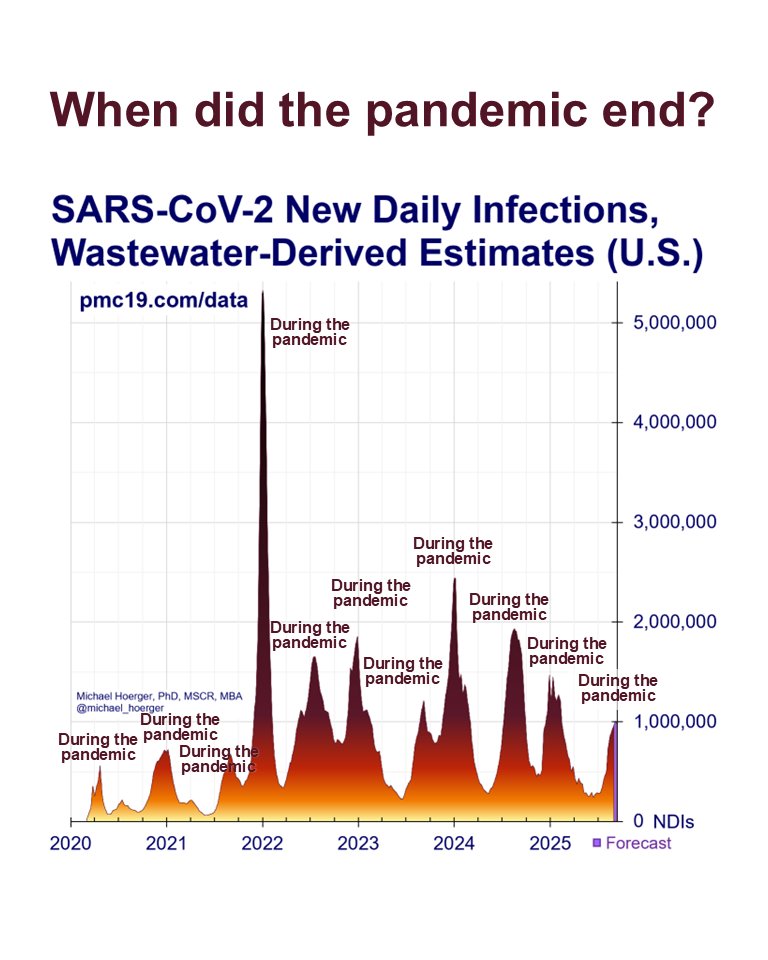
When did the pandemic end?
Next time someone says, "during the pandemic," simply note the ongoing transmission & ask, "When did the pandemic end?" They usually cannot respond.
#DuringThePandemic
Image pack 4 of 9 🧵
Next time someone says, "during the pandemic," simply note the ongoing transmission & ask, "When did the pandemic end?" They usually cannot respond.
#DuringThePandemic
Image pack 4 of 9 🧵
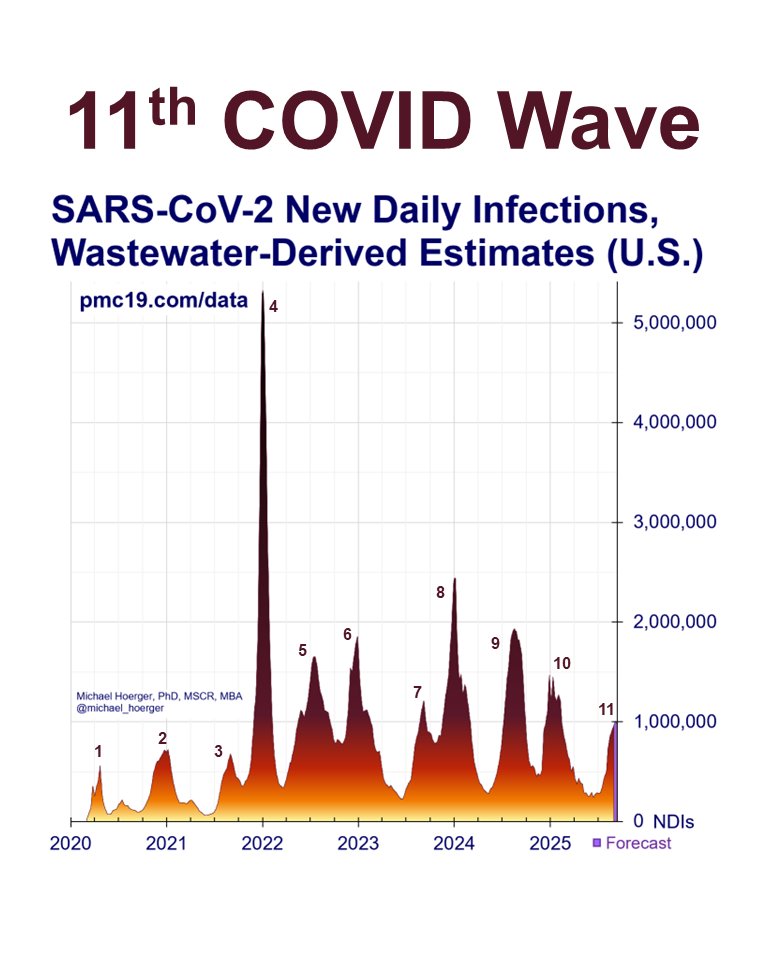
11th COVID Wave
Image pack 5 of 9 🧵
Image pack 5 of 9 🧵
Where are the vaccines?
Image pack 6 of 9 🧵
Image pack 6 of 9 🧵
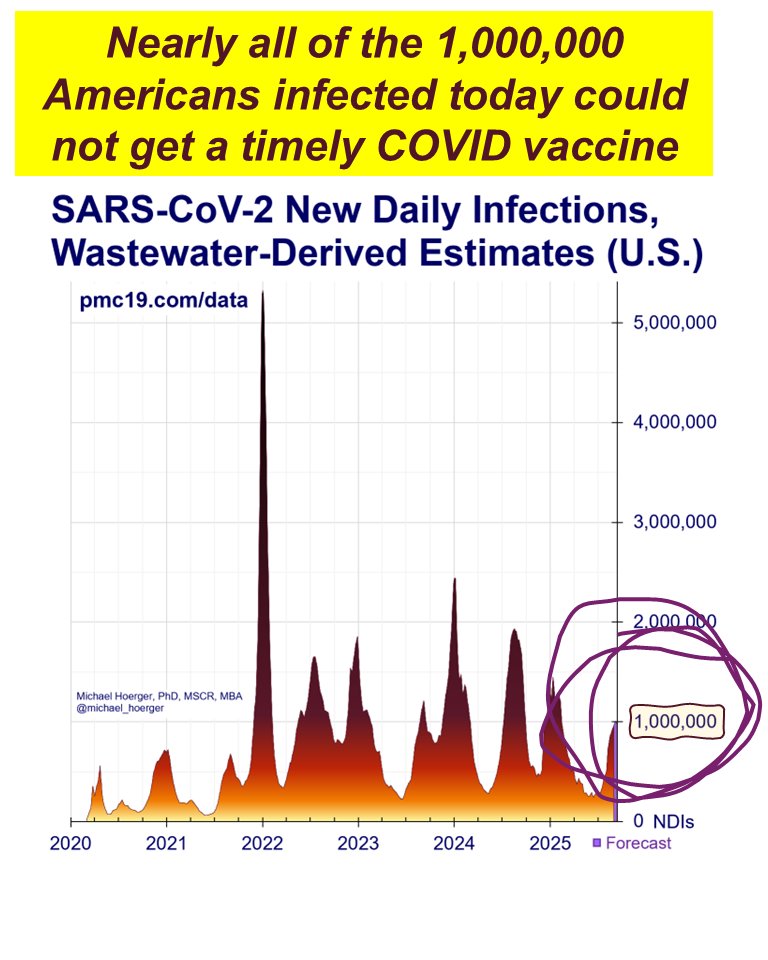
Nearly all of the 1,000,000 Americans infected today could not get a timely COVID vaccine.
In the U.S., the current booster is being rolled out months late, barriers to eligibility, access, and payment, no effective strategy.
Image pack 7 of 9 🧵
In the U.S., the current booster is being rolled out months late, barriers to eligibility, access, and payment, no effective strategy.
Image pack 7 of 9 🧵
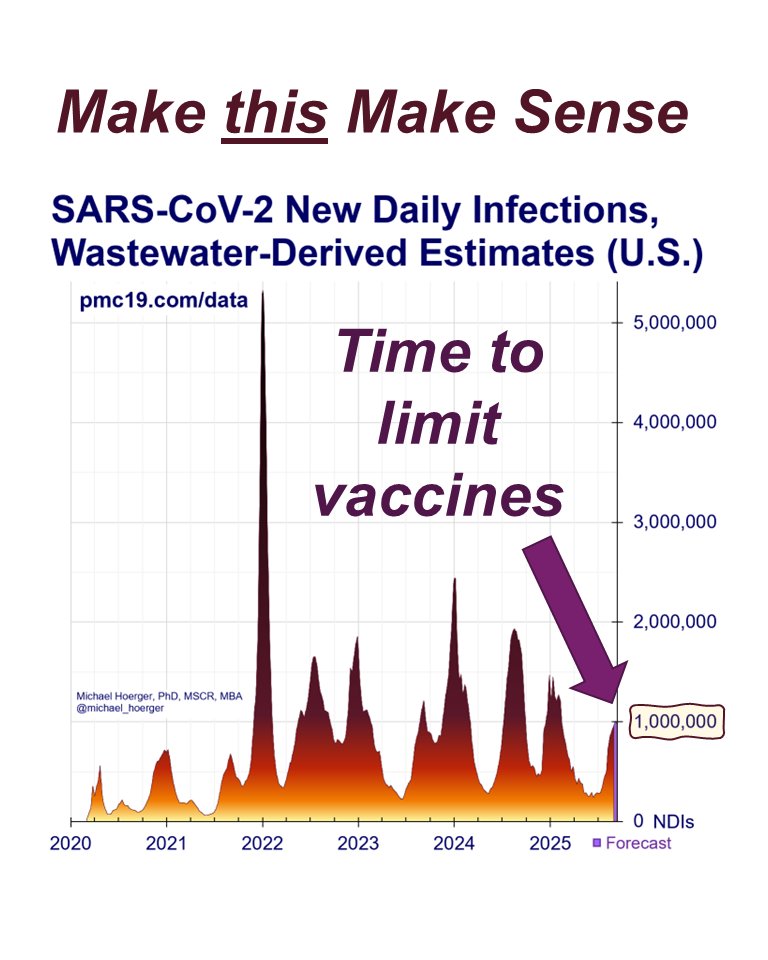
Make this make sense. Vaccines are being limited as infections soar.
Image pack 8 of 9 🧵
Image pack 8 of 9 🧵
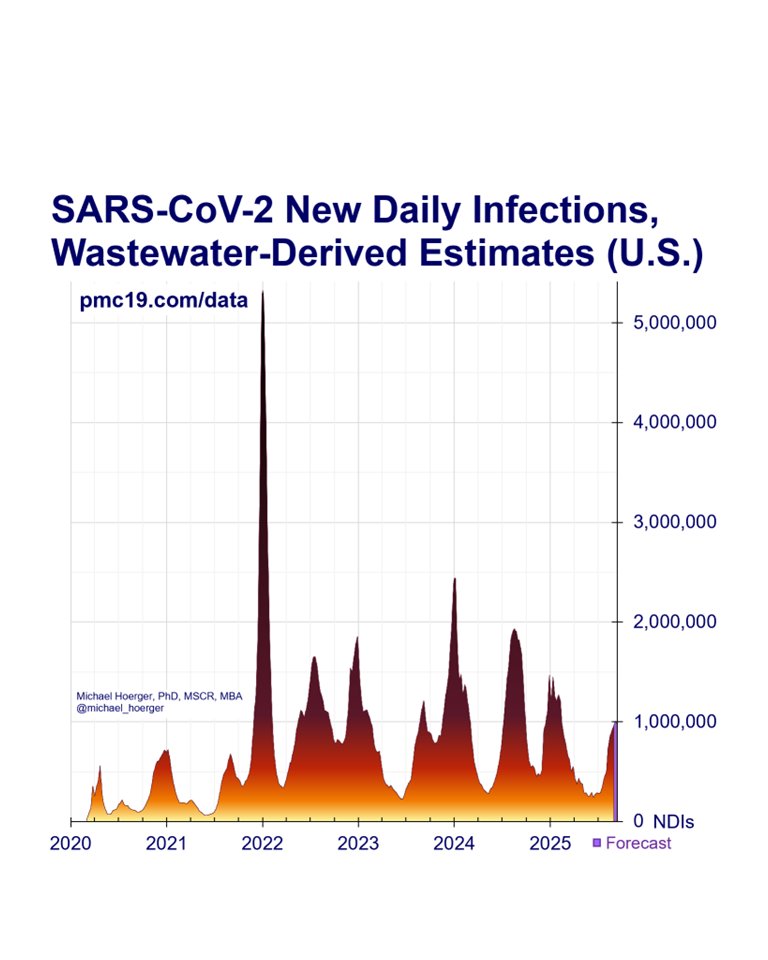
This is a graph of the 11 waves of the pandemic, noting an estimated 1 million new daily infections.
It's free of markup. Feel free to use as a template to edit over.
Image pack 9 of 9 🧵
It's free of markup. Feel free to use as a template to edit over.
Image pack 9 of 9 🧵
• • •
Missing some Tweet in this thread? You can try to
force a refresh