Emil Kirkegaard Profile picture
Sep 7 7 tweets 2 min read Read on X
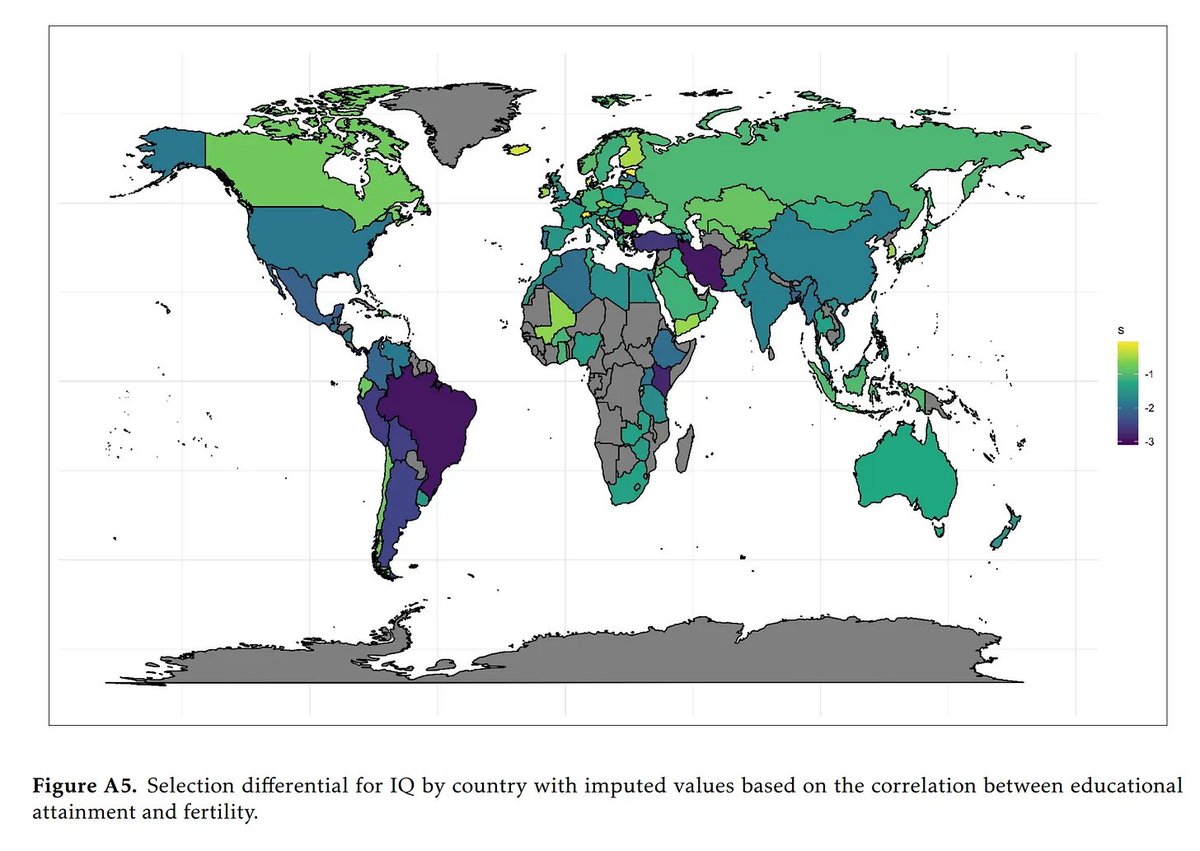
Using data from across the world, we estimated the speed of selection against intelligence across countries. Image
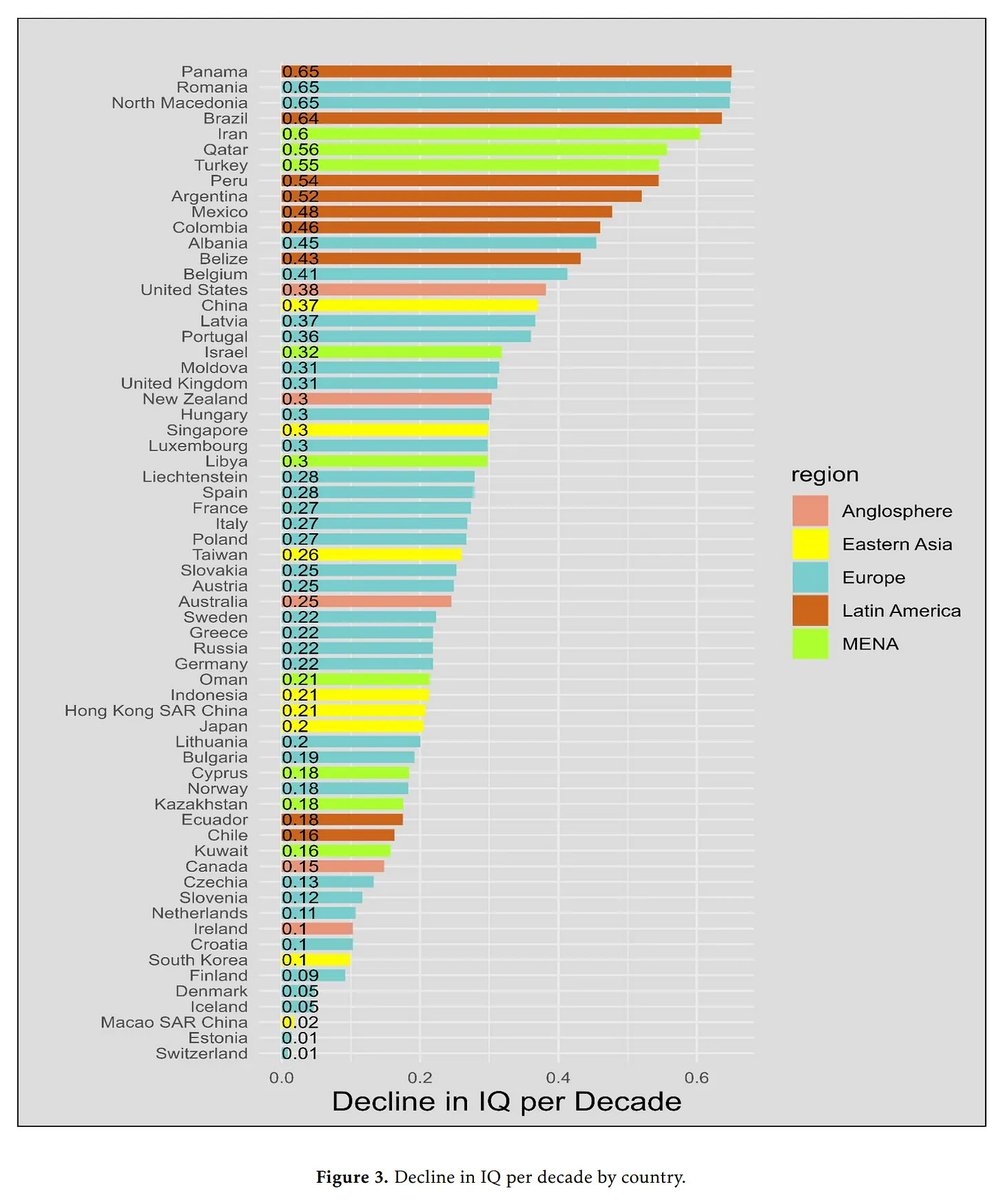
There is a certain regionality to the data Image
Relatively atheistic north Europeans have apparently quite weak selection, while more religious areas have stronger negative selection. This is the opposite of what American data suggested when studying individuals. Image
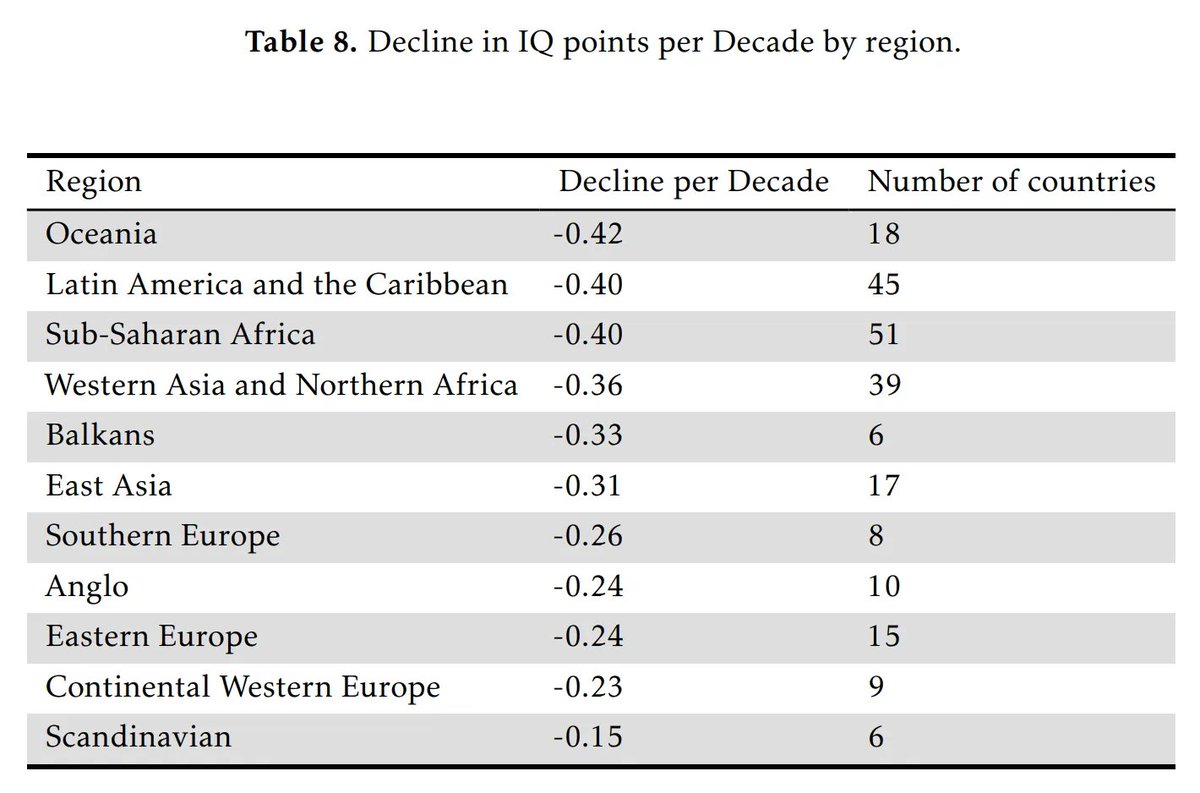
This also means that there is a Matthew effect such that countries with currently high IQs are declining slower due to internal dysgenics than those who are less fortunate. The same pattern holds for country-level development. Image
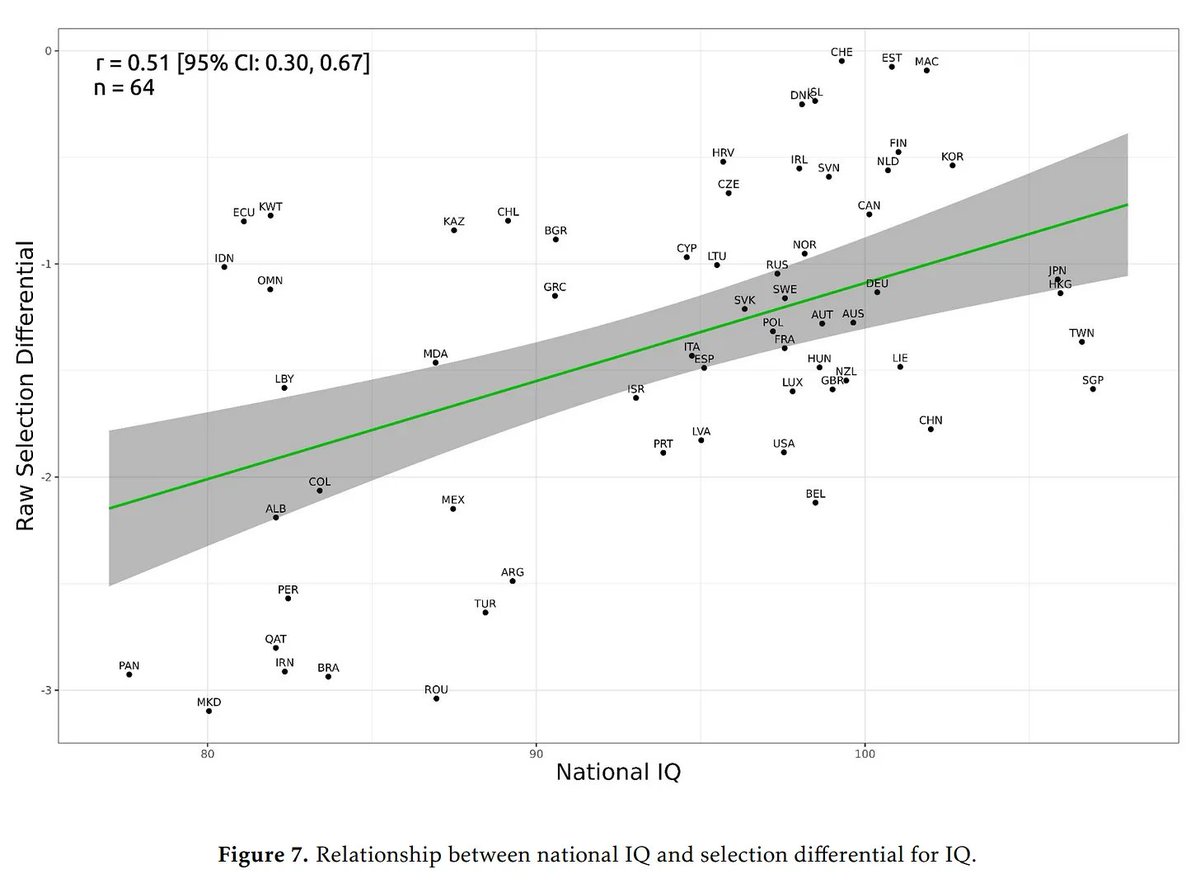
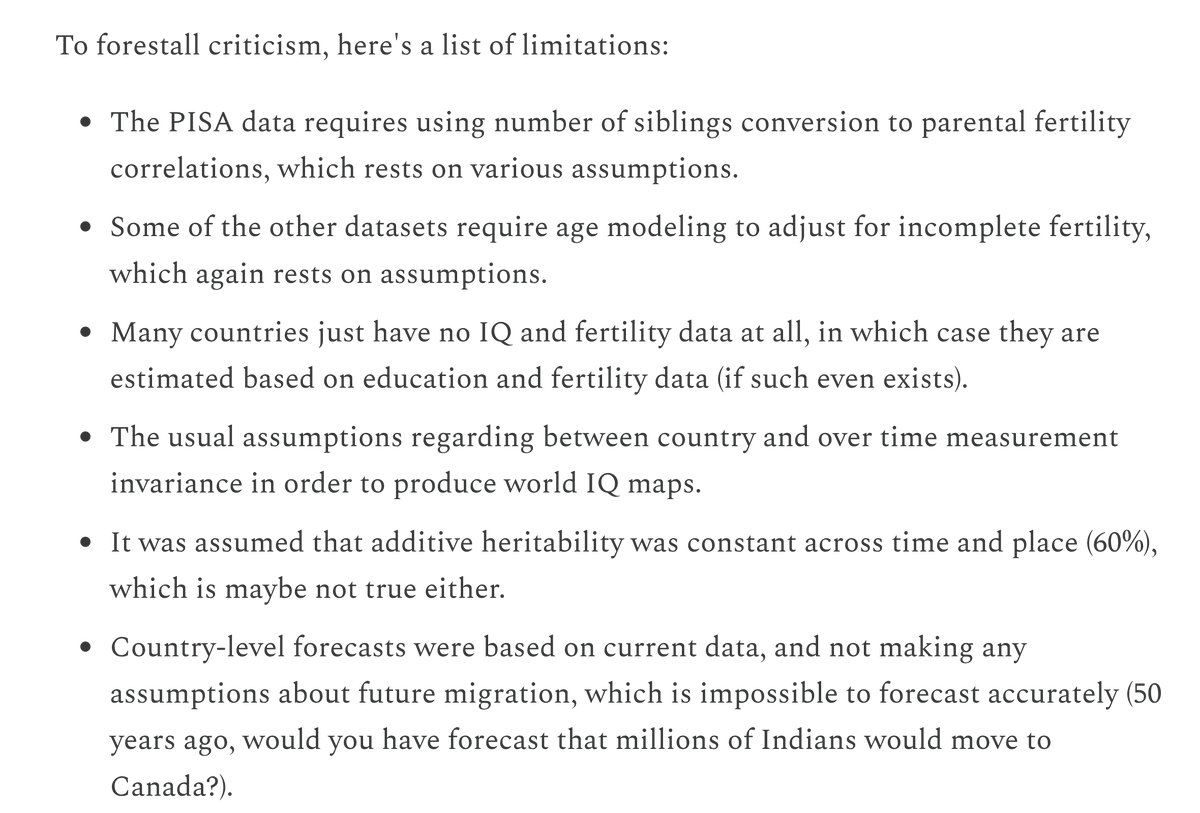
The usual limitations apply. Image
Who has how much dysgenics?

emilkirkegaard.com/p/who-has-how-…
Most credit goes to @jensenjeans

• • •

Missing some Tweet in this thread? You can try to force a refresh
 

Keep Current with Emil Kirkegaard

Emil Kirkegaard Profile picture

Stay in touch and get notified when new unrolls are available from this author!

Read all threads

This Thread may be Removed Anytime!

PDF

Twitter may remove this content at anytime! Save it as PDF for later use!

Try unrolling a thread yourself!

how to unroll video
  1. Follow @ThreadReaderApp to mention us!

  2. From a Twitter thread mention us with a keyword "unroll"
@threadreaderapp unroll

Practice here first or read more on our help page!

More from @KirkegaardEmil

Aug 23
Some big accounts as asking why so many MAGA types are suddenly so very anti-Indian, considering that Indians in the US and to some degree in the rest of the West, are model immigrants (high performance, low crime). The main answer is not difficult to understand. Image
Image
Image
Image
This answer is based on the typical finding of sociology. In terms of partisanship, whichever groups in society you dislike is just the ones you perceive to be most different from you politically. Brandt and colleagues worked this out in 2014. Image
On top of this general pattern, there's the fact that importing a bunch of foreign workers depress local salaries. That is of course why the companies do this. What's the largest source of such foreigners? India. So capitalists love them (cheaper labor) and workers dislike them (suppress their wages).Image
Read 5 tweets
Aug 16
Maybe you've seen a map like this one. It gives one the impression that Europeans were uniquely or particularly evil regarding slavery, in this case of Africans. Image
However, slavery was more or less a human universal. Pre-Columbian Americas, ancient China, or the Islamic world. Image
Image
Image
Europeans, rather than being the master enslavers (which they were also for a time), were rather the liberators. The only group of people who decided to take matters into their hands to free the slaves of the world.

reddit.com/r/MapPorn/comm…Image
Read 5 tweets
Jun 29
Lewis Terman thought that the average American would be a believer in egalitarianism regarding sexes, races etc., and that was in 1922. Image
"Once dull, always dull". Special education classes have very good metrics for teacher education and students per teacher, but they don't seem to improve much from this extra effort. So Terman infers from this that these factors cannot be of great importance. Image
Read 6 tweets
Jun 28
New study of 2700 Indian whole genomes shows that Indo-European/Yamnaya/Steppe is quite low, about 15%. It is a bit higher in the north (almost 20%) and among those who speak IE languages, but not impressively so. Too much mixing since the arrival. Image
Inbreeding is strong. The median person had identical blocks in their genome at the level suggesting their parents were 3rd cousins, whereas the human average is about close to 4th cousins (Africans less). Image
Annoyingly, the data is not public, even though American taxpayers paid for this. Can't wait for Trump admin to maybe do something about this abuse (inb4 fell for it again award). Image
Read 4 tweets
May 25
Not everybody commit scientific fraud at the same rate. Let's look at some data. First retraction rates. Image
We can also look at the top list of most fraudulent researchers ever (so far those that were caught). Note: data from 2019 list. There's quite a few non-Europeans. Image
This is important because we want a per capita measure of sorts. For highly regarded journals, European built countries produced about 75% of science (Nature Index), but maybe 30% of top fraudsters. Image
Read 12 tweets
May 15
You have maybe seen this plot. It shows ratings of races in USA by race. The key result is that each race favors their own, except for Whites who are apparently race-blind. Image
Since it only covered a single year, 2020, I wondered if this would replicate across years of data. So I downloaded the data for 1964-2024.

So we see that the result replicated (I didn't use survey weights). And indeed, in 2020 and 2024, Whites have about zero ethnocentrism. Image
But this pattern among Whites is more complex. Here are the ratings by political ideology (self-rated 1-7 scale). The below average attitude towards fellow Whites is concentrated on the left, just as @ZachG932 found before. Especially the far left. Image
Image
Read 7 tweets

Did Thread Reader help you today?

Support us! We are indie developers!


This site is made by just two indie developers on a laptop doing marketing, support and development! Read more about the story.

Become a Premium Member ($3/month or $30/year) and get exclusive features!

Become Premium

Don't want to be a Premium member but still want to support us?

Make a small donation by buying us coffee ($5) or help with server cost ($10)

Donate via Paypal

Or Donate anonymously using crypto!

Ethereum

0xfe58350B80634f60Fa6Dc149a72b4DFbc17D341E copy

Bitcoin

3ATGMxNzCUFzxpMCHL5sWSt4DVtS8UqXpi copy

Thank you for your support!

Follow Us!

:(