The latest HaMMR has dropped: "Weirdonomics."
Last week brought us updates on the labor market and broader economic trends.
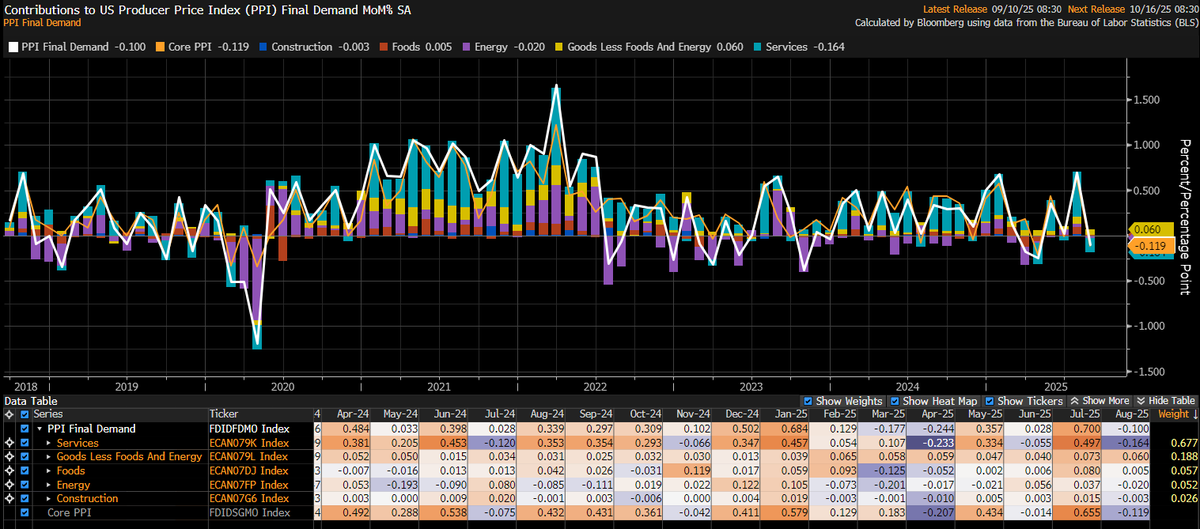
This week's big news will be the last CPI report ahead of next week's Sept. FOMC decision.
Some quick thoughts on the latest developments and a link to this week's report in the 🧵
Last week brought us updates on the labor market and broader economic trends.
This week's big news will be the last CPI report ahead of next week's Sept. FOMC decision.
Some quick thoughts on the latest developments and a link to this week's report in the 🧵
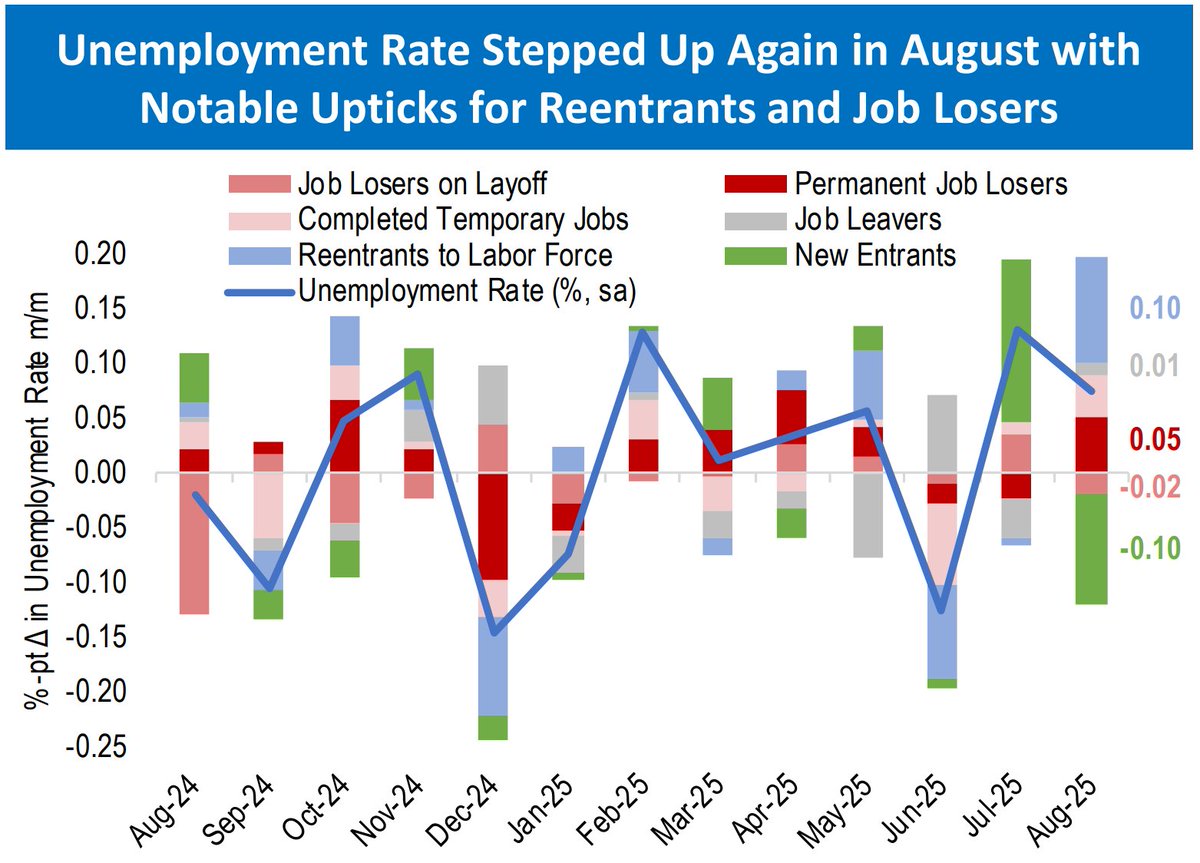
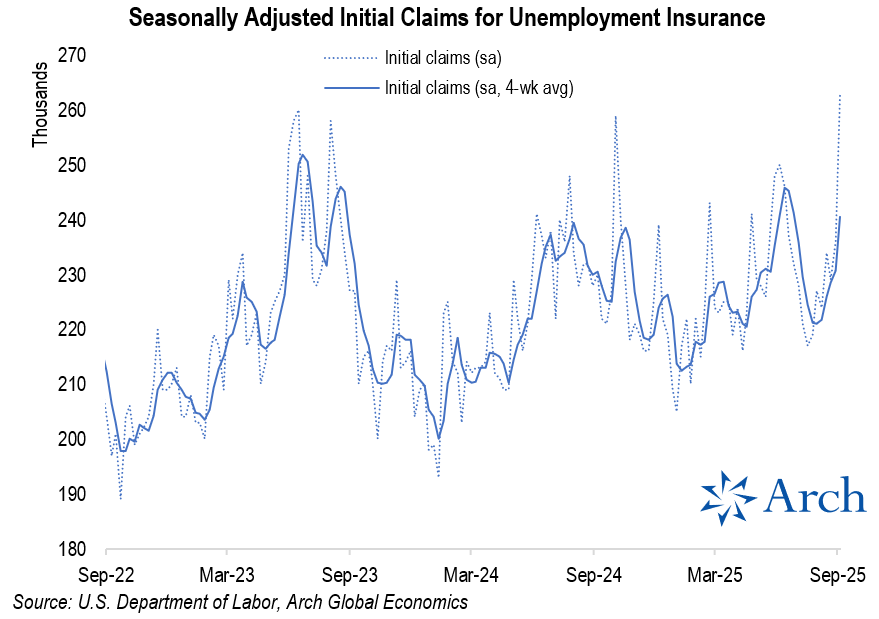
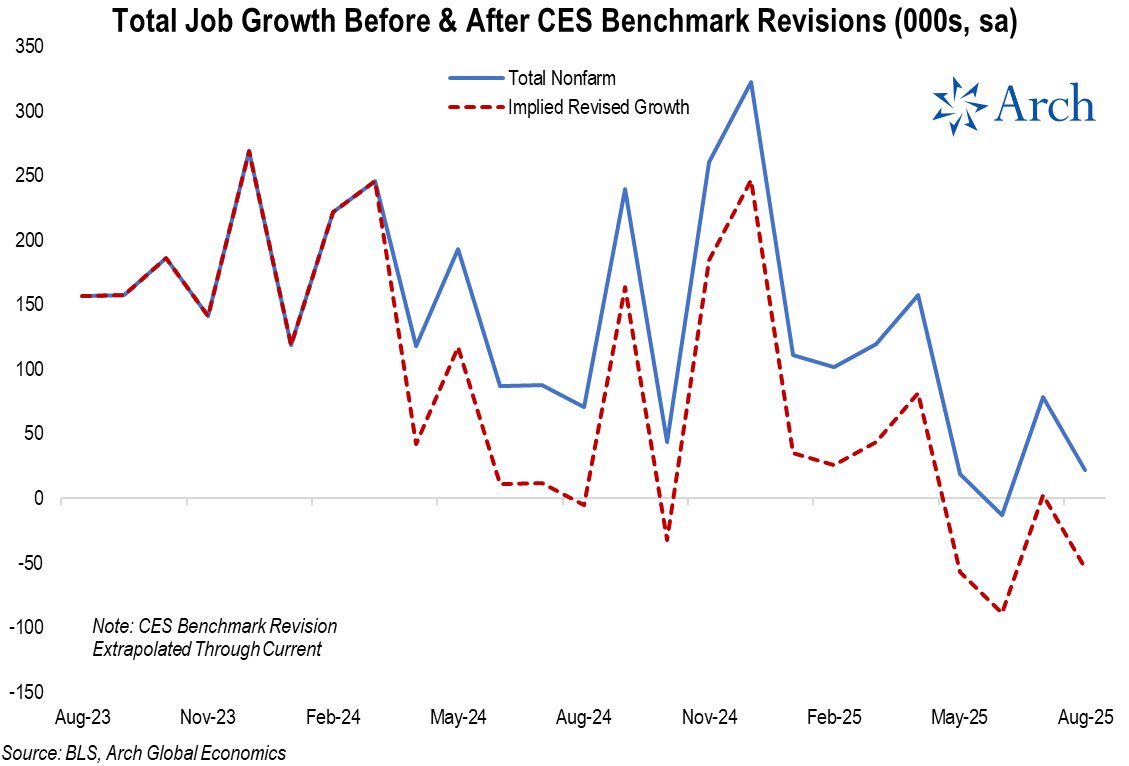
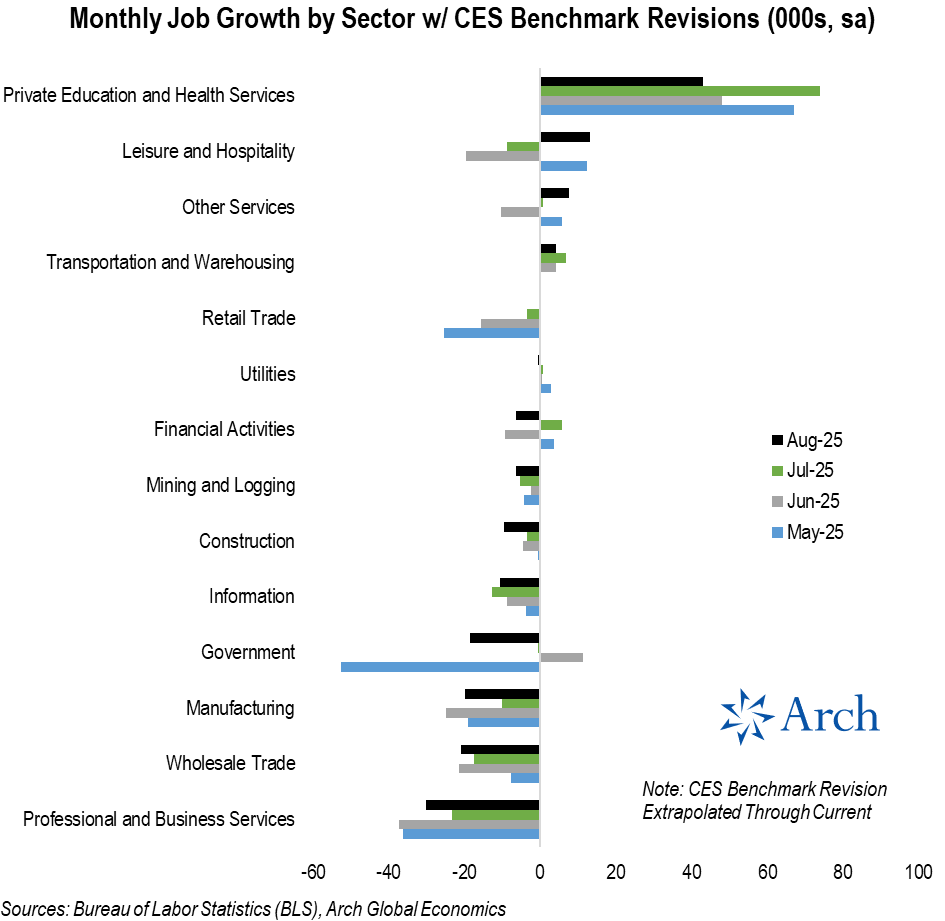
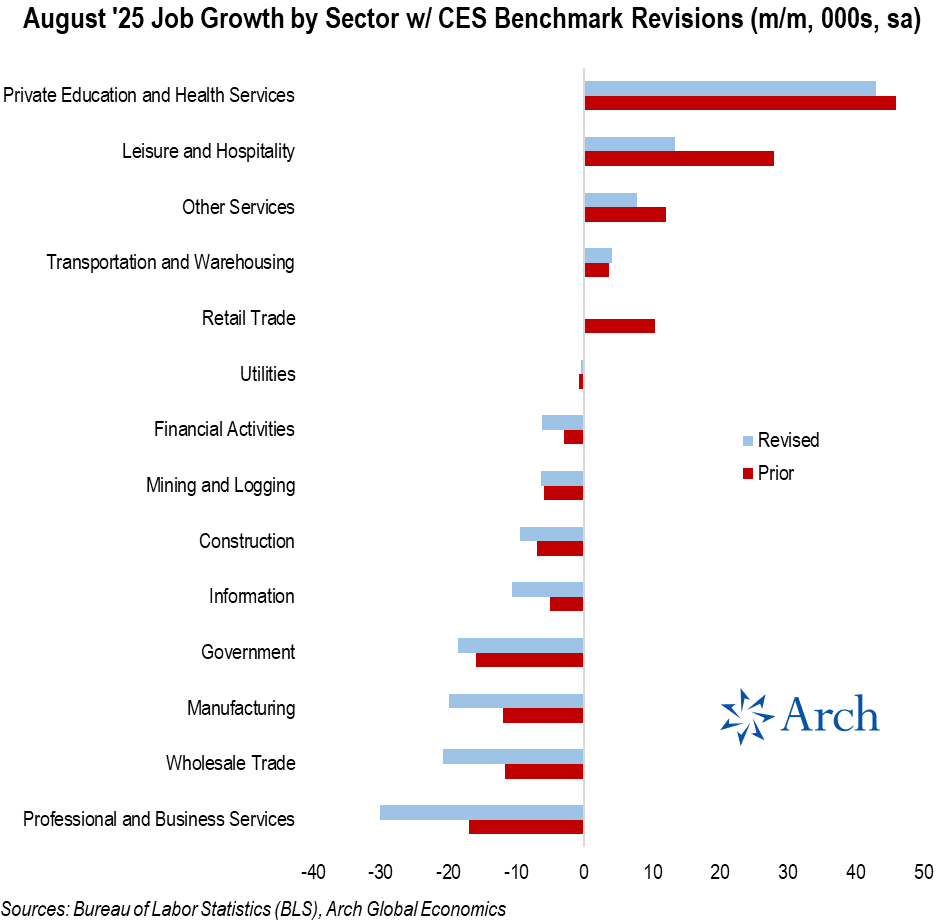
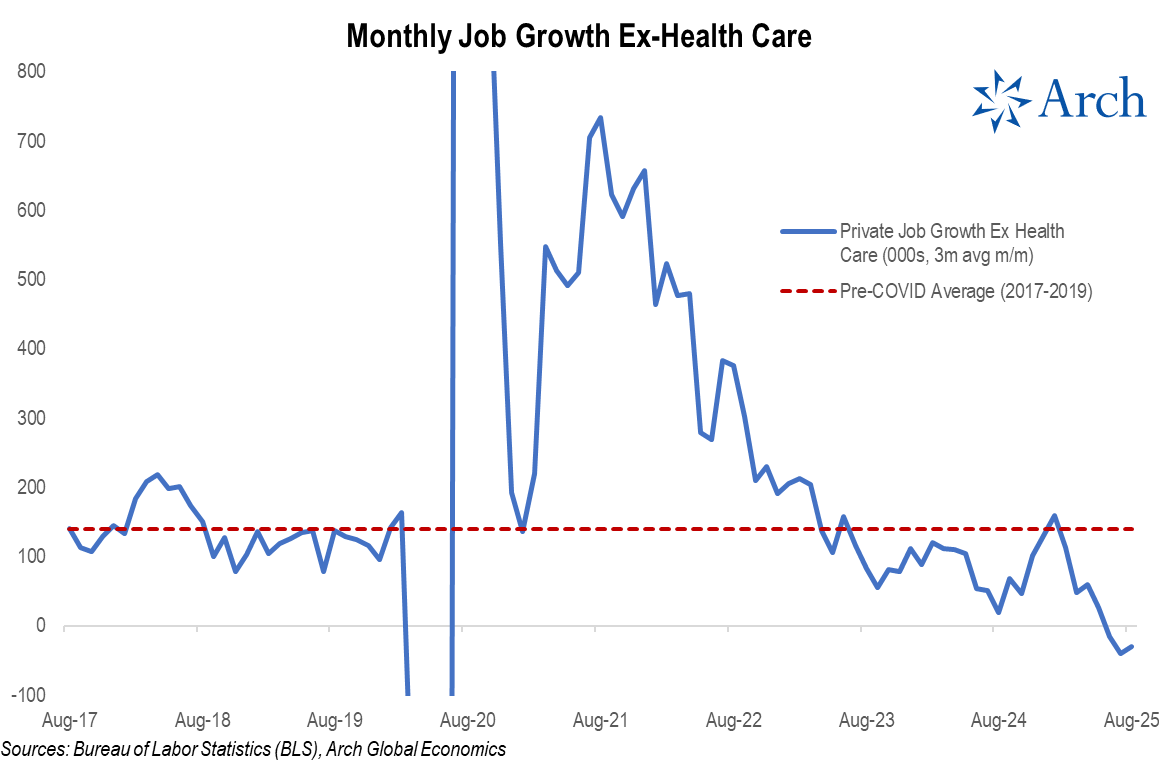
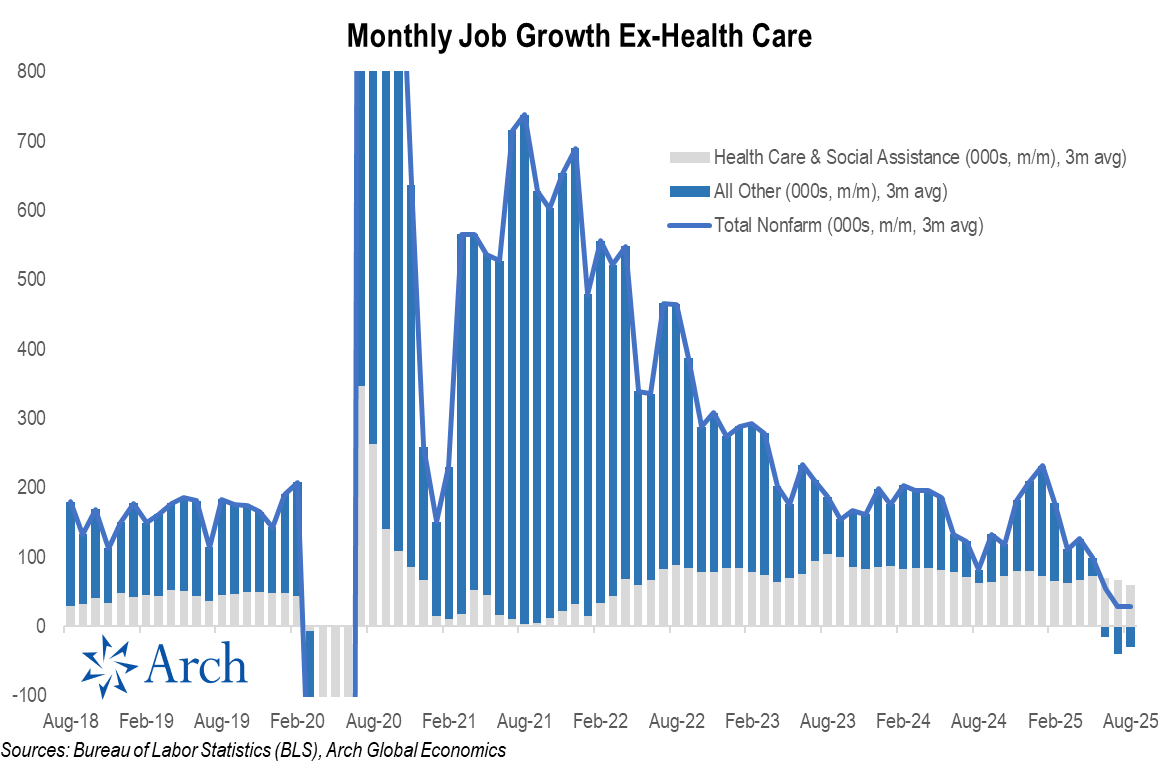
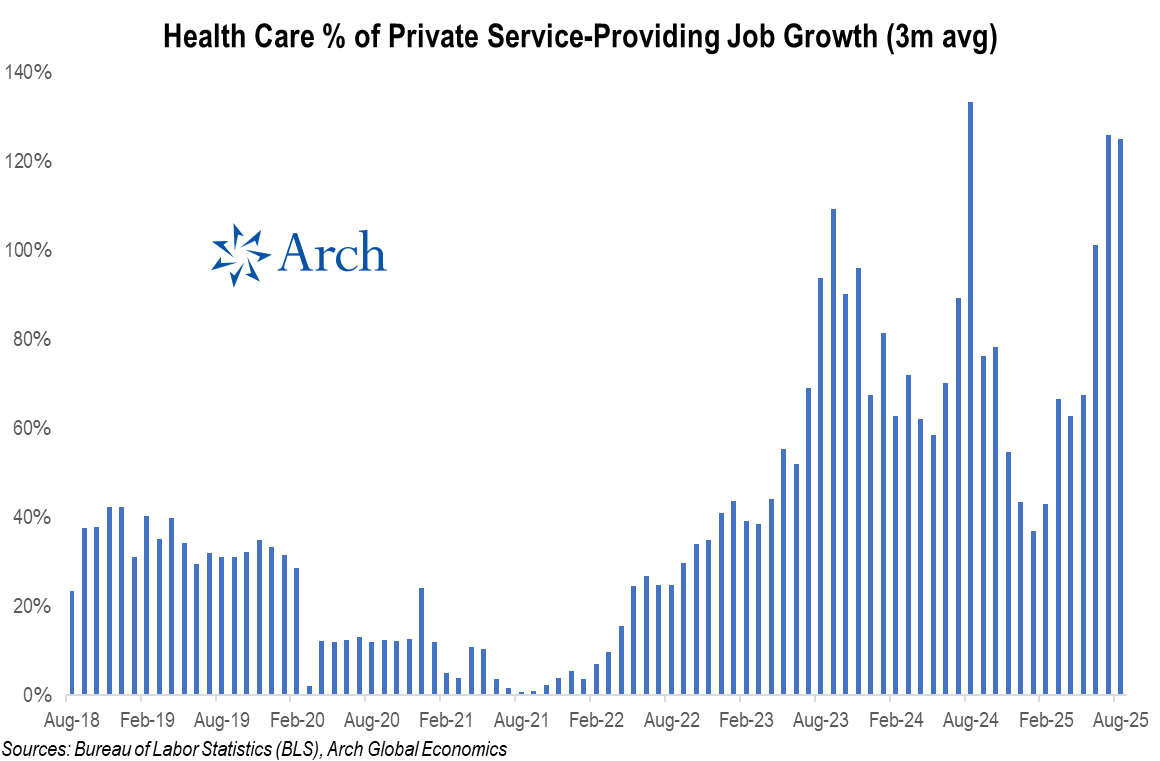
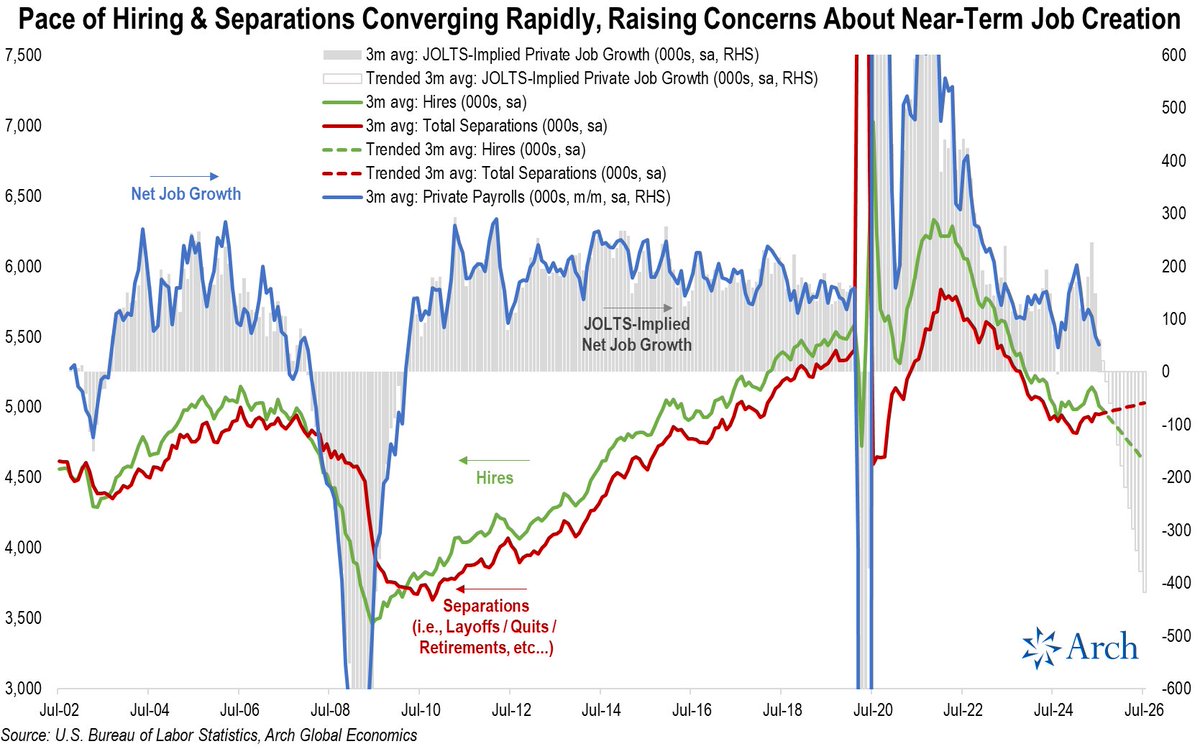
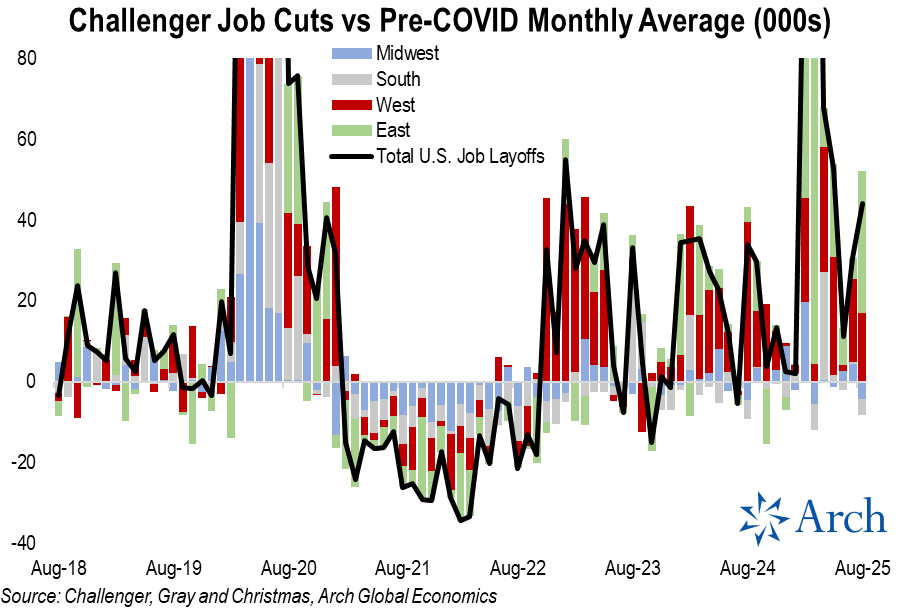
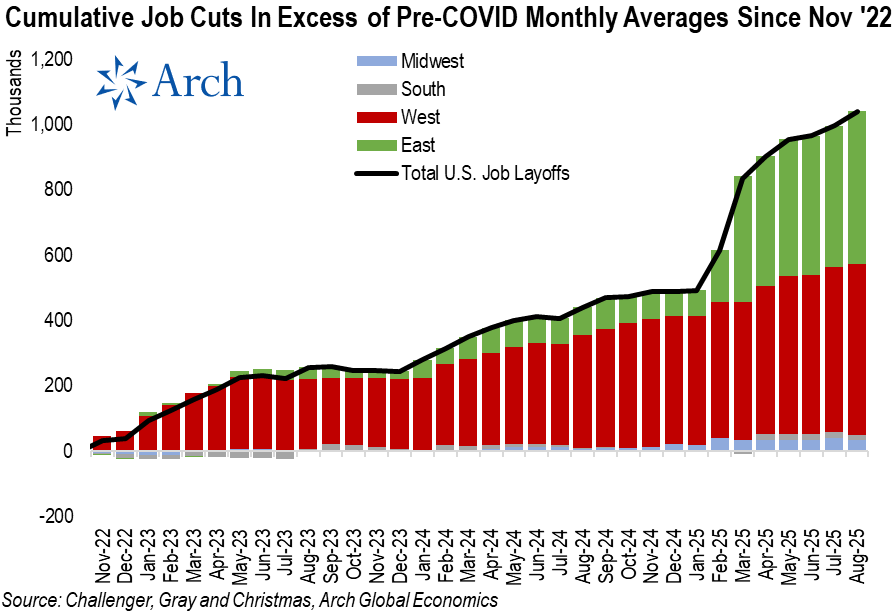
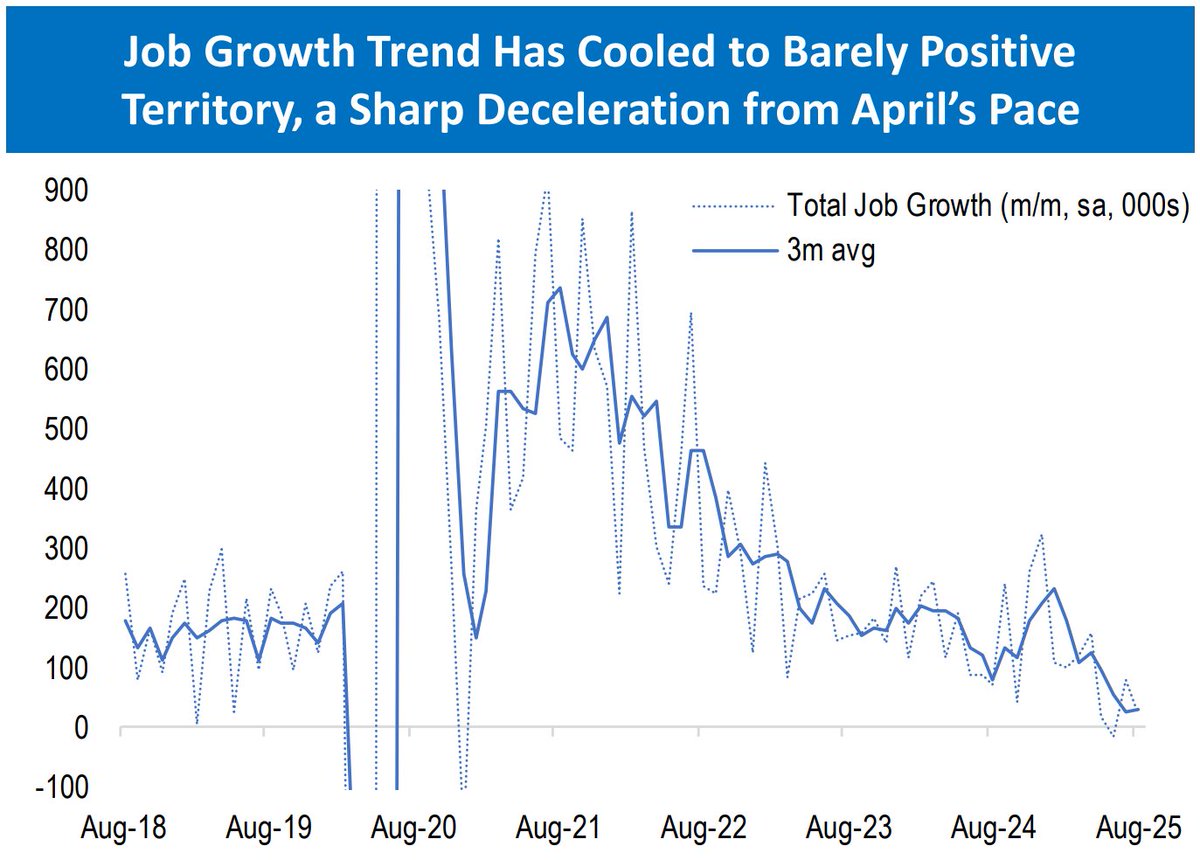
• Key Takeaway: August employment report retained the soft trend that has been in place since May, but slack is accumulating at a gradual pace.
• Macro Implications: Downside risks dominate, making Fed Sept. rate cut a lock, with inclination toward sequential rather than quarterly moves.
• Housing Implications: Mortgage rates fell to near 12-month-low amid lower U.S. Treasury yields and additional help from spread compression.
• Macro Implications: Downside risks dominate, making Fed Sept. rate cut a lock, with inclination toward sequential rather than quarterly moves.
• Housing Implications: Mortgage rates fell to near 12-month-low amid lower U.S. Treasury yields and additional help from spread compression.
• • •
Missing some Tweet in this thread? You can try to
force a refresh