Tuesday 🧵
Gold & Silver Analog Charts Updated
These are some of my best and favorite charts.
Let's Go!
Gold & Silver Analog Charts Updated
These are some of my best and favorite charts.
Let's Go!
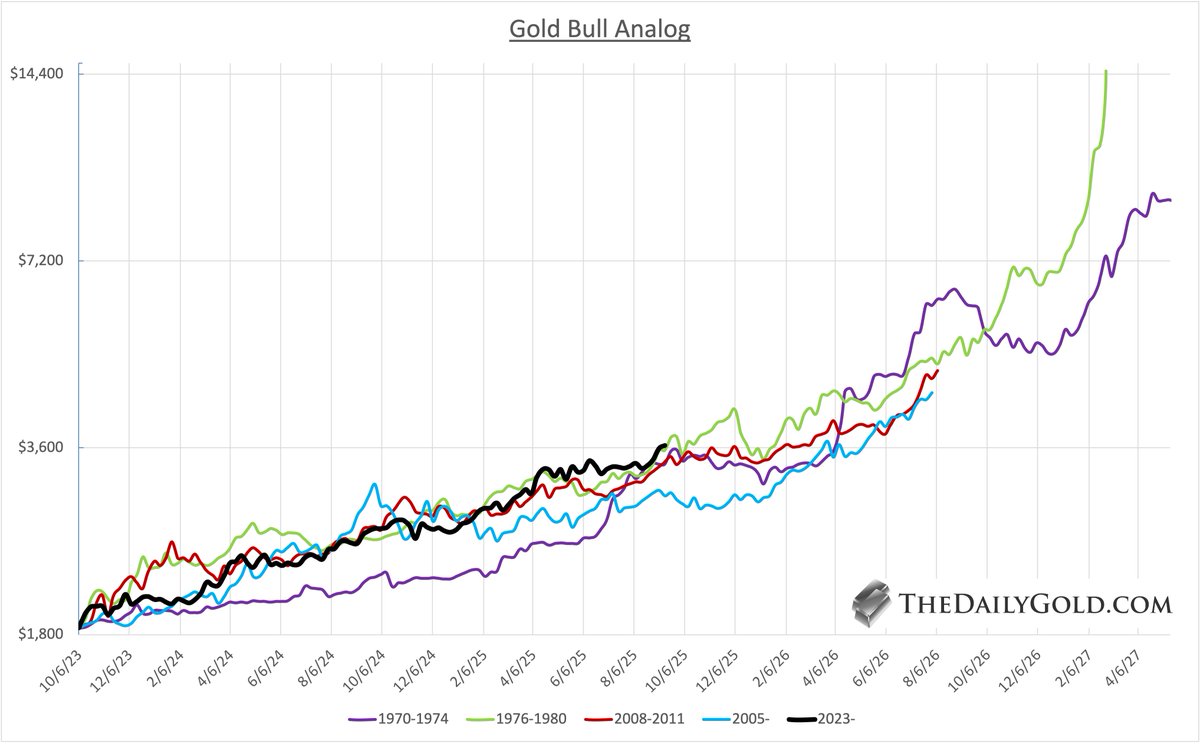
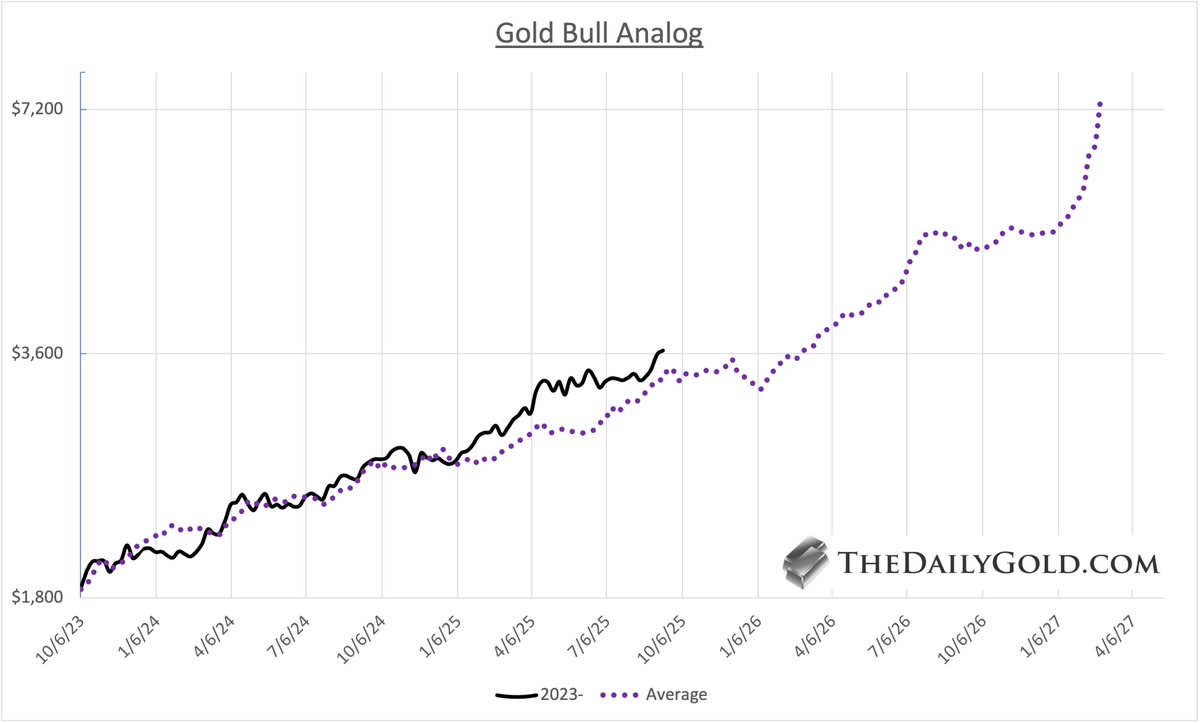
1) Gold Bull Analog
This chart plots the 4 strongest cyclical moves in Gold, on the scale of the current move that began October 2023.
(I start the moves when an impulsive uptrend begins).
Nearly two years in, and Gold has followed the template almost to a T.
The two weaker moves peaked just below $5000 in August 2026.
The two others (1970-1974, 1976-1980) peaked at ~$9,000 and ~$14,000.
2) Gold Bull Analog Average
Here we remove the 4 lines and plot an average.
The average, when the two weaker moves peaked, around August 2026 is $5100/oz.
However, if we continue all 4 for another 30 weeks, the average reaches ~$7500 in 18 months.
Here we remove the 4 lines and plot an average.
The average, when the two weaker moves peaked, around August 2026 is $5100/oz.
However, if we continue all 4 for another 30 weeks, the average reaches ~$7500 in 18 months.
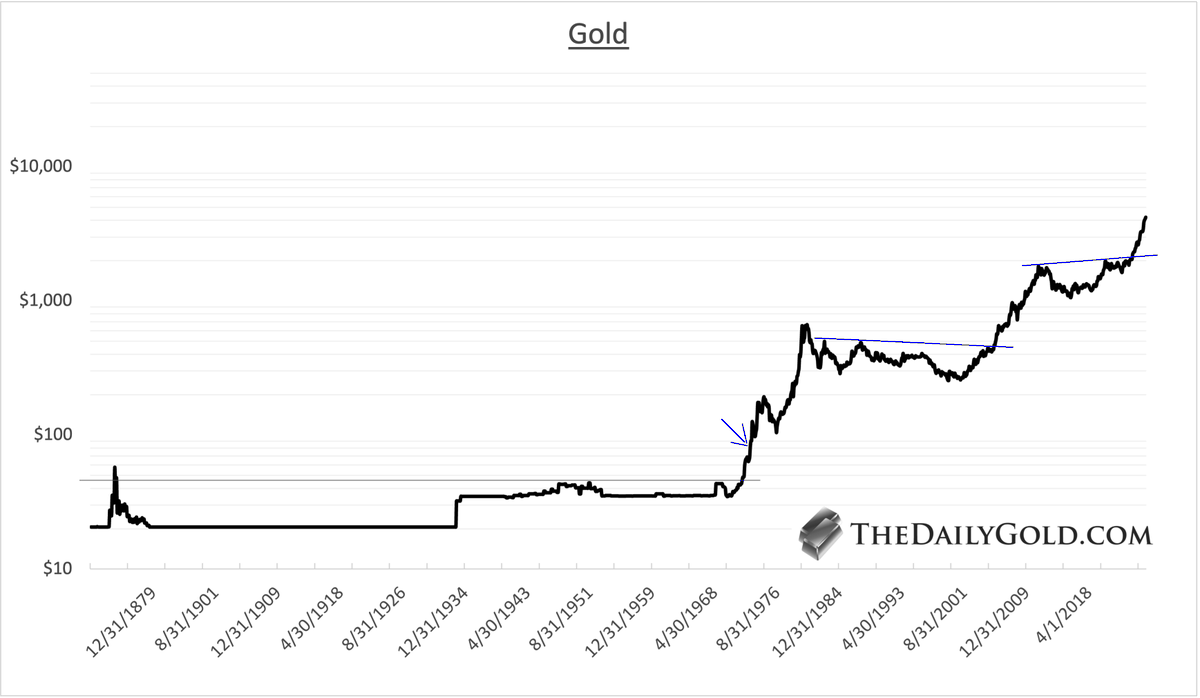
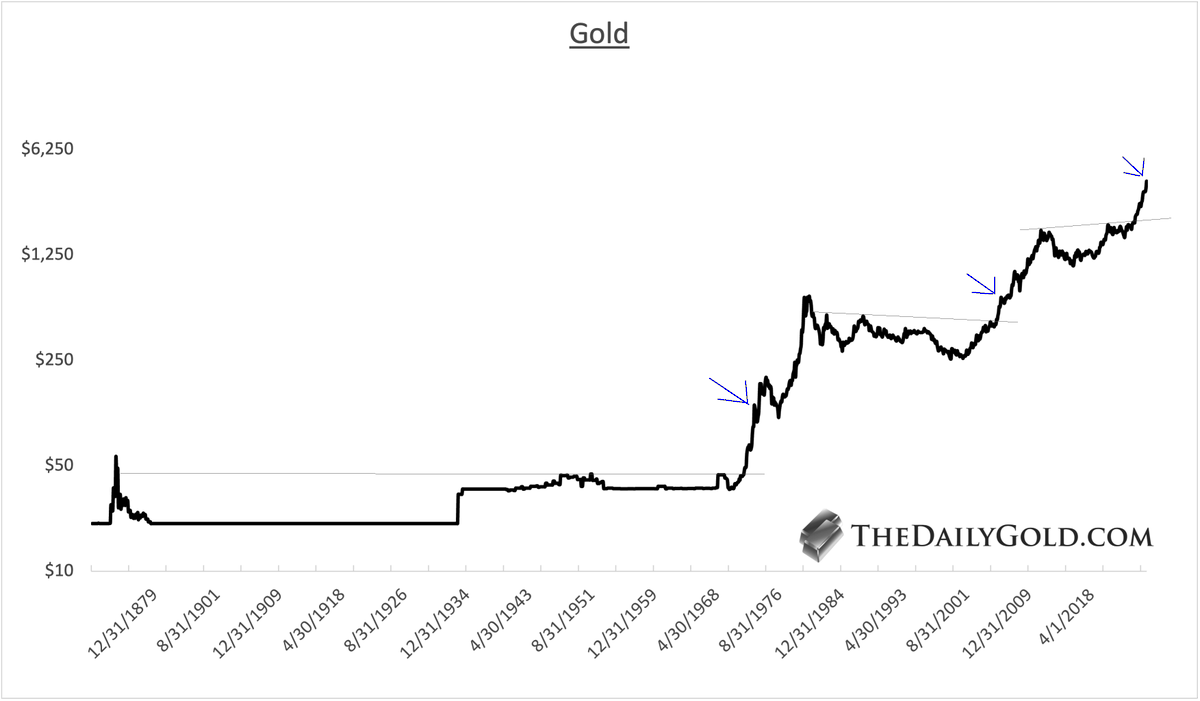
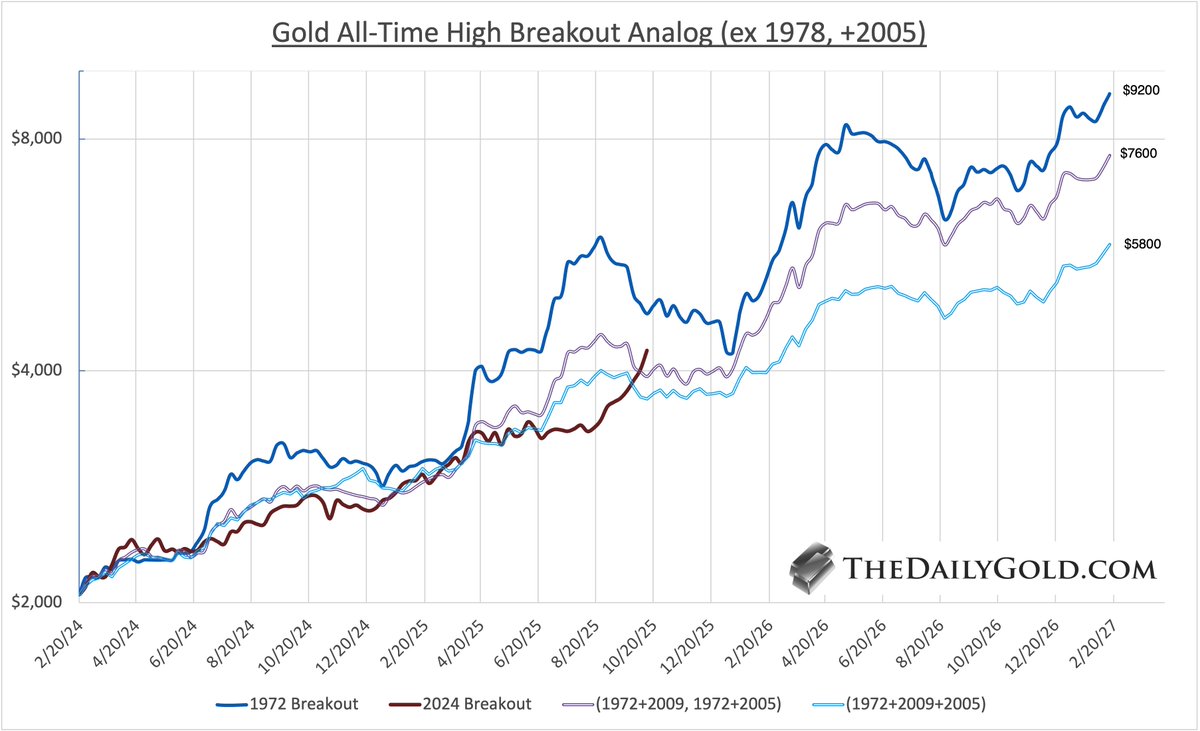
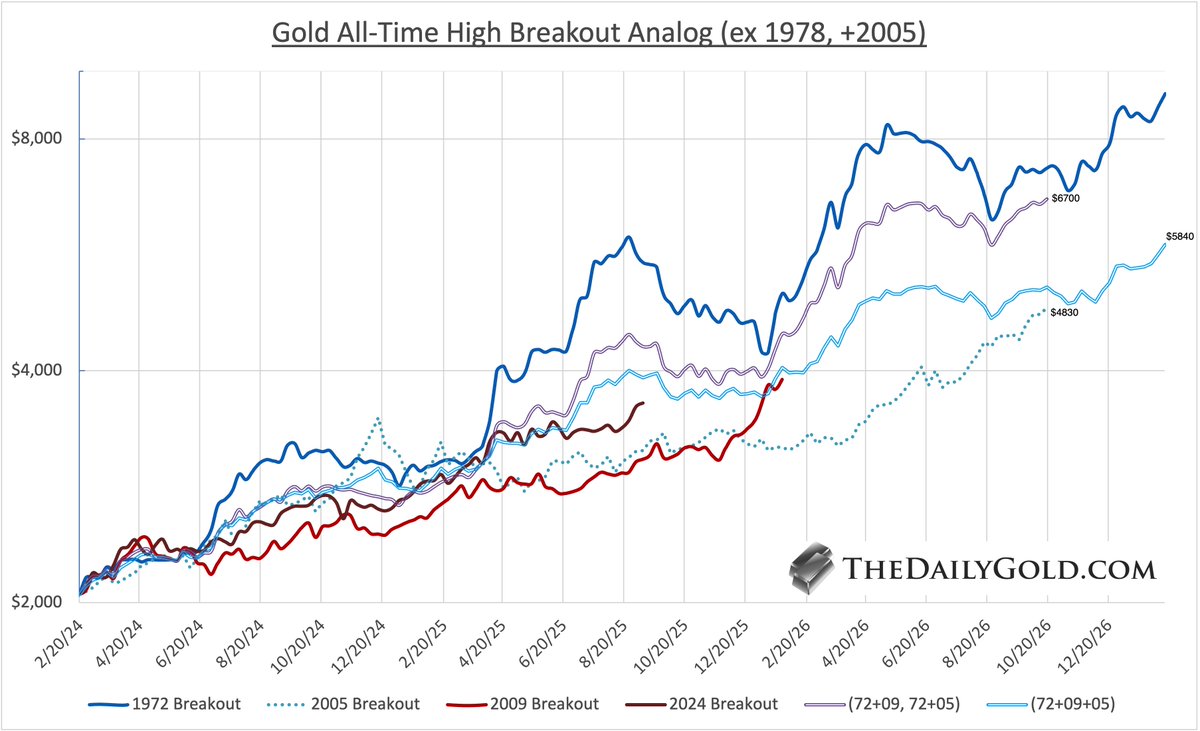
3) Gold All-Time High Breakout Analog
This chart shows the breakouts to new all-time highs in Gold (1972, 1978, 2009) on the scale of the 2024 breakout which began in late February 2024.
The chart omits the 1978-1980 moonshot and includes the 2005 breakout.
Although not to a new all-time high, it was the 3rd biggest breakout in Gold's history.
One average includes 1972, 2009 and 2005, while the other includes 1972 and 2009 and when 2009 peaks, replaces it with 2005.
The targets 13 to 16 months from now range from $4830 to $6700.
Look closely and you will see Gold has mirrored the two averages until the past few months.
From this chart only, I have a $6000 target in 18 months.
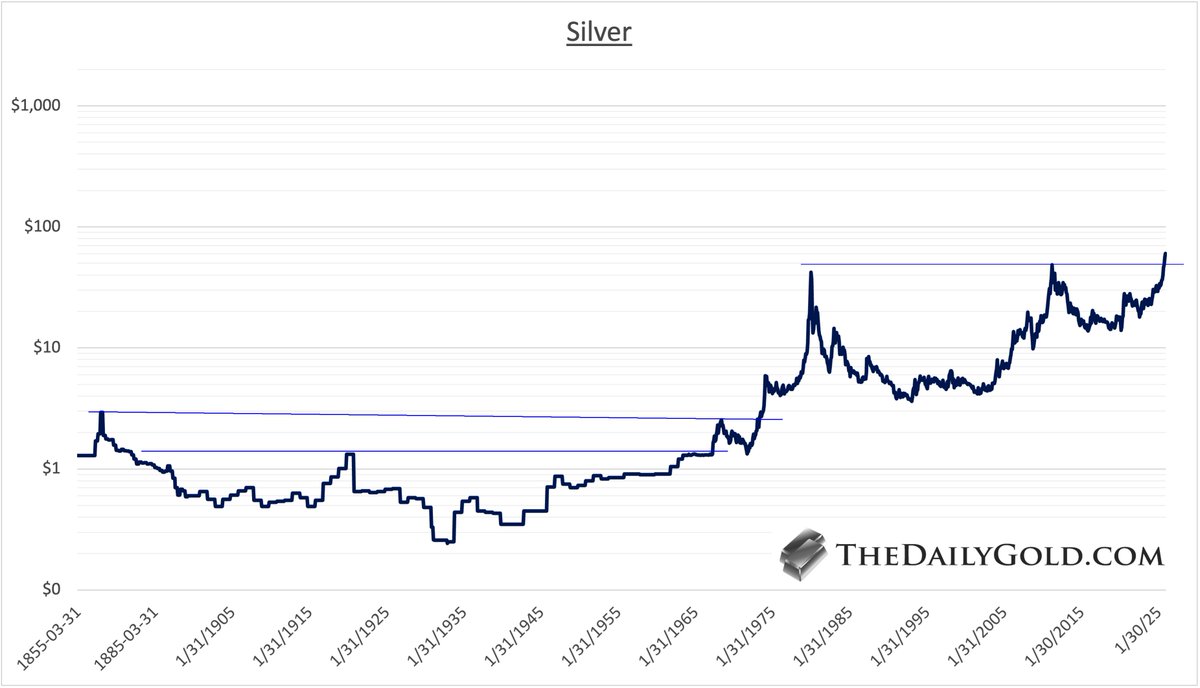
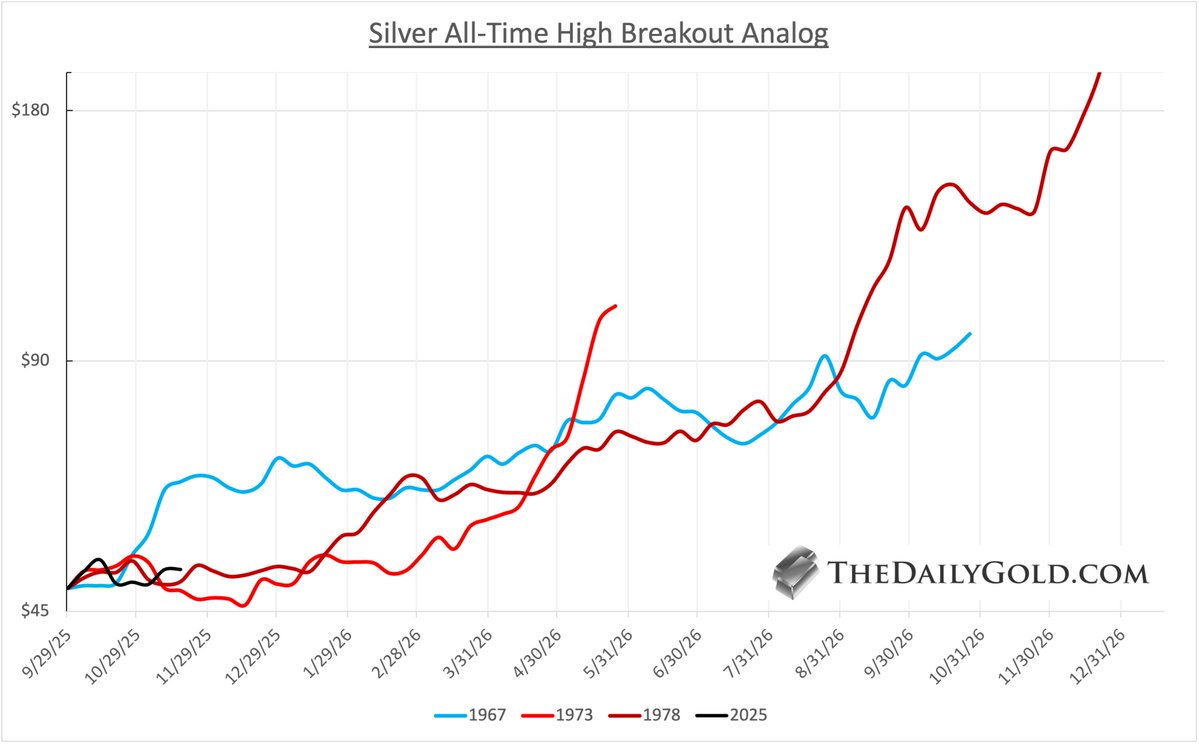
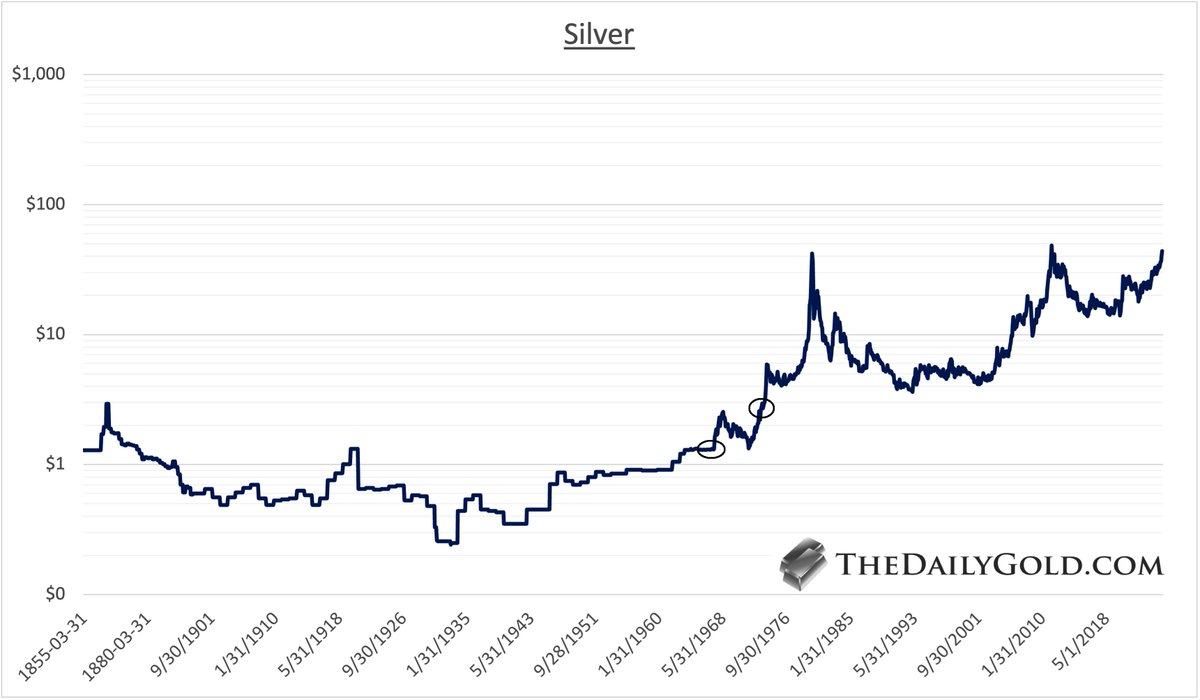
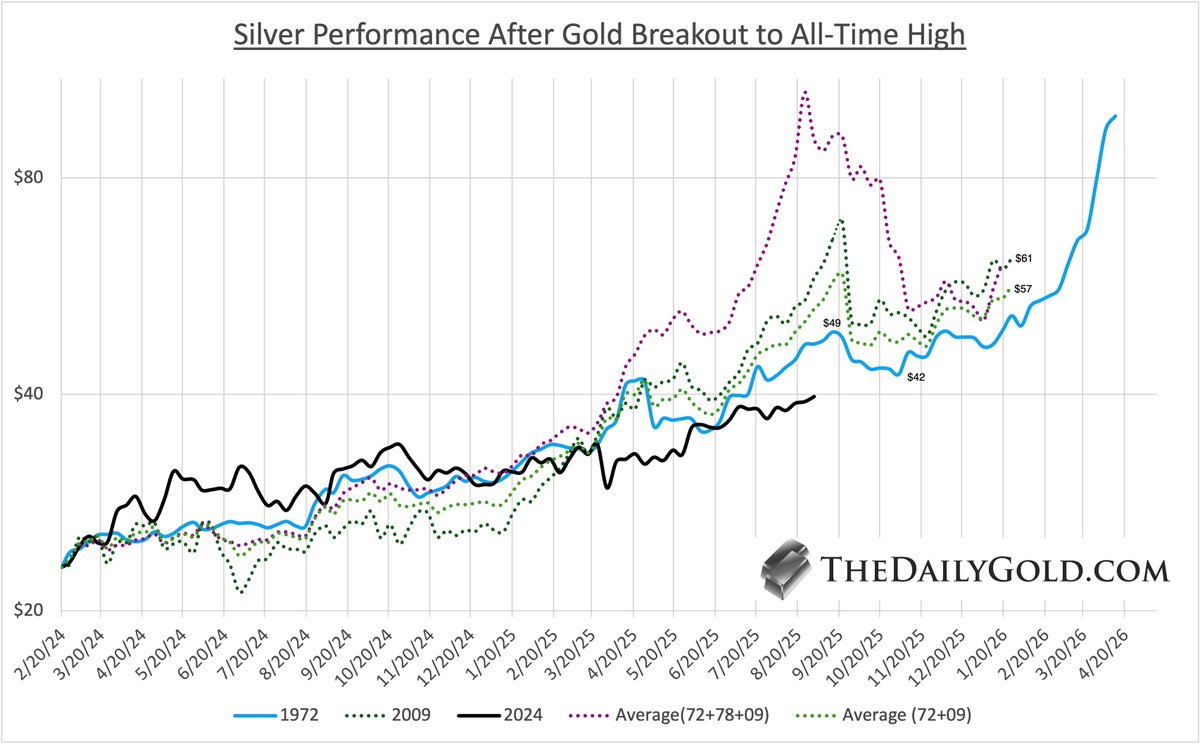
4) Silver Performance After Gold Breakout to All-Time High
We plot Silver's performance after the Gold Breakouts to new All-Time Highs in 1972, 1978 and 2009.
It's on the scale of the 2024 breakout.
I removed 1978-1980 from the chart but not the data.
There are two important observations from this chart.
First, when I continue the averages and 2009 post-peak, they coalesce around $60 in 4 months.
Second, Silver has somewhat followed the 1972 trajectory.
I love how 1972 on this scale hits $49 and then forms a perfect cup and handle pattern, bottoming at $42, before blasting through $50.
Could Silver, after reaching $49-$50, pullback to $42, currently the most significant resistance between $35-$37 and $50?
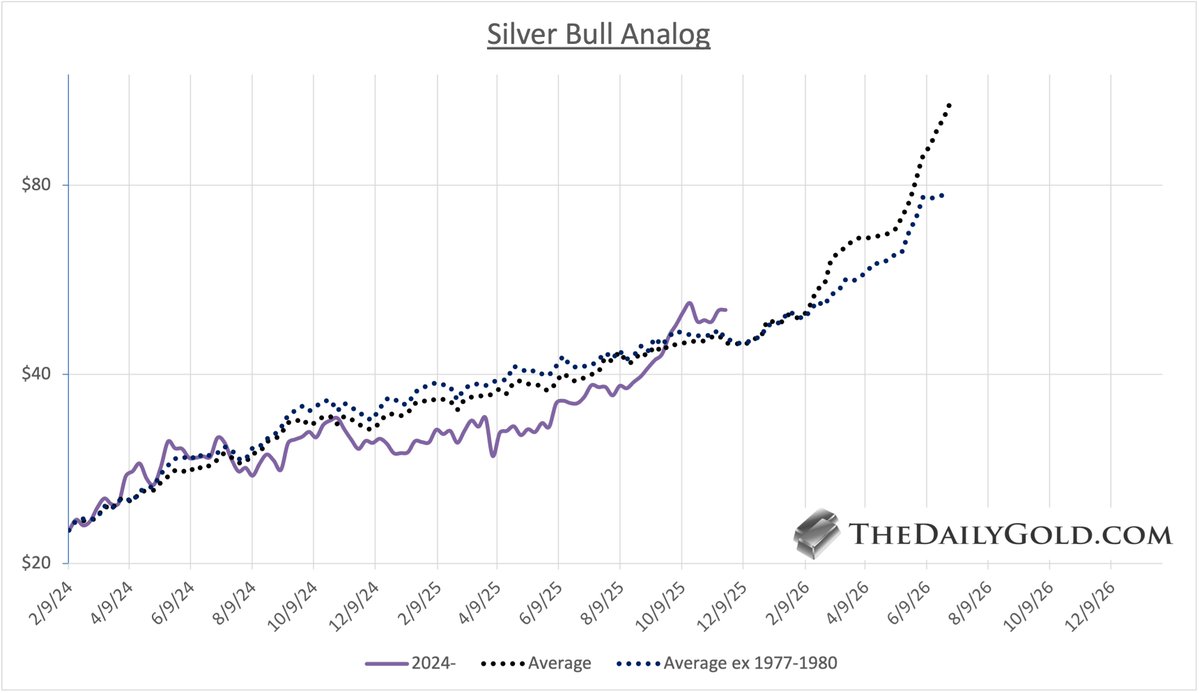
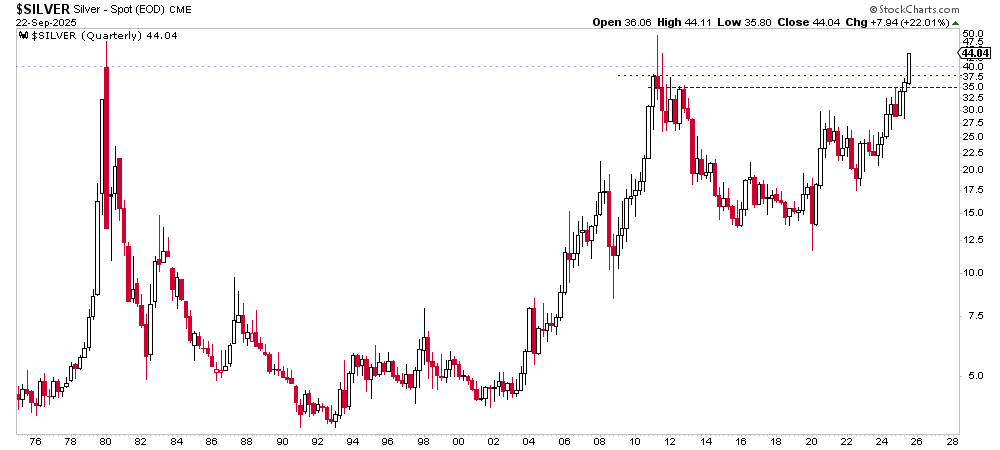
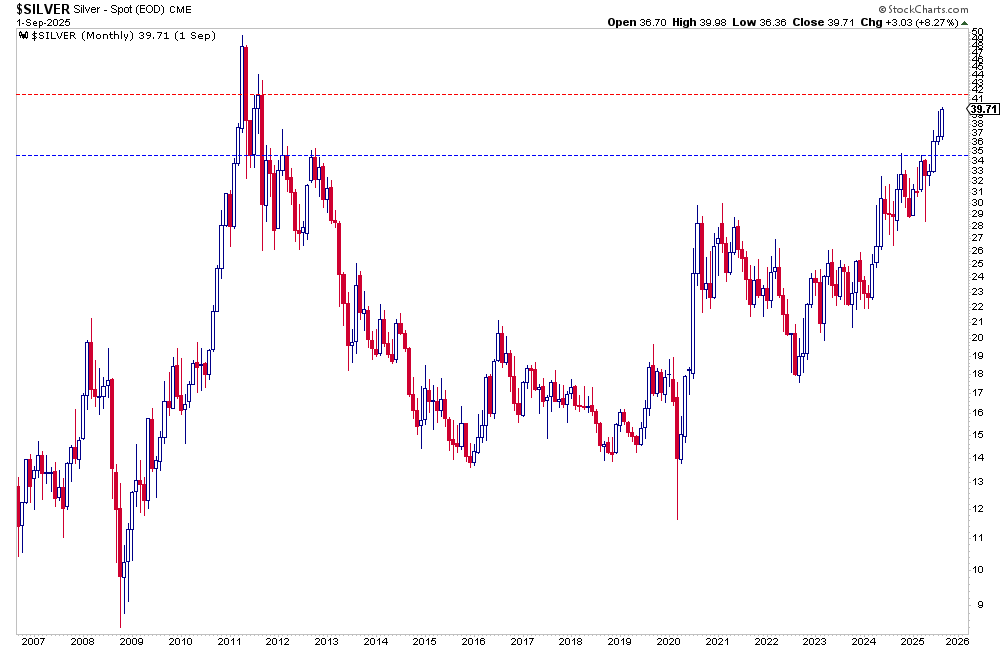
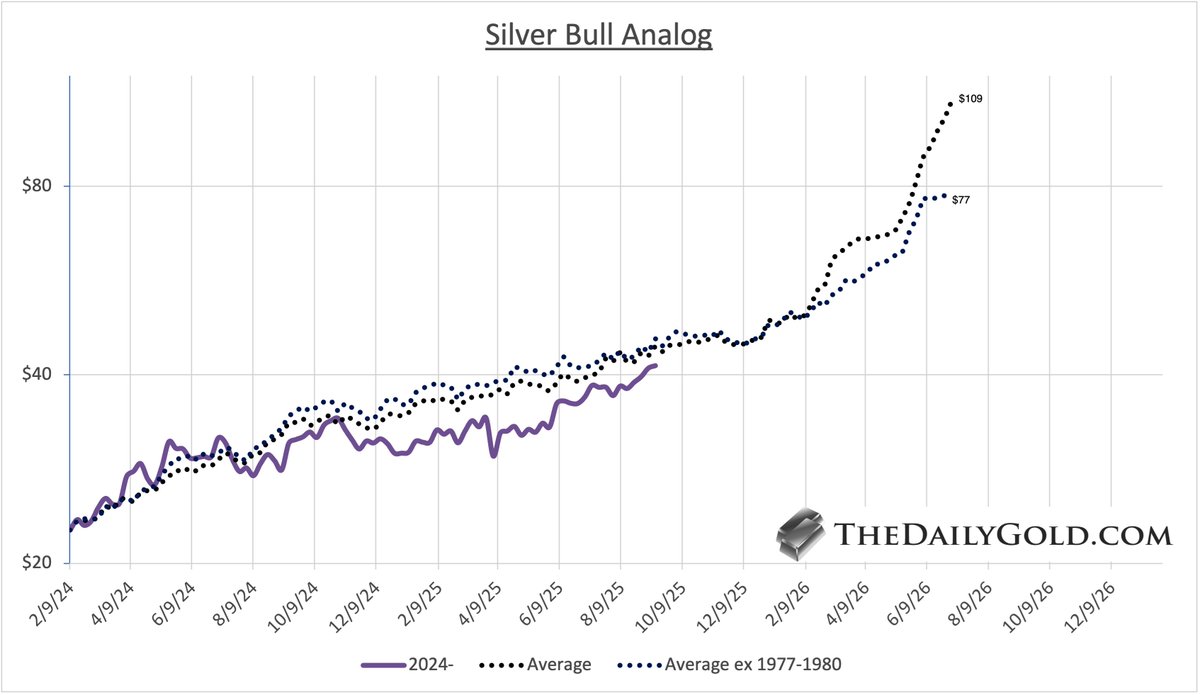
5) Silver Bull Analog Averages
As we did for Gold in #1, we do for Silver.
However, because the chart is messy, we show the averages.
(The 4 moves are 1971-1974, 1977-1980, 2005-2008, 2008-2011).
We plot the current cyclical move in Silver against two averages.
One average is all 4 moves while the other excludes the best and takes the other 3.
Taking the weaker average still puts Silver at $77 in 10 months.
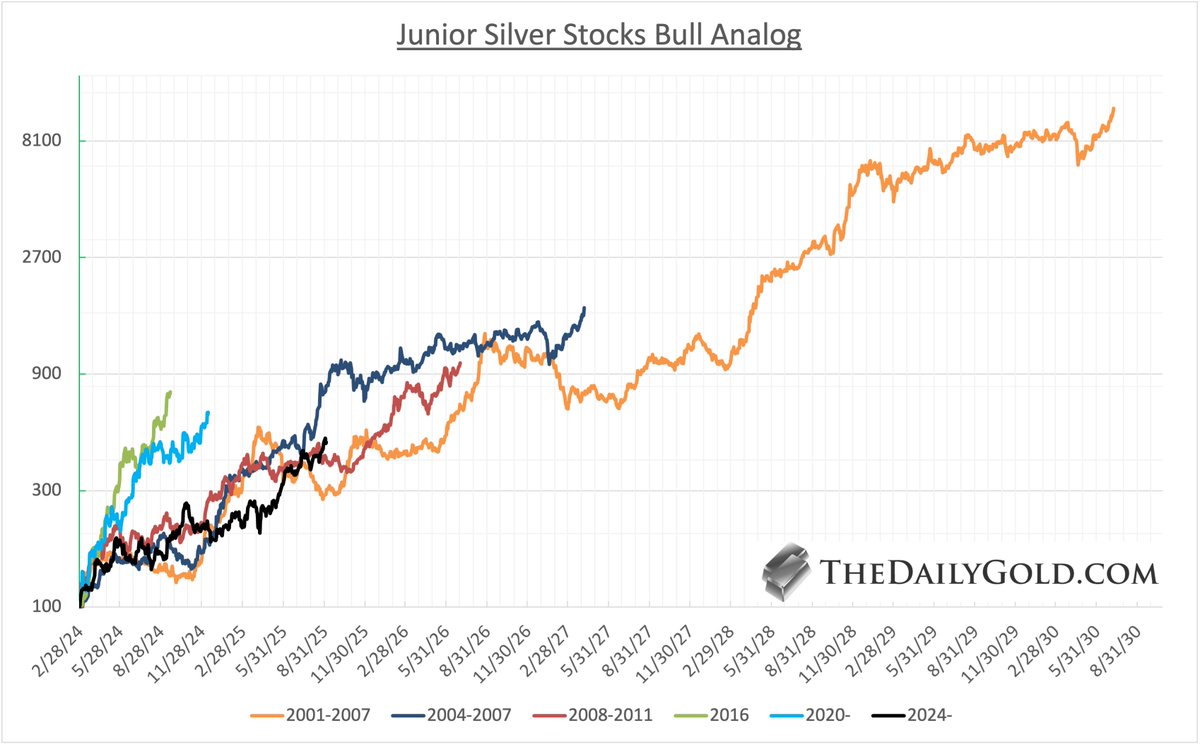
6) Junior Silver Stocks Bull Analog
The current 10-stock index has made a move from 200 in April to now 474 in September.
As I tell subscribers, these are not necessarily what I think are the 10 best stocks or 10 best companies.
There is extremely heavy survivorship bias here.
The 2001-2007 move went 100x, but it endured multiple changes in this index.
Could the current index 20x in the next 4-5 years?
Probably not, because some companies will be acquired along the way. But some stocks will.
In any case, considering $100 Silver is not too far, the outlook for junior silver stocks remains extremely bullish.
7) Summary
These analog charts show what is possible based on the history of major bull markets in Gold and Silver.
Considering the significance of Gold's 13-year cup and handle breakout to new all-time highs and Silver's impending break above $50, the current cyclical bull market should rival the best ever, or be close.
That being said, even the modest projections make me a bit uneasy.
It's difficult to sound reasonable and realistic when echoing some of these targets.
But bull market surprise on the upside, and history and data strongly support these projections.
8) Thank you for reading!
Would you be so kind to like and retweet this thread?
Thank you for your support.
Want to find quality junior silver and junior gold stocks with 5x to 10x potential?
thedailygold.com/premium/
Would you be so kind to like and retweet this thread?
Thank you for your support.
Want to find quality junior silver and junior gold stocks with 5x to 10x potential?
thedailygold.com/premium/
• • •
Missing some Tweet in this thread? You can try to
force a refresh