The Aug PPI declined -0.1%, softer than expected (0.3%) although PPI excluding food, energy & trade was in-line with expectations at 0.3%.
What does this mean?
Core goods prices are still rising at an above trend pace, while broader price pressures eased.
Details in the 🧵
What does this mean?
Core goods prices are still rising at an above trend pace, while broader price pressures eased.
Details in the 🧵
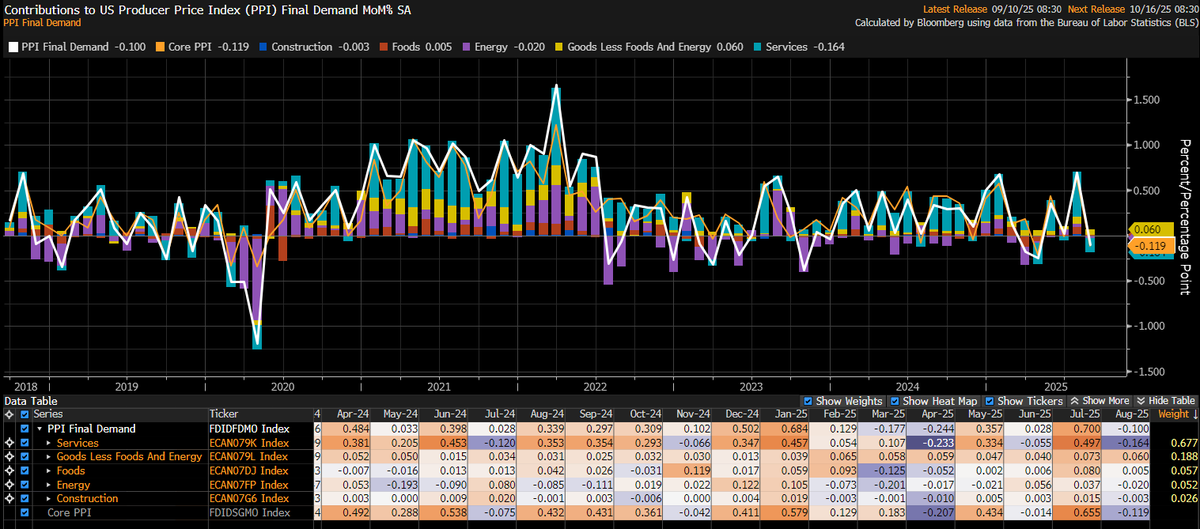
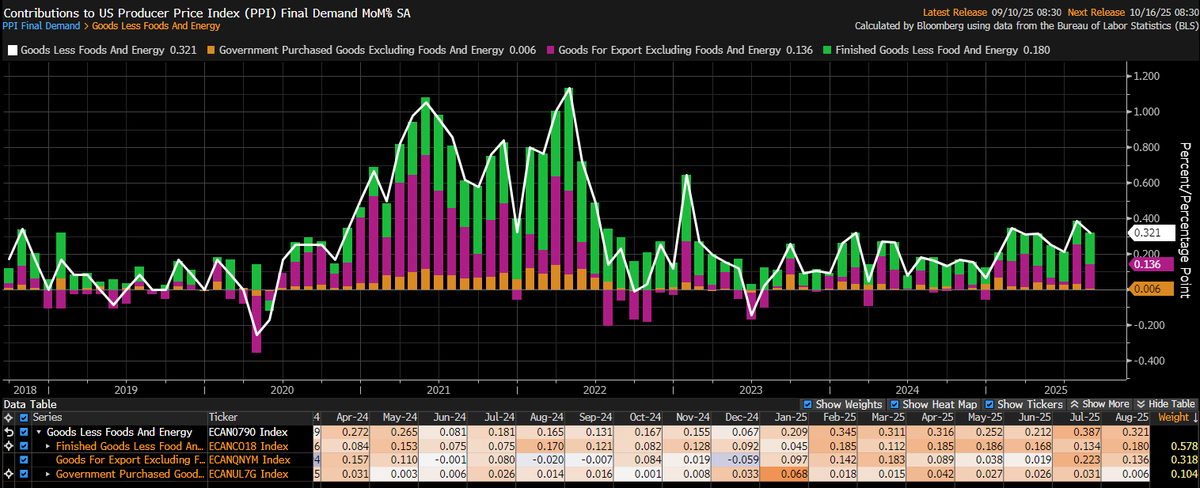
Let's look at Goods Less Food And Energy, what I was referring to as "Core Goods."
Prices for core goods were up 0.32% in Aug, which is well above trend despite stepping down slightly from July.
Prices for core goods were up 0.32% in Aug, which is well above trend despite stepping down slightly from July.
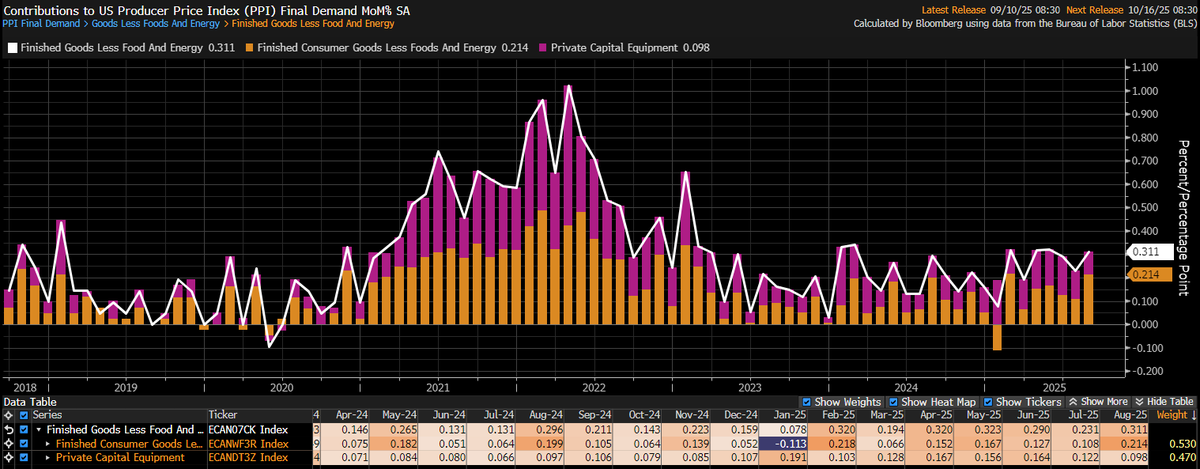
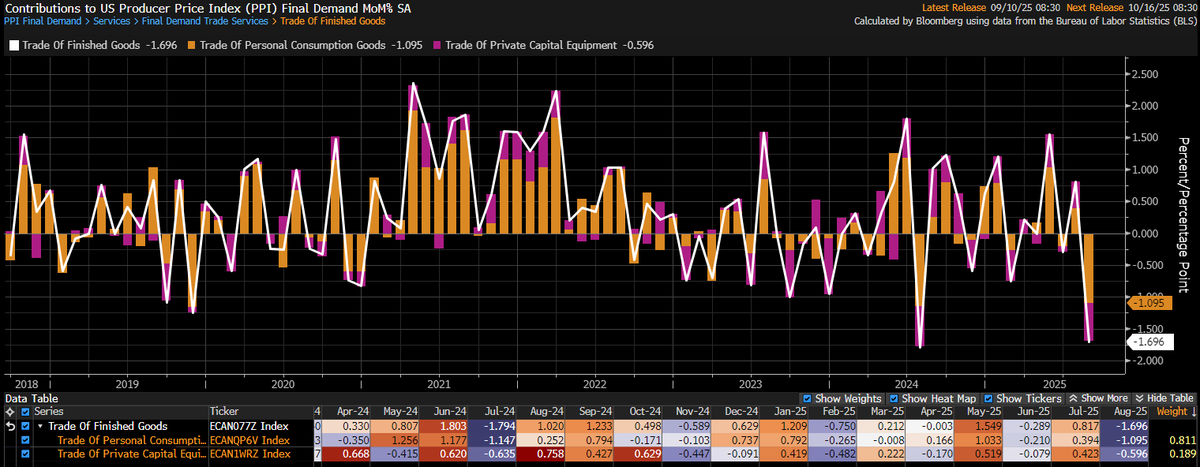
Looking specifically at Finished Core Consumer Goods and Private Capital Equipment, it's clearer that there is still upward pressure on goods inflation.
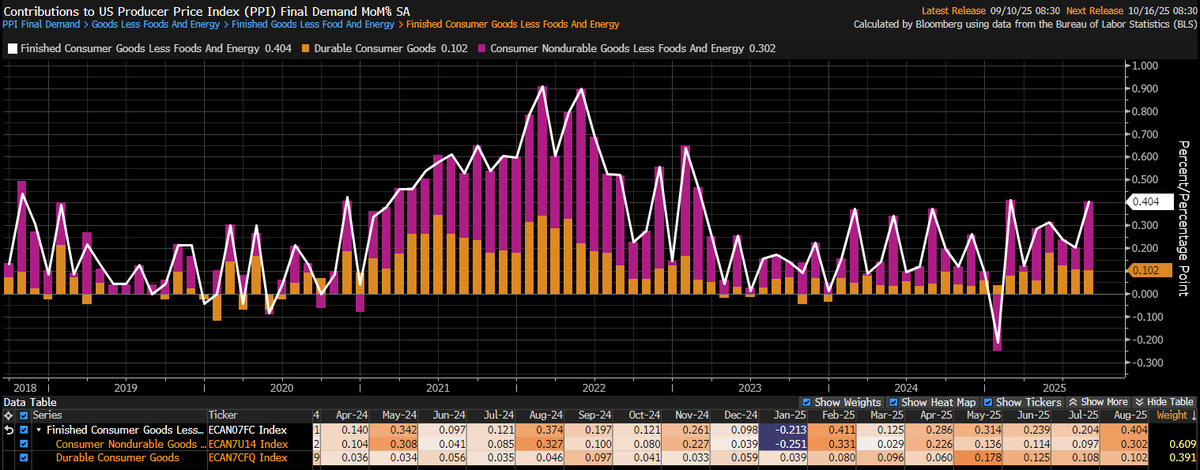
Honing in on finished core consumer goods, we can see still elevated Durable Goods inflation and a jump in Nondurable Goods.
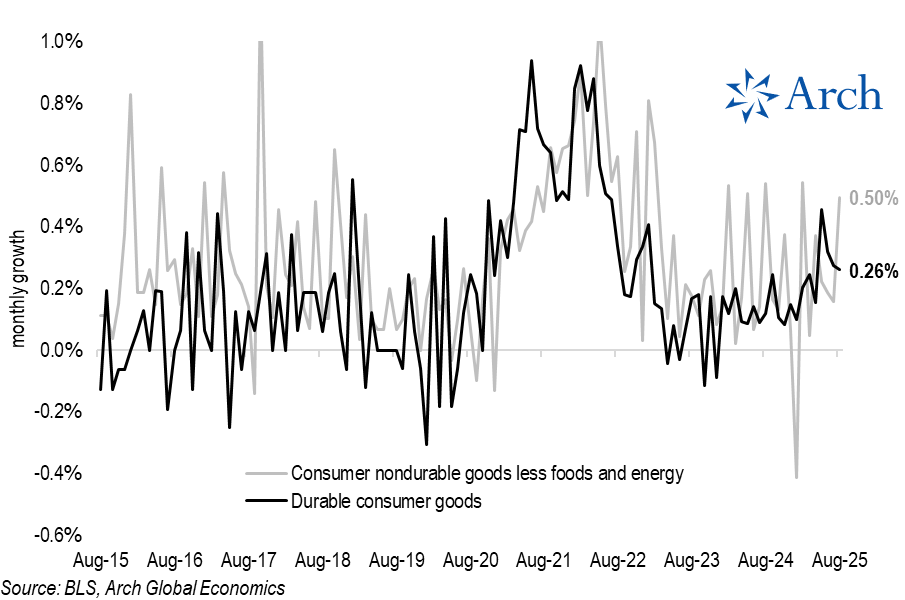
Here's the same two measures, but each on a monthly basis rather than a monthly contribution basis.
Again, it's clear both are trending the wrong direction through all the noise.
Again, it's clear both are trending the wrong direction through all the noise.
So, why was headline PPI down in Aug despite this ramp up in Core Consumer Goods prices?
Well, they account for less than 6% of the total PPI index.
Services on the other hand account for over 2/3 of the PPI index, and prices declined -0.24% in Aug for Services.
Well, they account for less than 6% of the total PPI index.
Services on the other hand account for over 2/3 of the PPI index, and prices declined -0.24% in Aug for Services.
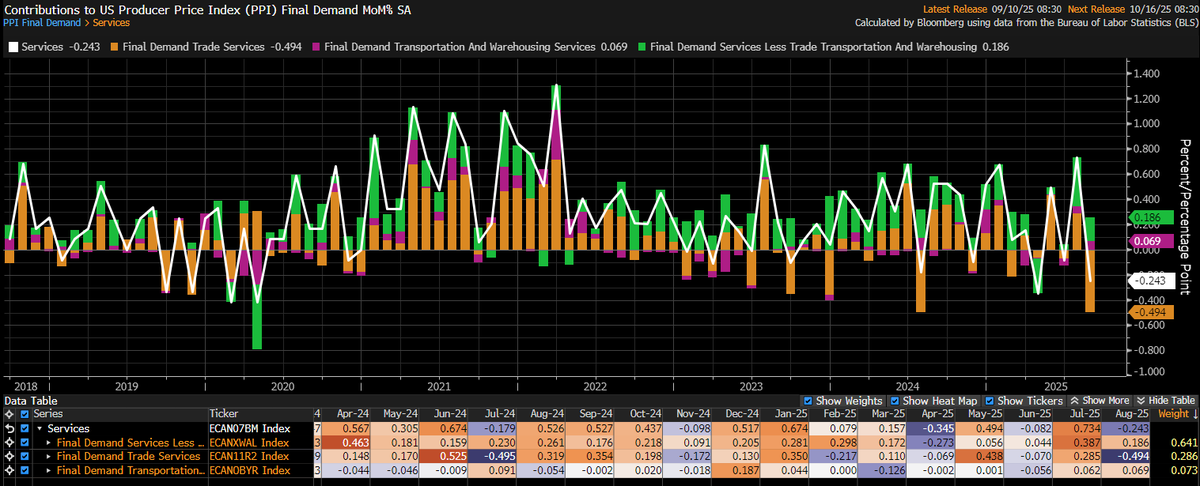
That big negative orange bar above is Final Demand Trade Services, which is a proxy for trade margins.
After a few big months of rising trade margins, they reversed sharply in August.
After a few big months of rising trade margins, they reversed sharply in August.

Why did margins get squeezed in Aug?
It could be that consumers finally balked at margin padding of recent months or maybe end of summer discounting is eating into margins...
It could be that consumers finally balked at margin padding of recent months or maybe end of summer discounting is eating into margins...
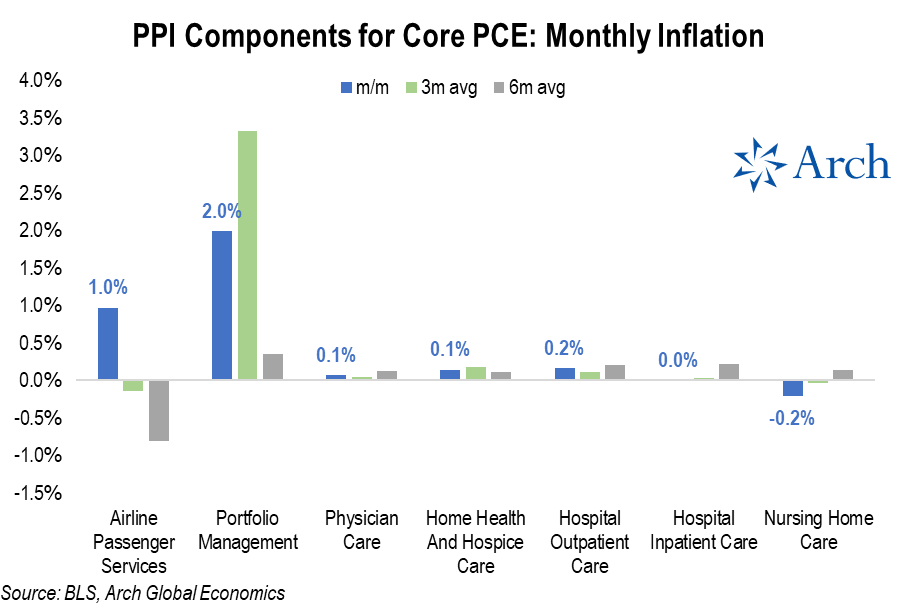
Looking ahead, here are the key categories that flow into the PCE inflation report later this month.
While most were relatively benign, Airline Passenger Fees surged 1% in Aug, reversing some recent weakness, and Portfolio Management Fees also remained elevated at 2%
While most were relatively benign, Airline Passenger Fees surged 1% in Aug, reversing some recent weakness, and Portfolio Management Fees also remained elevated at 2%
Altogether, this morning's report is likely to keep the Fed worried about tariff pass-through effects, given still hot core consumer goods inflation despite the headline miss.
On the other hand, broader price pressures do not look overly concerning.
On net, it is unlikely this week's data releases will sway the Fed from restarting the easing cycle next week.
On the other hand, broader price pressures do not look overly concerning.
On net, it is unlikely this week's data releases will sway the Fed from restarting the easing cycle next week.
• • •
Missing some Tweet in this thread? You can try to
force a refresh