Danny Dayan Profile picture
Sep 10 4 tweets 3 min read Read on X
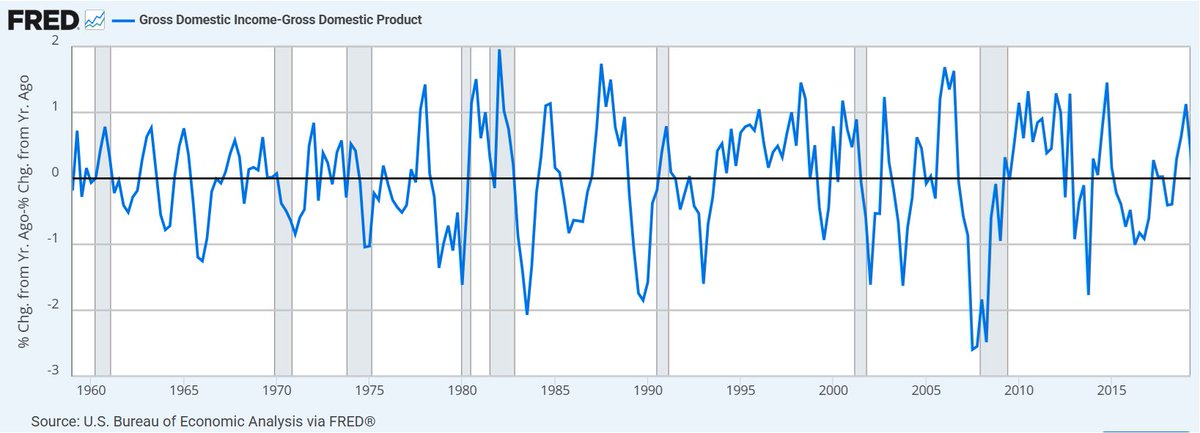
At turning points, I like to compare GDI to GDP. GDP has trade, inventories and large revisions. GDI is income.

If GDI is falling relative to GDP, bad things tend to happen. This is pre-COVID.
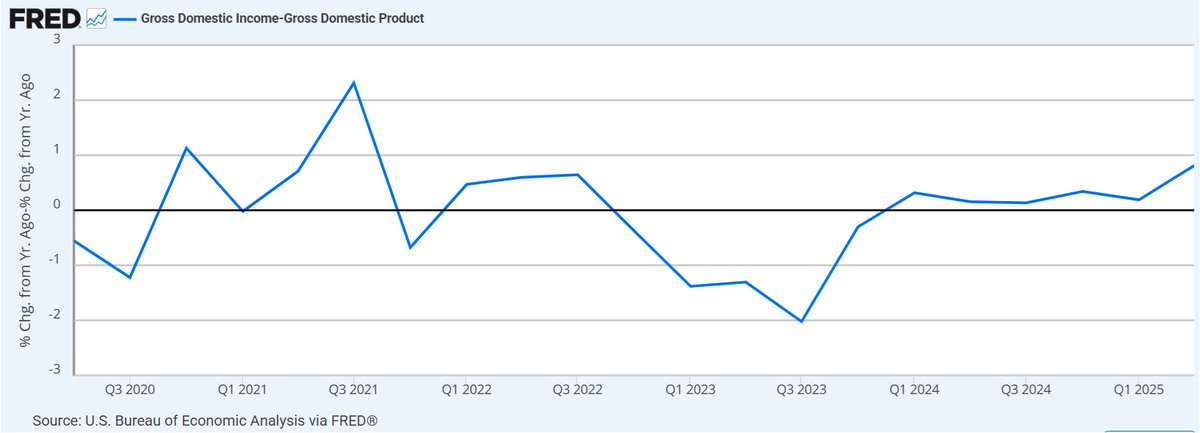
 Image
This is post COVID.

GDI printed 5.34% nominal in Q2.
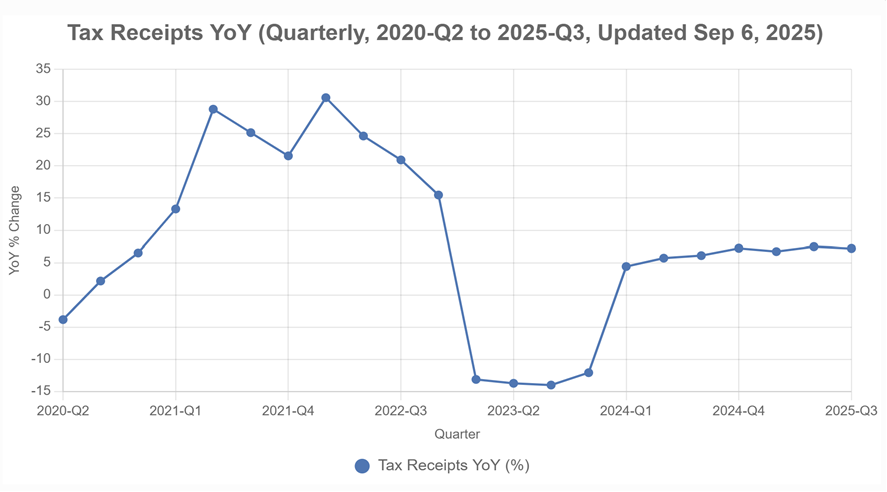
Tax Receipts are 7% YoY.
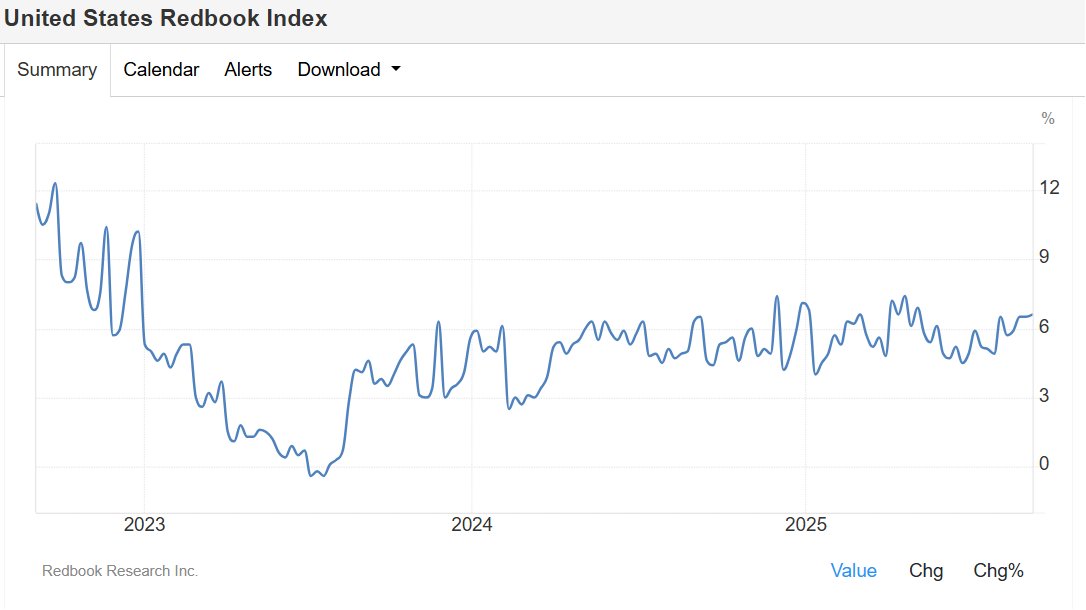
Redbook sales are 6.6% YoY now.

My base case is people are really struggling to digest the collapse in supply side potential for the economy and it's a strange adjustment. Image
Image
Image
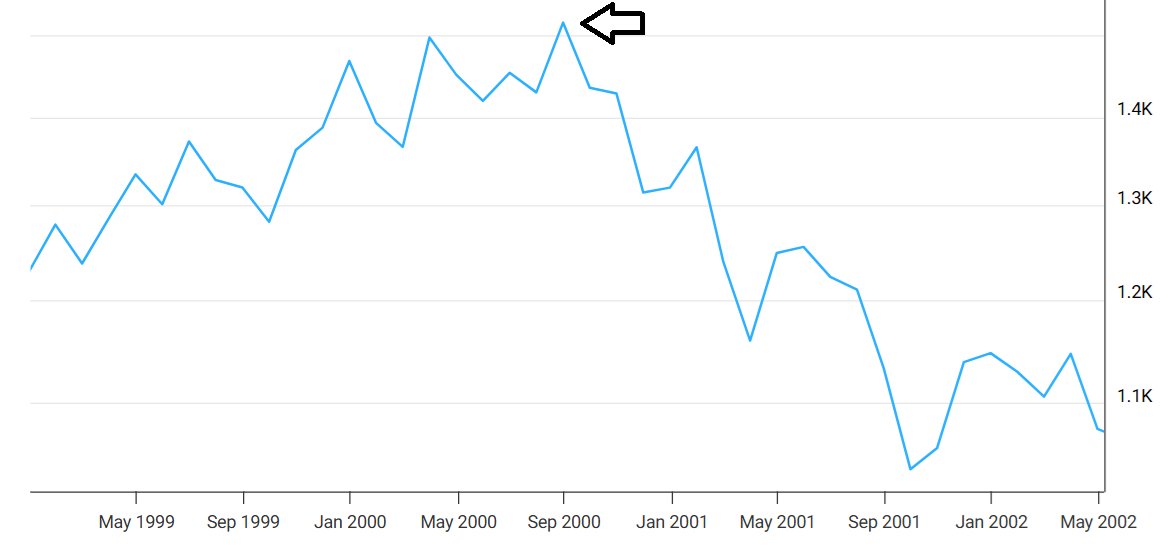
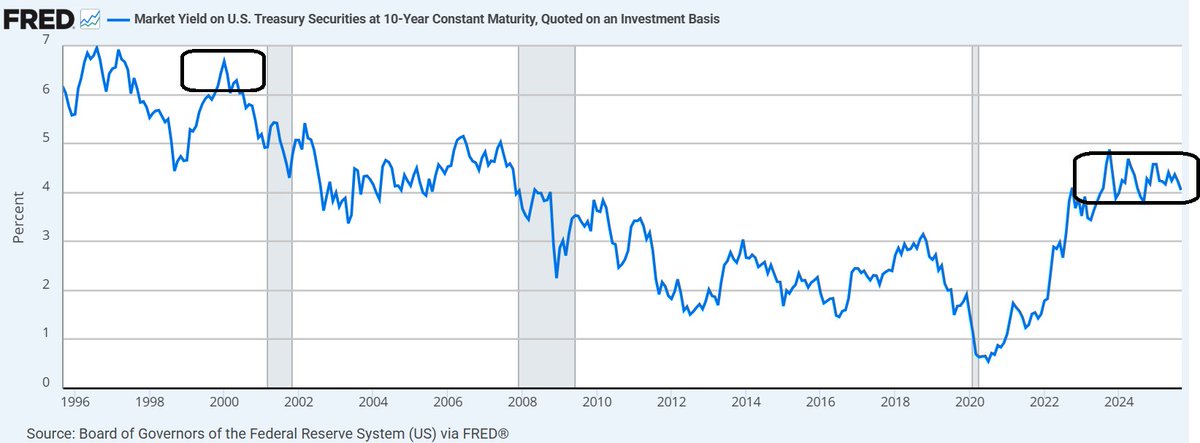
The Bear Case? May 2000.

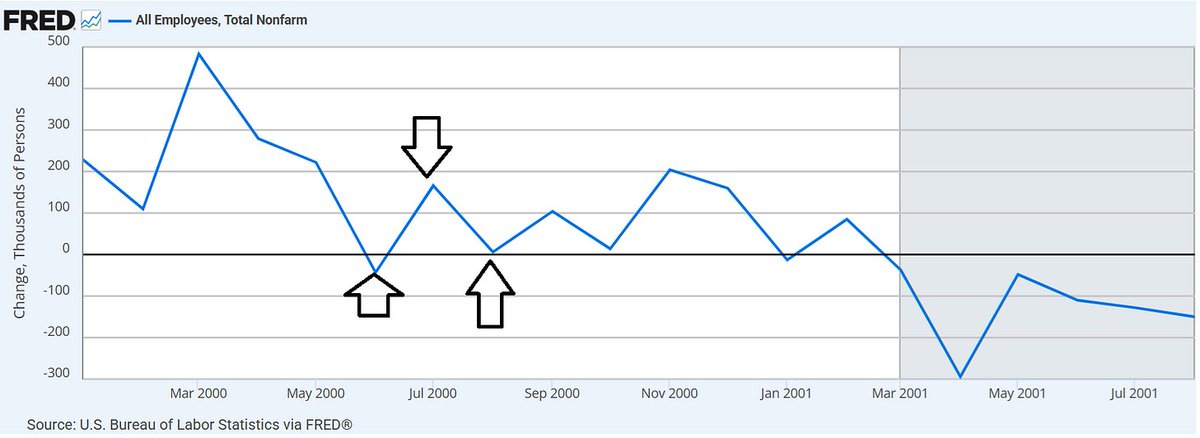
NFP printed 222k, economy on fire! June? -43k. Market shrugged it off. July came in at 166k, all good!

Then by August it became clear labor had stalled and weakened before long.

This started the epic market correction to end that cycle. Image
Image
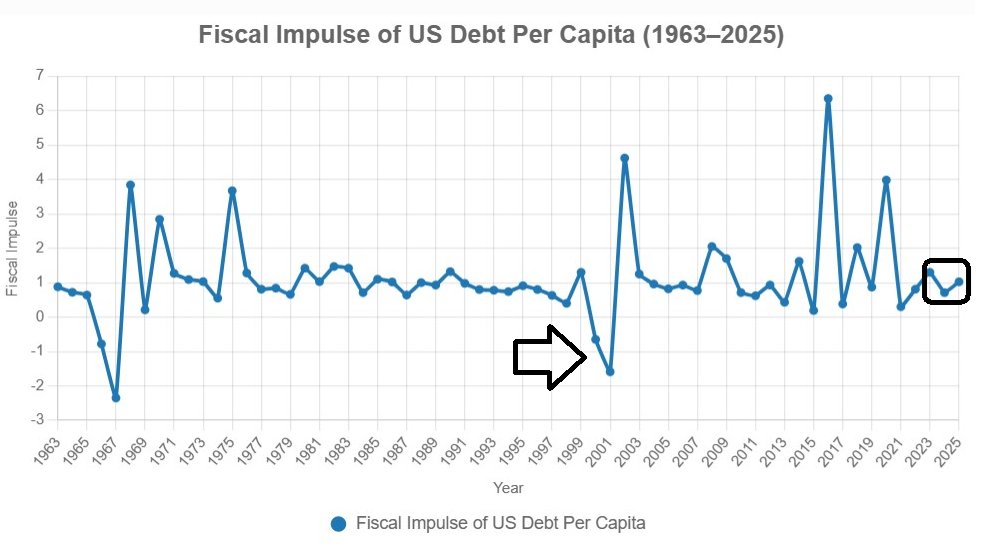
Govt was running a budget surplus, which had a large negative fiscal impulse. Today modest positive, but larger next year.

Fed had hiked 200 bps over prior year, will cut now.
10yr was between 6.5-7%, now 4%.

Choose your scenario wisely! Image
Image

• • •

Missing some Tweet in this thread? You can try to force a refresh
 

Keep Current with Danny Dayan

Danny Dayan Profile picture

Stay in touch and get notified when new unrolls are available from this author!

Read all threads

This Thread may be Removed Anytime!

PDF

Twitter may remove this content at anytime! Save it as PDF for later use!

Try unrolling a thread yourself!

how to unroll video
  1. Follow @ThreadReaderApp to mention us!

  2. From a Twitter thread mention us with a keyword "unroll"
@threadreaderapp unroll

Practice here first or read more on our help page!

More from @DannyDayan5

Jul 25
I have been heavily focused on the impacts financial conditions have on the economy since mid 2022.

I identified The Loop pattern that has transpired and routinely exploited it in my trading. I described The Loop last year in a detailed note.

Image
The dynamics have changed this year. We have policies that are creating impulses on growth and inflation in opposite directions. We have also seen the correlations between assets change regularly.

It is time to refresh the financial conditions framework. Image
Using dynamic models, we have created impulse indices to growth and inflation separately.

Additionally, we have broken down the impulses from each asset class separately, which gives us an edge in understanding which aspects of the economy will be impacted and when.
Read 5 tweets
Jun 10
Financial conditions are extremely loose. Equities are back to the highs, the dollar is weakened substantially, yields are off their highs and credit spreads are very tight.

Let's recap why this is important.
March 2023, the Fed hiked to 5%. The market priced year end 2023 at 3.5%.

July 2023, the Fed hiked to 5.5%. The market priced year end 2024 at 4.1%.

December 2023, Fed held at 5.5%. The market priced year end 2024 at 3.7%.
March 2024, Fed held at 5.5%. The market priced year end 2024 at 4.47%.

June 2024, Fed held at 5.5%. The market priced year end 2024 at 4.8%.

September 2024, Fed cuts to 5%. The market priced year end 2025 at 2.8%.
Read 9 tweets
Mar 18
The Fed had two pathways after 2021:

1) Volcker, by nuking the economy and causing a recession to remove inflationary pressures.

2) Soft Landing. This involves hiking to "restrictive" levels, sitting there for disinflation and then gradually removing restraint.
It's a hard choice to willingly cause unemployment, so I don't blame them for choosing #2. The consequence with soft landing is they didn't get restrictive enough, ignored easing FCI for a material amount of time, which allowed inflation to persist at levels above the target.
This whole time, they expressed confidence that it will get to target over time. The problem with taking a multi-year approach to disinflation is that it leaves you vulnerable to any sort of shock, such as with tariffs and risks inflation expectations getting unanchored
Read 6 tweets
Mar 5
My rough read on things:

Uncertainty remains high in the PMIs, but expected output yr ahead higher. New admin, very new policies has made uncertainty very high, but not in a way that they want to divest from their business. They just want clarity and will wait for it.
Germany/China stimmies are material developments.

Market is interpreting this as end to US exceptionalism. To me, it's more like: End of US being only good economy. Stronger global economy doesn't hurt US, it helps it. FX moves reflect this but also calling bluff on tariffs.
Admin has done a poor job explaining tariff policy, which has led to uncertainty and taken some growth premium out of FX and Rates. Trump did not sound like he wants to back away from tariffs at all last night, so these market moves will make impacts from tariffs worse.
Read 9 tweets
Nov 19, 2024
There is a lot of confusion over the rise in rates of late.

As someone who wrote to clients ahead of the September FOMC's first cut "I am uncomfortably short SOFR Z5 and 10y going into the meeting", which I rode for 110 and 80 bps respectively, let me try and explain.
Since the 50 bps cut, the 10y rate is 80 bps higher.

We can break that down to real yields + breakeven inflation.

The former is up 50 bps, while the latter is up 30 bps.
How do we make sense of these moves?
We actually started getting better data before the meeting but it was too late to move the needle. But then we got data revisions + a much hotter NFP. Thus, the real yields move simply reflects a stronger economy than we all thought.

Read 9 tweets
Sep 25, 2024
Supply shocks are temporary forces on inflation. We have had massive volatility in supply, from the negative supply shocks once the economy re-opened, to a recovery as supply chains adapted, to sharp positive supply shocks in labor and productivity
Sticky inflation is ultimately a function of demand. Real private sales remain quite strong at 2.9% in Q2 and are tracking very strong in Q3.

Remember when we looked at supercore as a proxy for this? We just passed the low seasonal period, and it remains sticky at 4.5%
Image
Image
It seems everyone has forgotten that money creation is the biggest driver of inflation. It exploded 40% by March 22, declined modestly 4% by SVB, then flatlined for a year. Well, it is now increasing sharply since February. In August it rose at a 6% annualized pace.
Image
Image
Read 6 tweets

Did Thread Reader help you today?

Support us! We are indie developers!


This site is made by just two indie developers on a laptop doing marketing, support and development! Read more about the story.

Become a Premium Member ($3/month or $30/year) and get exclusive features!

Become Premium

Don't want to be a Premium member but still want to support us?

Make a small donation by buying us coffee ($5) or help with server cost ($10)

Donate via Paypal

Or Donate anonymously using crypto!

Ethereum

0xfe58350B80634f60Fa6Dc149a72b4DFbc17D341E copy

Bitcoin

3ATGMxNzCUFzxpMCHL5sWSt4DVtS8UqXpi copy

Thank you for your support!

Follow Us!

:(