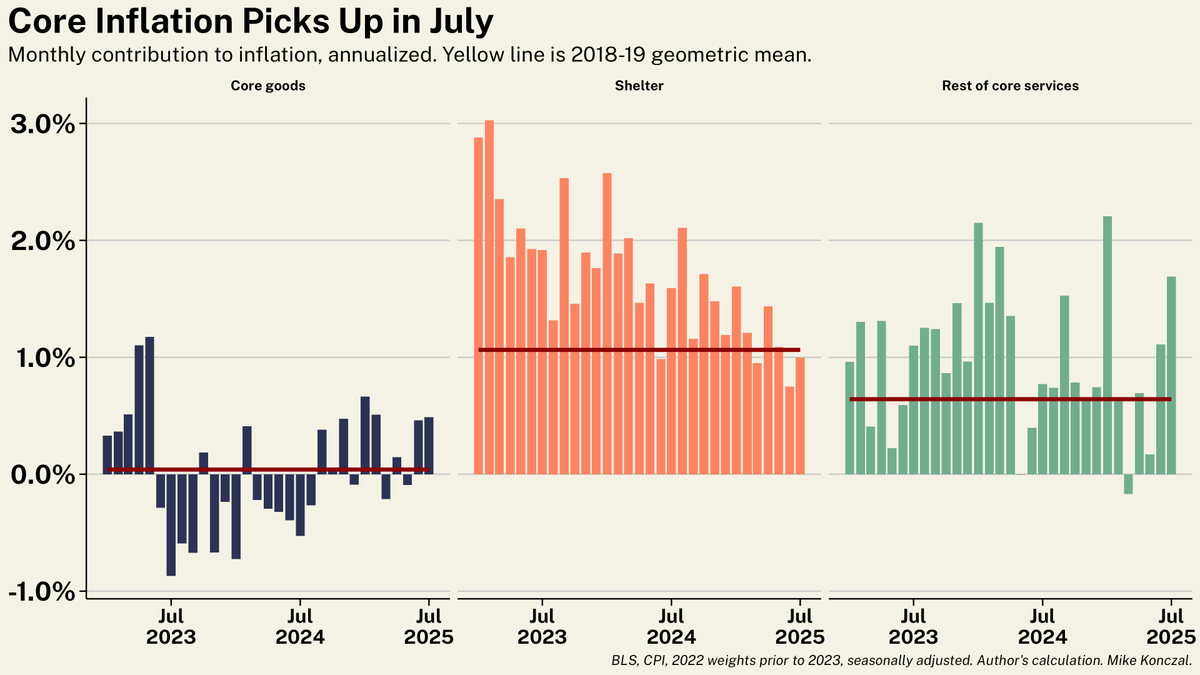
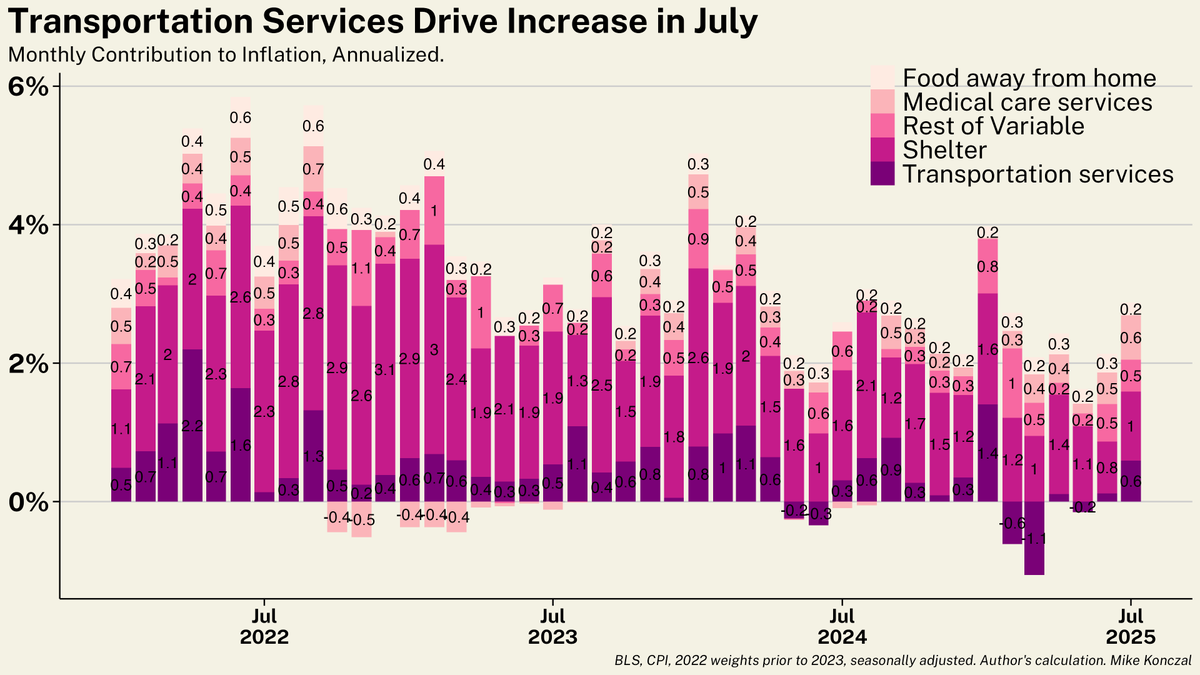
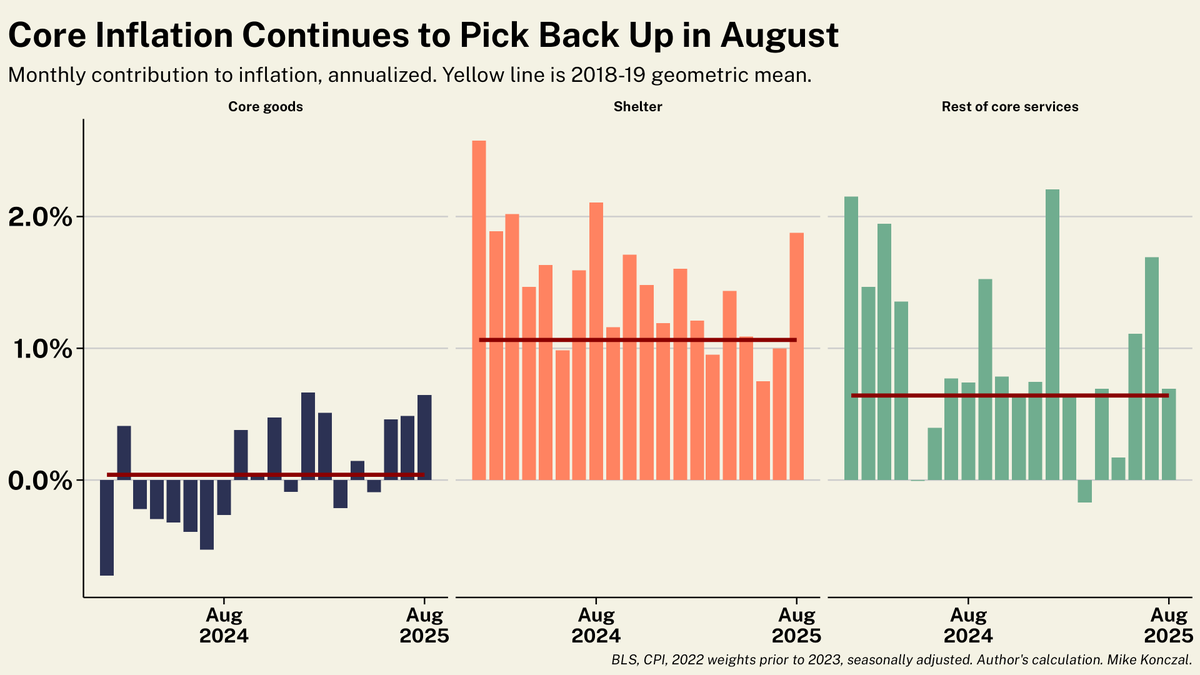
Inflation came in hot. You can see tariffs are driving the price of goods higher, while the price of non-housing services isn't falling to compensate.
Shelter had a high month as well, but that is likely noise given their more general downward trend. The tariffs are here. /1
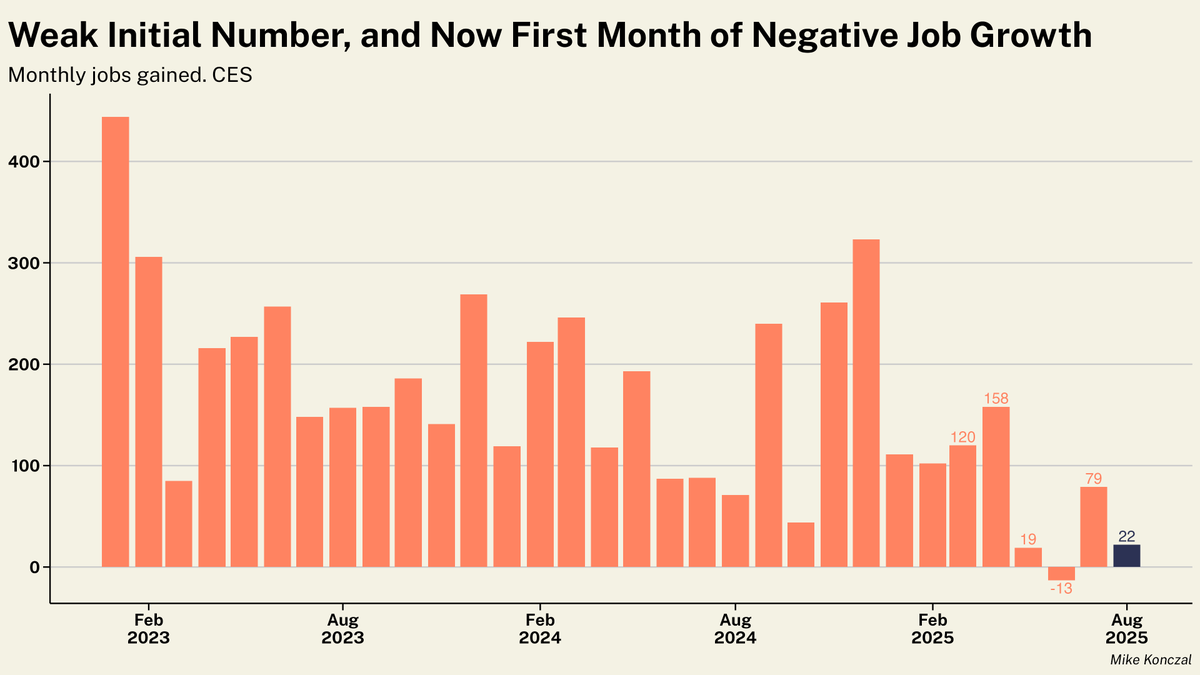
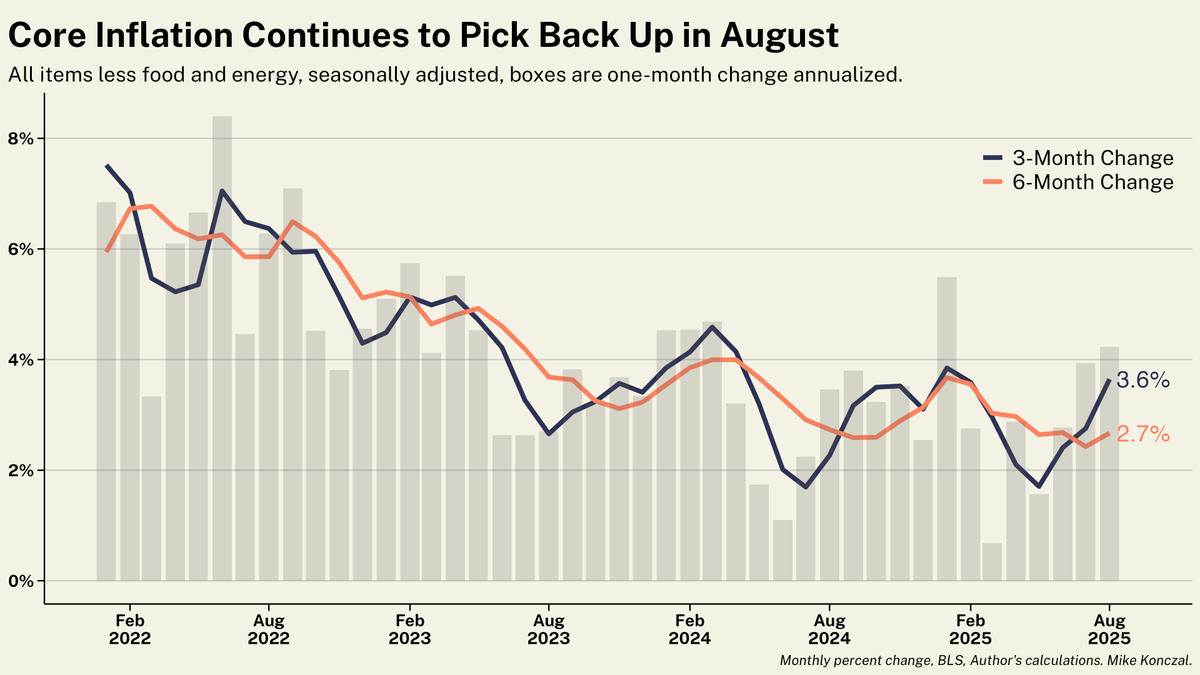
Three-month core inflation pops to 3.6%, among the highest its been in a while (and in years if you exclude January bumps). Not the direction the Federal Reserve wants to see as the labor market is quickly slowing since Liberation Day. /2
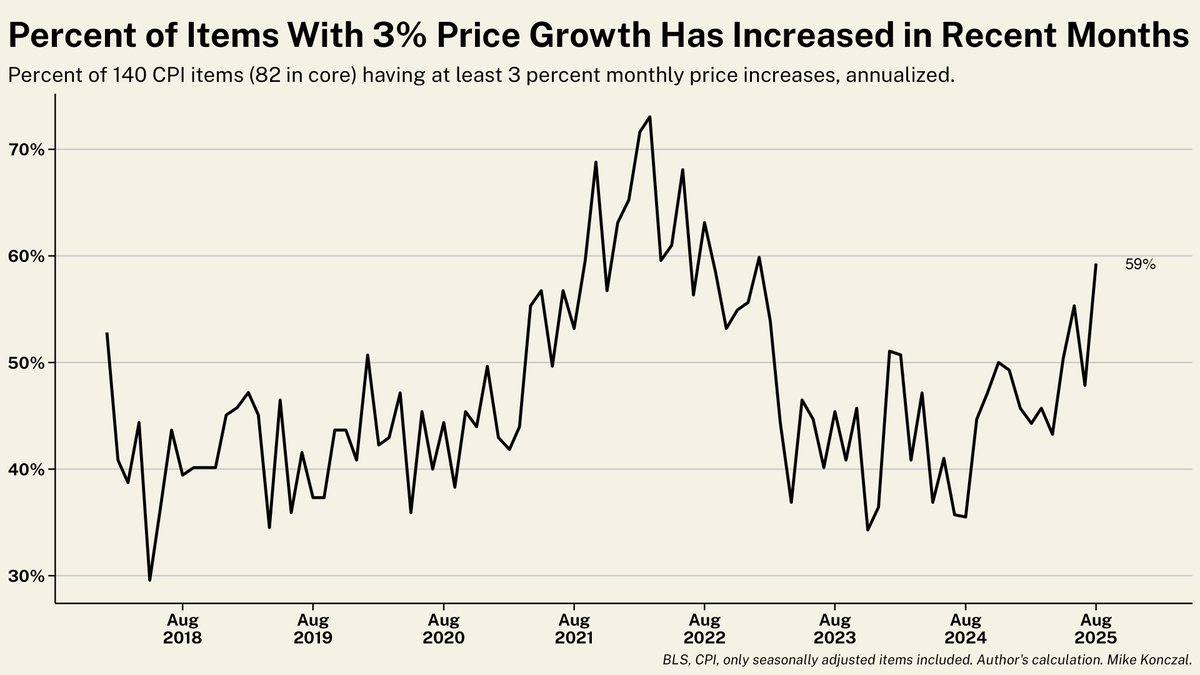
Meanwhile inflation is broadening. Here's percent of items that had at least a 3 percent (annualized) price increase over the last month, something Waller used to flag the 2023 disinflation.
I brushed this off and am surprised at its increase. ~60% for both core and overall. /3
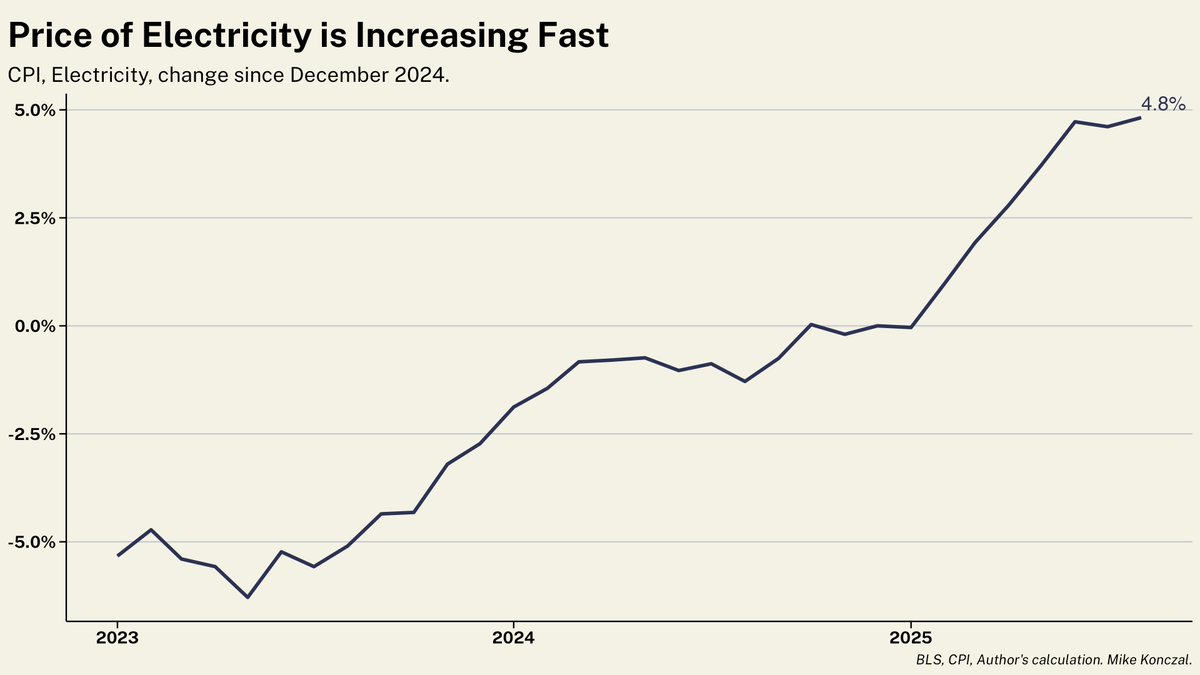
And you aren't imagining it, electricity prices are up ~5% within just this year, a dramatic rise.
/4
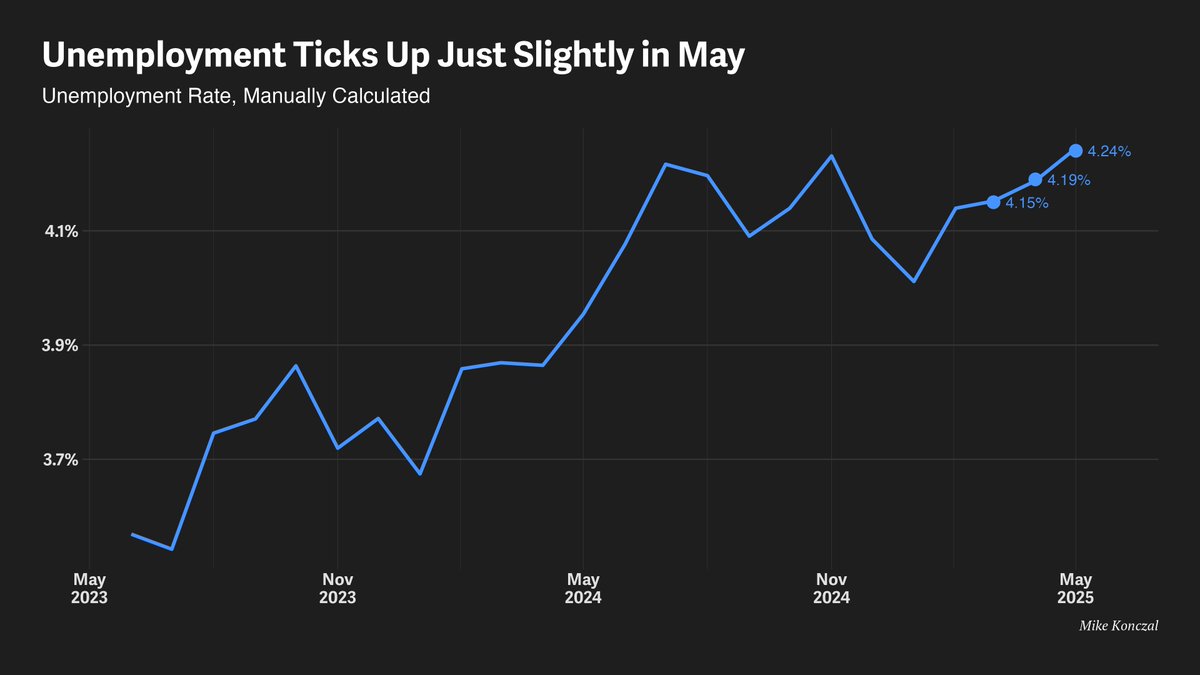
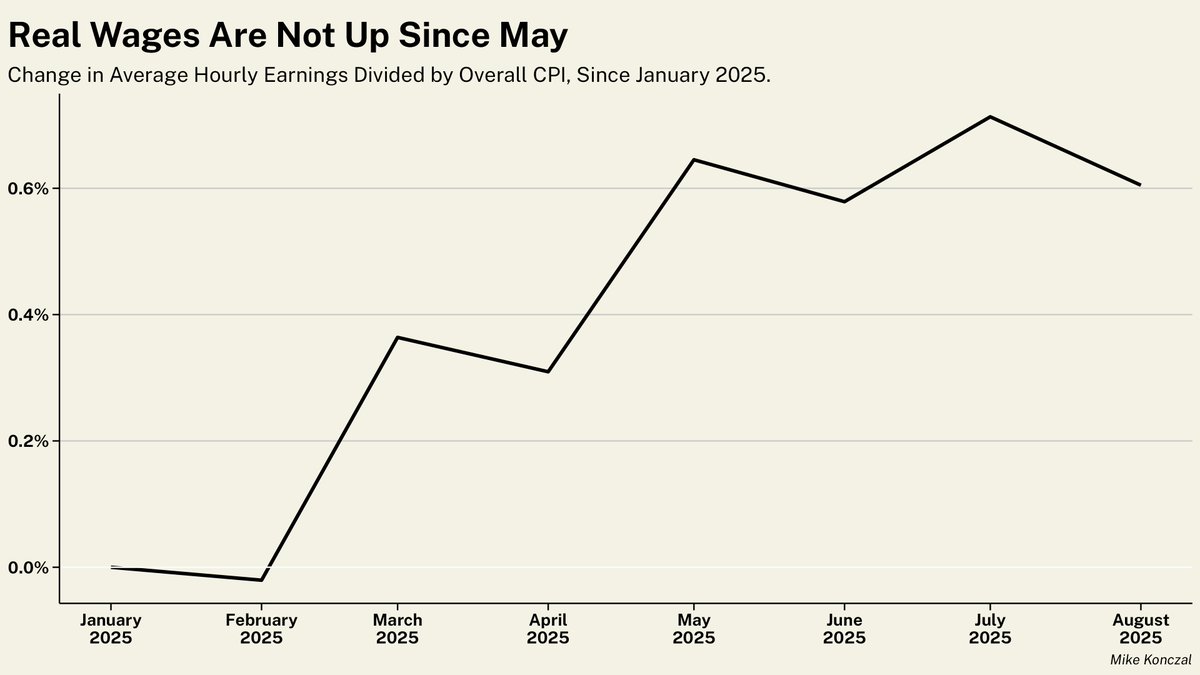
And let the hot takes begin! Real wages are flat since May, once Liberation Day really got started.
Average hourly earnings divided by overall CPI have not grown since May. People aren't making it up, and it's not surprising that consumer sentiment is at very bleak levels. 5/5
• • •
Missing some Tweet in this thread? You can try to
force a refresh
It's a bad number. Just 22,000 jobs, and with revisions June went negative to -13,000.
Worse, deeper into the data you can see that the theory of Trumponomics is failing. It's not too late to change course, but it would require dramatic action they won't take.
Let's dig in. /1
They just narrowly dodged a 4.3% unemployment rate last month and got it this month, but these aren't rounding games. You can see a steady increase over the last two months.
Maybe it's noise, but it is the highest in years and, given everything else we'll see, it's worrying. /2
Here's the breakdown by industry. The first theory of Trumponomics was that tariffs would build up manufacturing work and federal workforce cuts would free up workers for them.
That's failed. Manufacturing lost jobs almost as fast as the federal workforce (-12K vs. -15K). /3
Core inflation was above expectations and had its highest print since January.
But I don't think that really conveys how much more elevated it is in 2025, as shelter disinflation continues to cover up higher services and goods.
This is worrying. Let's dig in: /1
Here's core broken down by goods, shelter, and services. Goods prices are increasing from a negative trend, as expected from tariffs.
But non-housing services have picked up too, masked by the expected measured housing disinflation. /2
If we dig into non-housing services, 'transportation services' is a driver. Much of that is airline prices rebounding after price drops earlier this year.
But some is from 'motor vehicle maintenance and repair', showing the line between tariffs and services is complicated. /3
Job revisions have a well-known strong cyclical component; as the economy slows it is more difficult to estimate business births and deaths.
Here's average revisions as % employment for 18 months before and after a recession, from 1979 to 2025. It's negative in the slowdown. /1
Or consider the last decade. Essentially zero pre-covid.
Sharply negative under lockdowns. But very positive when the economy was gaining millions of jobs back in 2021, as the models couldn't keep up with recovery. But then negative as that recovery leveled out in 2023-2024. /2
Here you can see that with a longer-timeframe. This is very common.
The question right now, as it was in 2023, is whether the revisions indicate slowing into a lower stable steady-state (as it did then), or an actual downward freefall. 3/4
This is a bad jobs report. 73,000 jobs would have been worrisome to begin with, but deeply negative revisions to the previous two-months wiped out much of the recent gains. 2025 looks a lot worse the further we get into it.
There's a lot to cover, let's dig in. /1
First: revisions. Negative revisions naturally occur at the end of recoveries/economic turning points from complexities of estimating business births, deaths, and seasonal adjusts.
While it was negative in early 2024 alongside strong jobs growth, it is collapsing now in 2025. /2
Middle column here is just May and June incorporating the revision, where private education and health services account for 170% of all private sector job growth.
Manufacturing jobs are being lost at a comparable clip to Federal jobs, -11/-12 in July and -13/-18 previously. /3
The GDP numbers for the 2nd quarter, like in the first, are being driven by wild swings in exports and inventories.
While GDP rebounds for a still weak 1.22% in the first half of 2025, under the hood final sales to private domestic purchasers looks quite weak. Let's dig in. /1
You can see this in the components of GDP, where investment (driven by inventories) and net exports are doing wild, probably historically unique, things.
But look at the last two consumptions prints. People are spending less, and it's a notable drag. /2
With 6 months we can compare 1st half of 2025 to the 2nd half of 2024 and note that, across the board, GDP and labor market, 2025 is doing worse.
In 2024 everything looked great except for the unemployment rate; in 2025 everything looks worse except for the unemployment rate. /3
Solid jobs numbers today. Headline unemployment unchanged, and 139,000 new jobs.
But a few things I'd flag for underlying cooling: (1) Last two months revised down -95K. 2-month monthly revisions have averaged -63K in 2025. So reasonable chance this ends up under 100K. /1
The rounding gods were kind this month, with unemployment ticking up to 4.24 percent. You can see the slow increase over the past few months.
At that slow but steady pace you are at ~4.7 percent unemployment at the end of year, consistent with some forecasts on tariff impact. /2
More, the composition gods were very kind this month, with unemployment falling because people aren't leaving their jobs, which helped offset the new entrants who can't find work.
The last 2 recessions were crazy; but weakness leaving unemployment drives smaller recessions. /3