Credit Cycle Set Up For The Dollar and Risk Flows
HOW LONG can the melt up last?
Full breakdown 🧵
HOW LONG can the melt up last?
Full breakdown 🧵

For the last 5 months we have seen a systematic and cross asset move in the flows of capital to buy riskier assets on the far end of the risk.
The flows of capital are systematically constrained to move out the risk curve when macro liquidity rises. This is why investors are forced to buy during melt ups or else they could lose significant purchasing power in real terms if they stay on the sidelines with cash to long.
The flows of capital are systematically constrained to move out the risk curve when macro liquidity rises. This is why investors are forced to buy during melt ups or else they could lose significant purchasing power in real terms if they stay on the sidelines with cash to long.
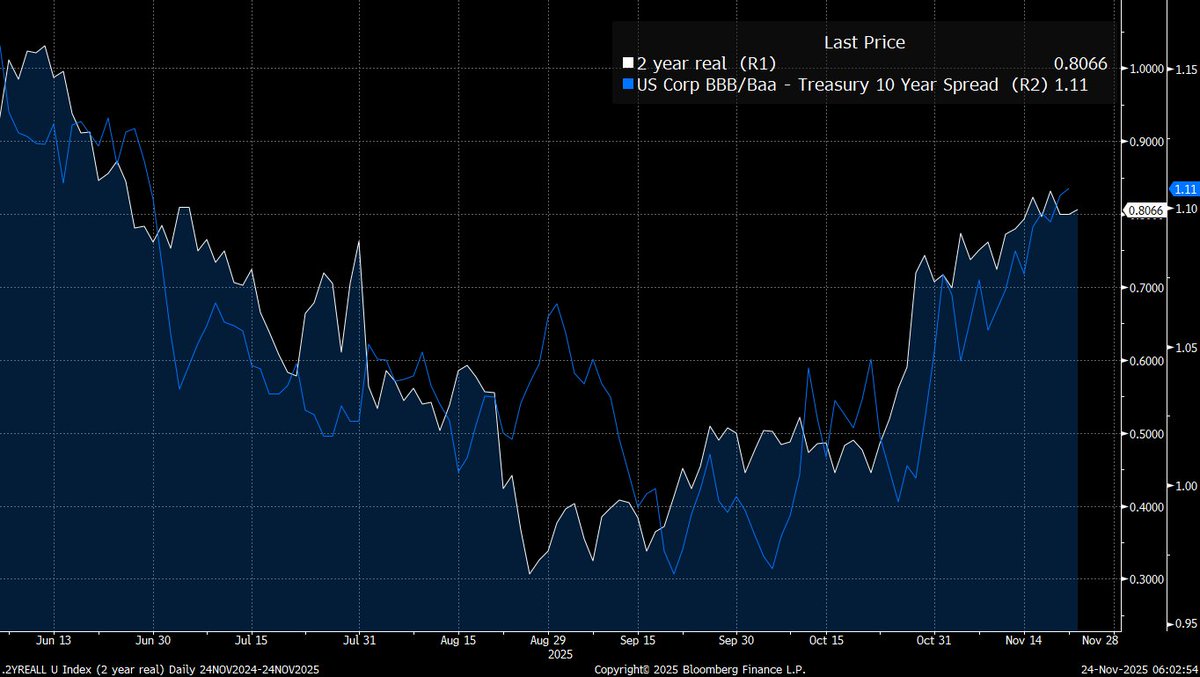
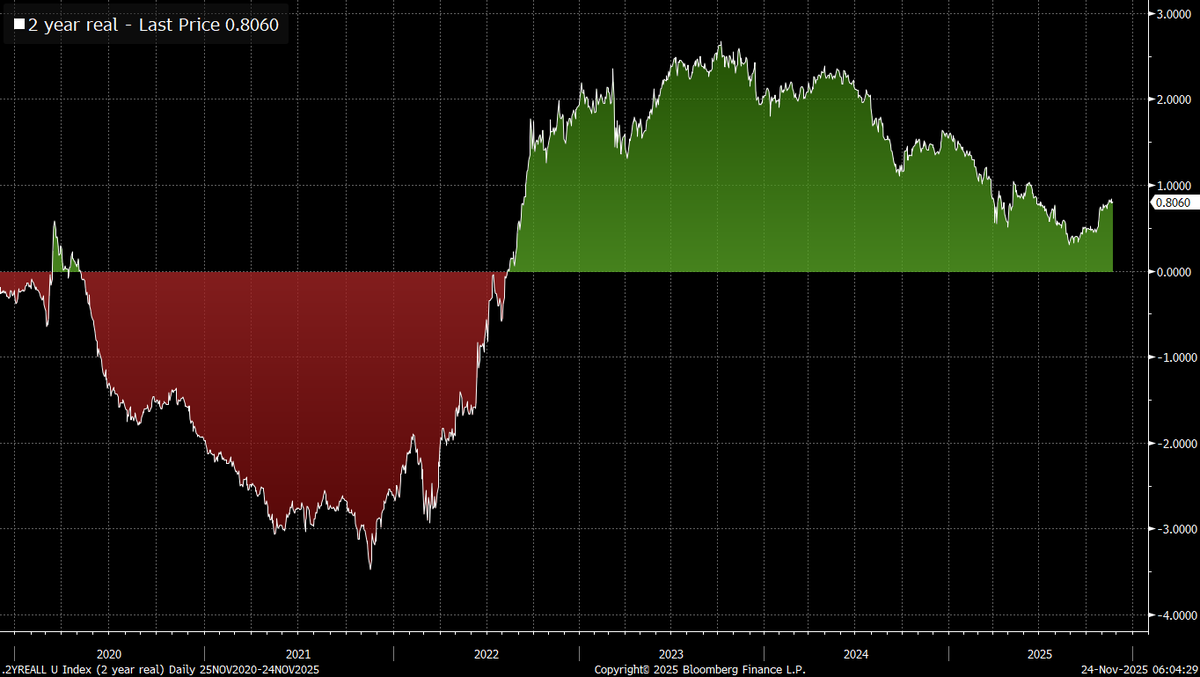
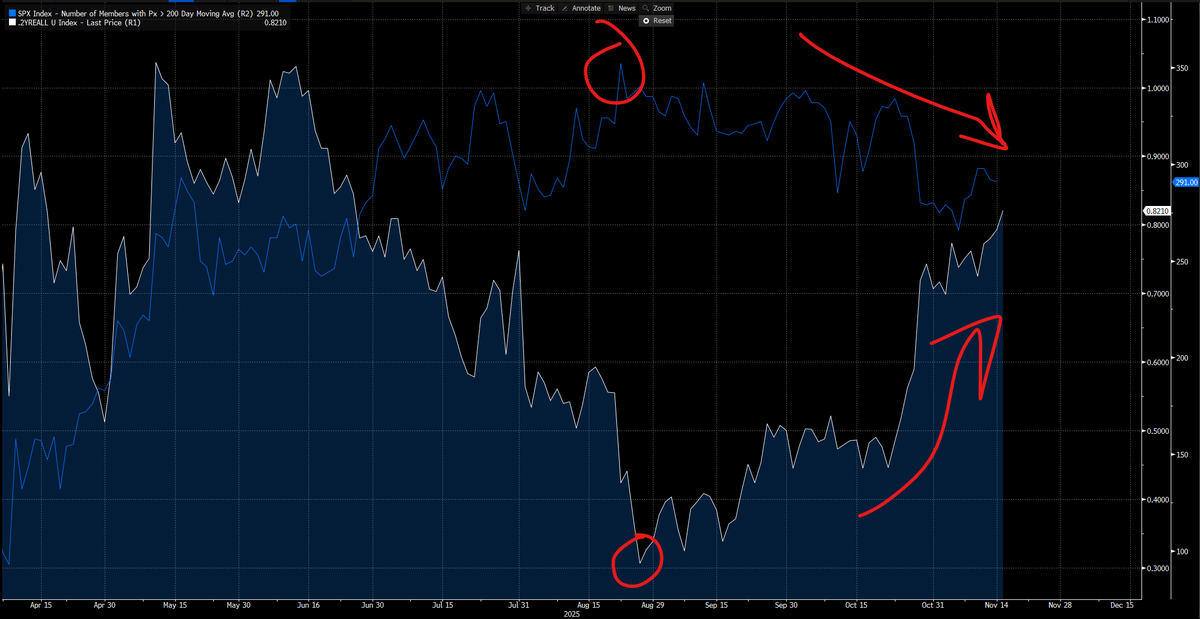
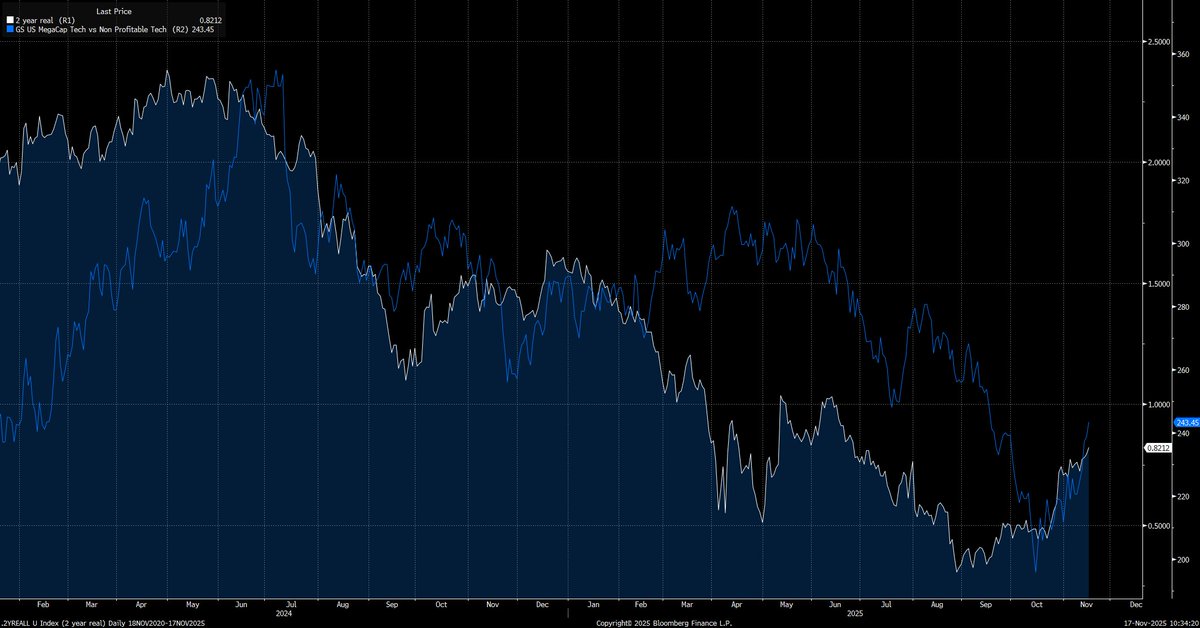
As a result, cash becomes significantly less desirable as real rates fall. Notice that this is WHY we have seen high risk sectors bid as real rates fall.
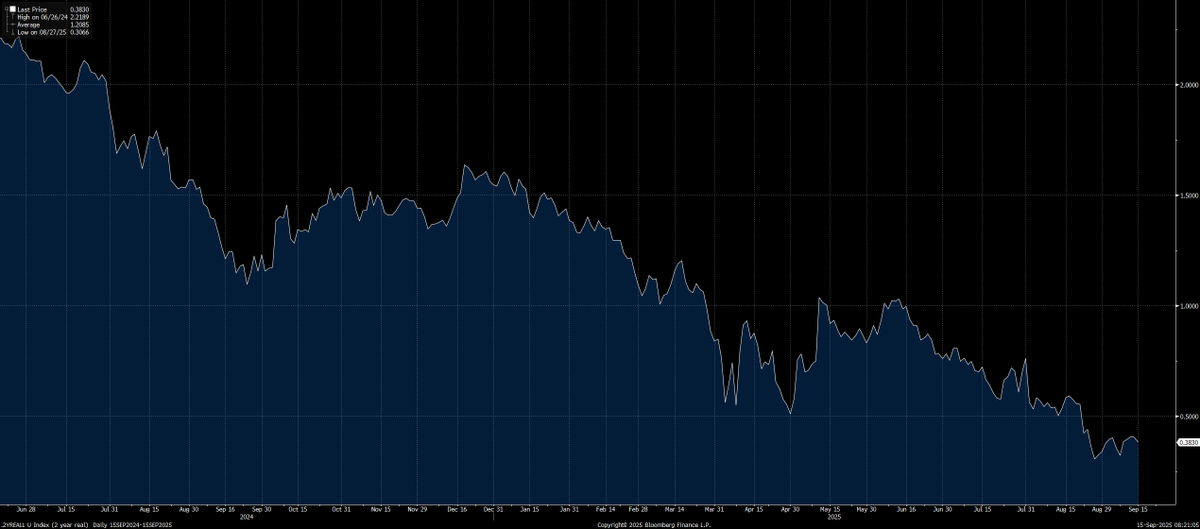
The chart below shows real rates falling since April which means less and LESS of a real return for being on the sidelines.
The chart below shows real rates falling since April which means less and LESS of a real return for being on the sidelines.
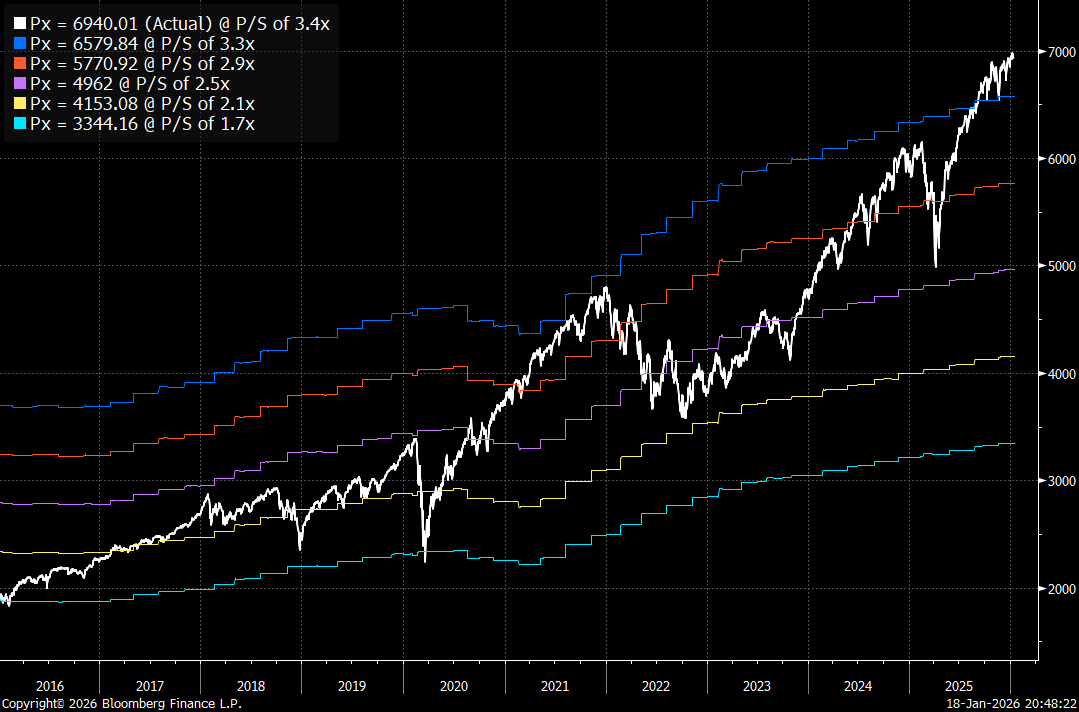
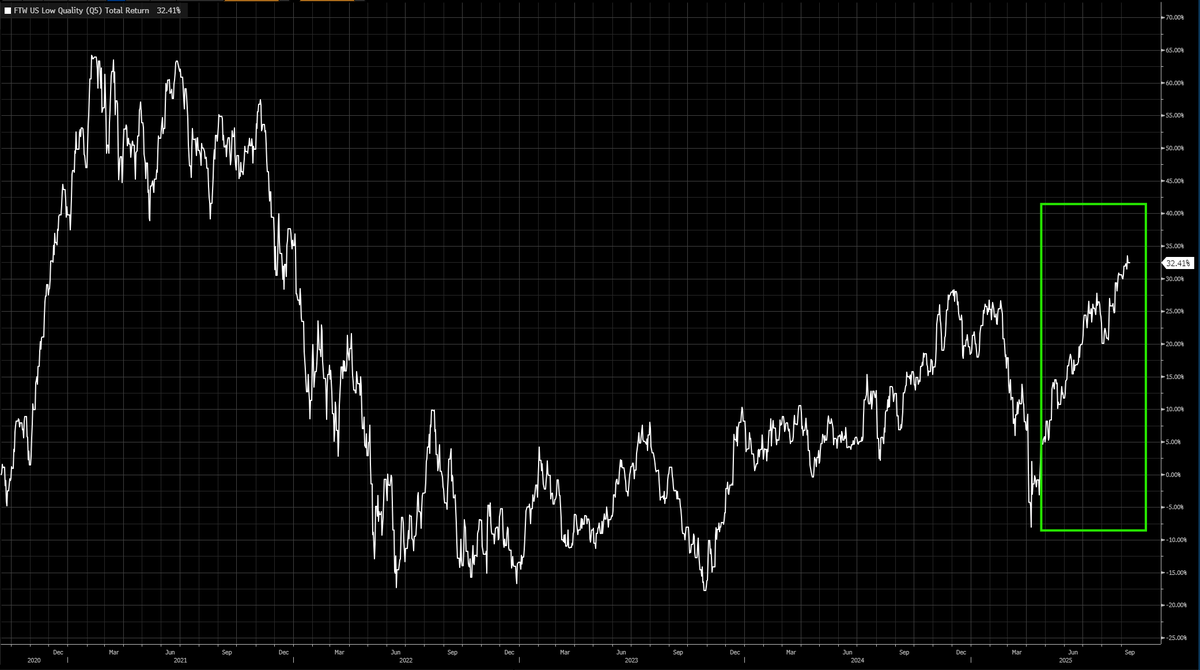
Notice all of the lowest quality stocks in the US have been rallying during this time indicating that there is a surplus of capital in the system.
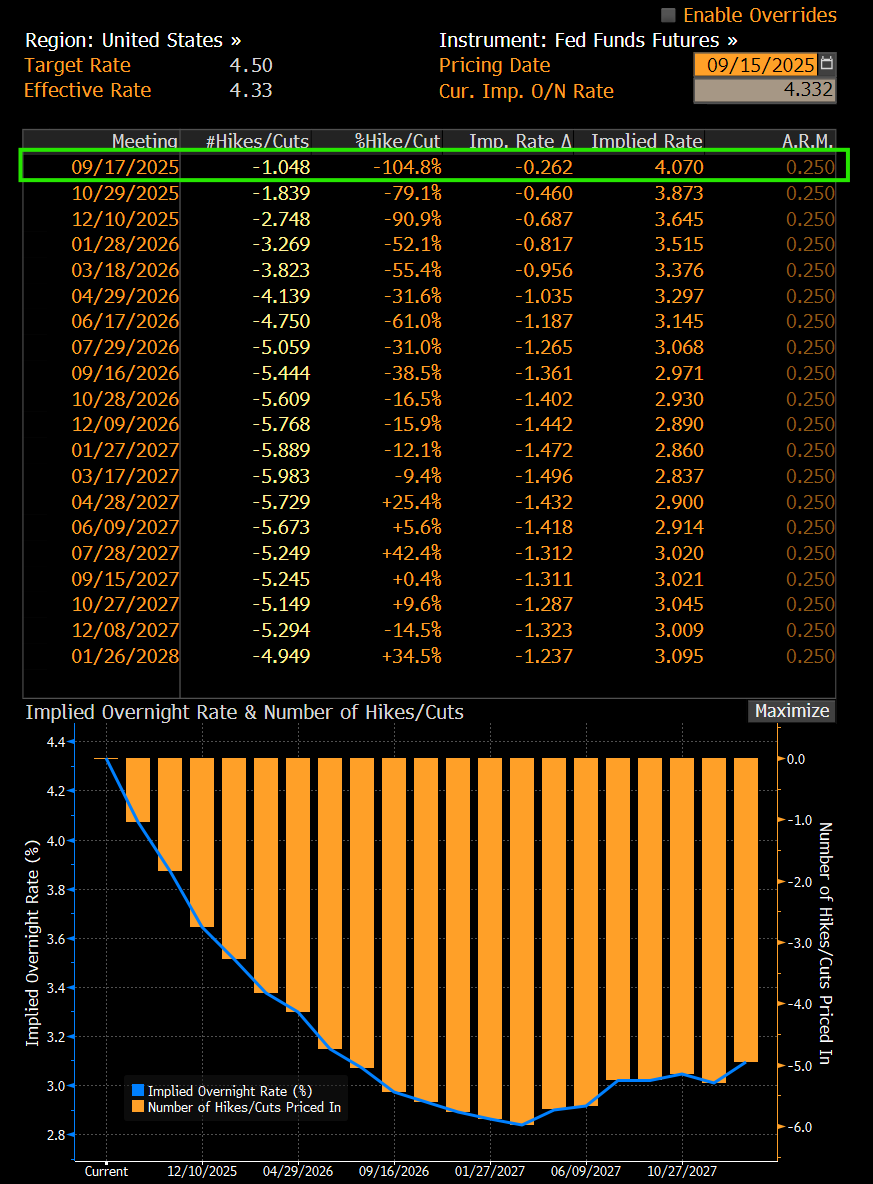
As we move into FOMC, the Fed has shown the market they are beginning to implement cuts again with a very real probability of 75bps total for this year.
All of us know the Fed is cutting by 25bps this week. That is old news. What we are watching for is HOW Powell confirms or pushes back on whats priced in the 2026 part of the curve.
All of us know the Fed is cutting by 25bps this week. That is old news. What we are watching for is HOW Powell confirms or pushes back on whats priced in the 2026 part of the curve.
This is what brings us to the global nature of the flows of capital, liquidity, and risk assets.
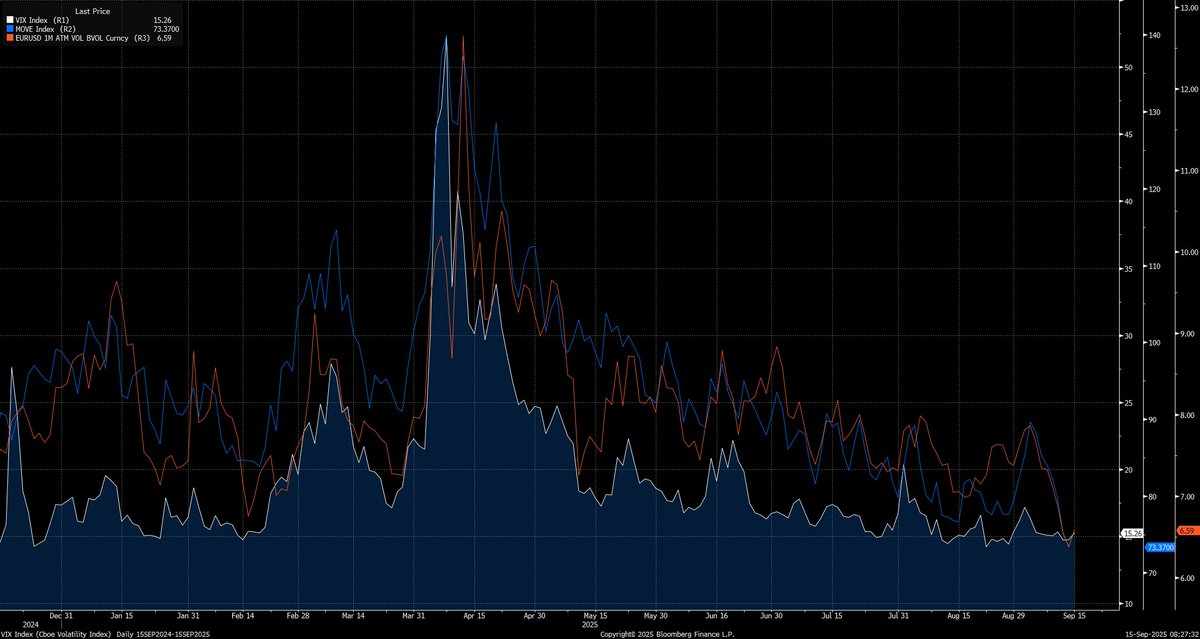
We are seeing cross asset volatility get absolutely crushed across ALL major assets. The VIX, MOVE Index, and EURUSD vol are all moving in lockstep to the downside.
We are seeing cross asset volatility get absolutely crushed across ALL major assets. The VIX, MOVE Index, and EURUSD vol are all moving in lockstep to the downside.
This positioning is directly linked with the capital moving out the risk curve.
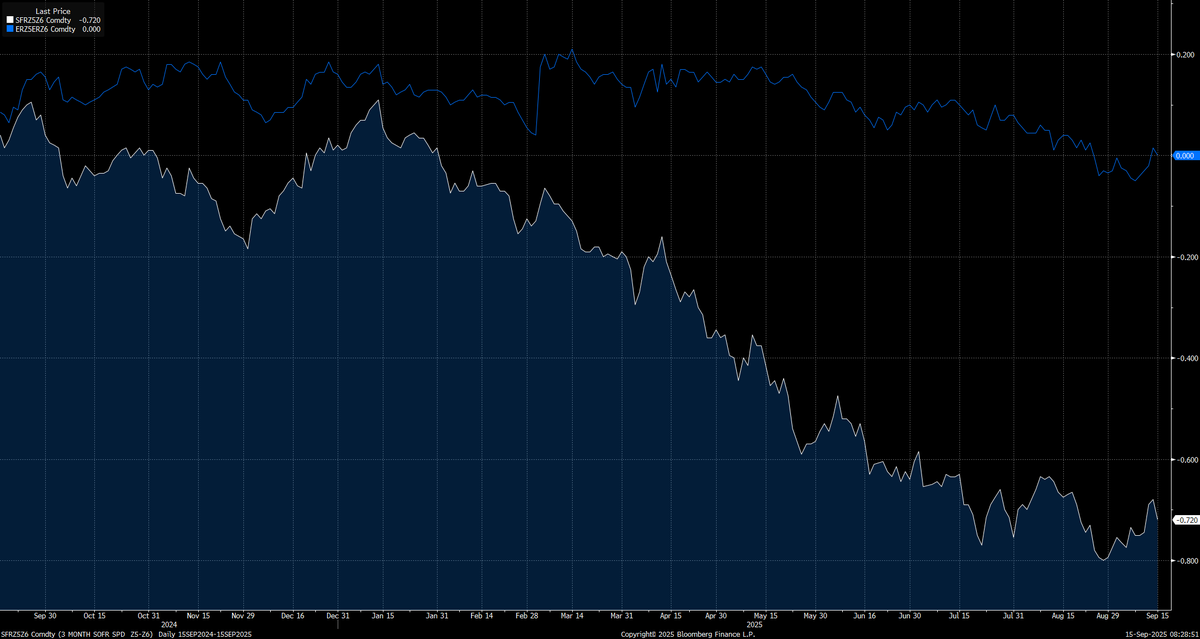
One of the main drivers for this is the divergence taking place between the Fed and ECB. Right now the forward curve is pricing 72bps of cuts in 2026 by the Fed (white line) while its pricing ZERO cuts by the ECB (blue line). In simple terms, the Fed is being more accommodative than the ECB.
One of the main drivers for this is the divergence taking place between the Fed and ECB. Right now the forward curve is pricing 72bps of cuts in 2026 by the Fed (white line) while its pricing ZERO cuts by the ECB (blue line). In simple terms, the Fed is being more accommodative than the ECB.
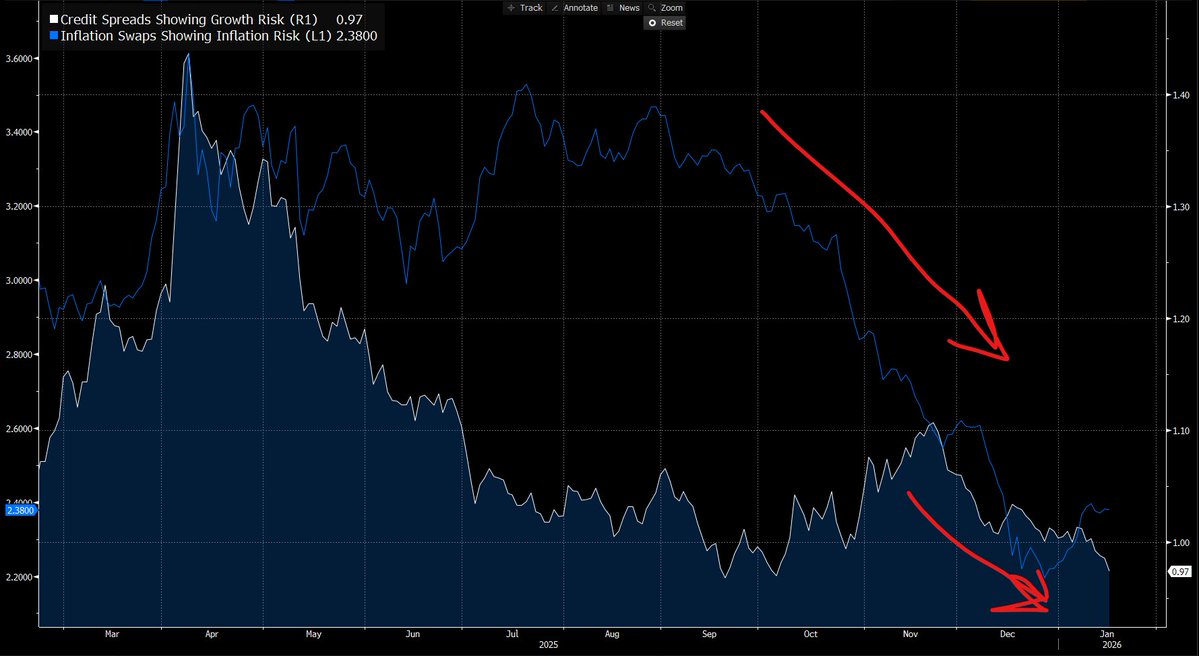
This wouldn't be an issue except that inflation risk is much higher in the US compared to the eurozone. So we have the ECB being more hawkish into less inflation risk whereas the Fed is being more dovish into more inflation risk.
Chart below shows 1 year inflation swaps for US (blue) and Eurozone (white)
Chart below shows 1 year inflation swaps for US (blue) and Eurozone (white)
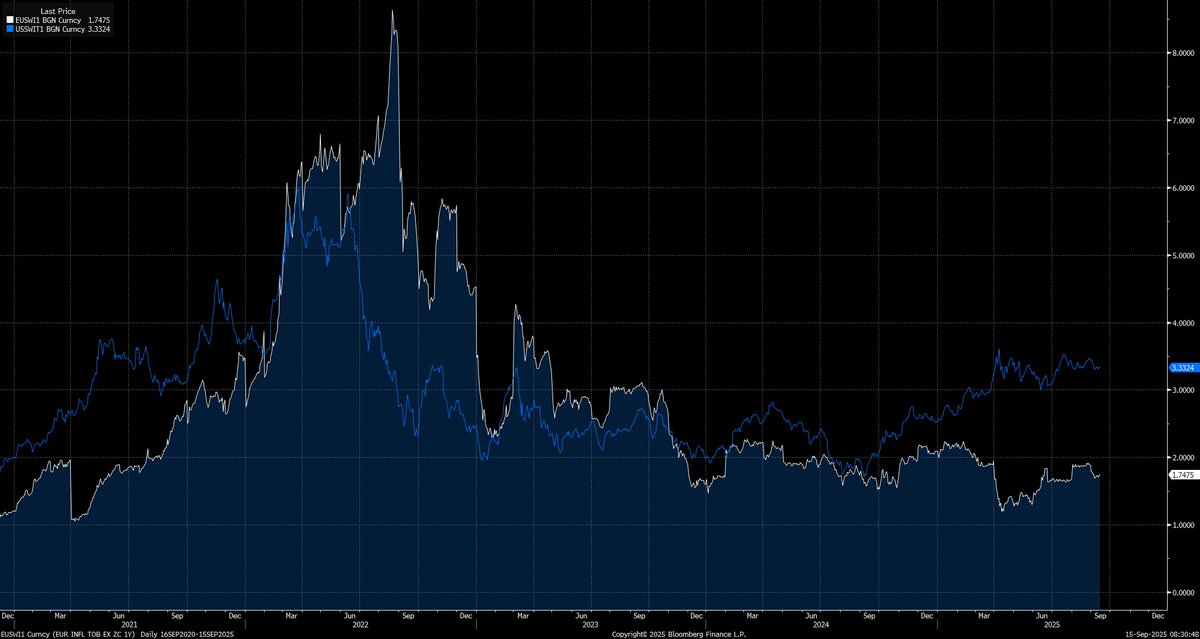
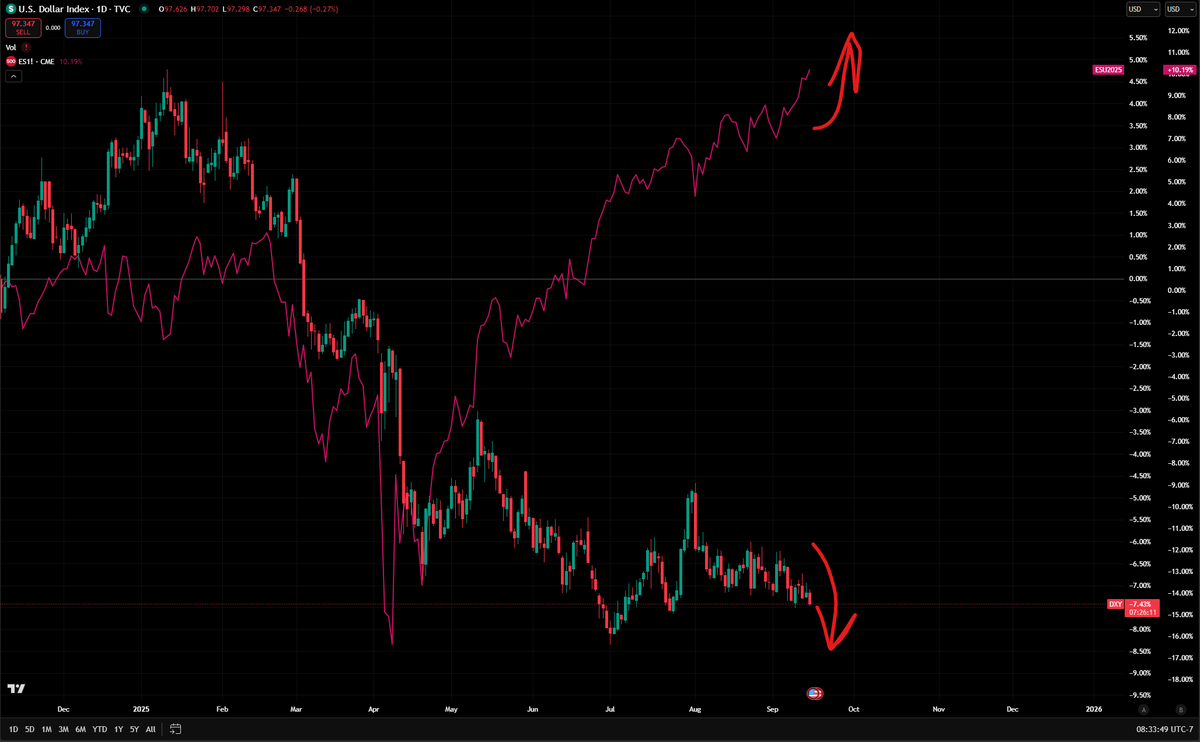
Does it begin to make sense why the dollar has been collapsing all year?
We are now in the process of seeing equities melt up as the dollar falls due to the Fed's stance.
We are now in the process of seeing equities melt up as the dollar falls due to the Fed's stance.
I laid out the tensions and trade implications of this in a full report here if you want to dig into the specific risk reward for running trades:
capitalflowsresearch.com/p/macro-report…
capitalflowsresearch.com/p/macro-report…
The main idea is that we are in the process of seeing capital move out the risk curve on a global basis. This is exactly how the credit cycle works. Equities will continue to rally until long end yields blow out or the carry trade unwinds. Long end yields blowing out is not occuring on an imminent basis but the FX side of things could be a significant risk soon (see report i linked above where I explained this)
There is also a full credit cycle playbook that you can download here (100% free): capitalflowsresearch.com/p/research-syn…
There is also a full credit cycle playbook that you can download here (100% free): capitalflowsresearch.com/p/research-syn…
The credit cycle is still pumping money into the system, which is pushing capital out the risk curve.
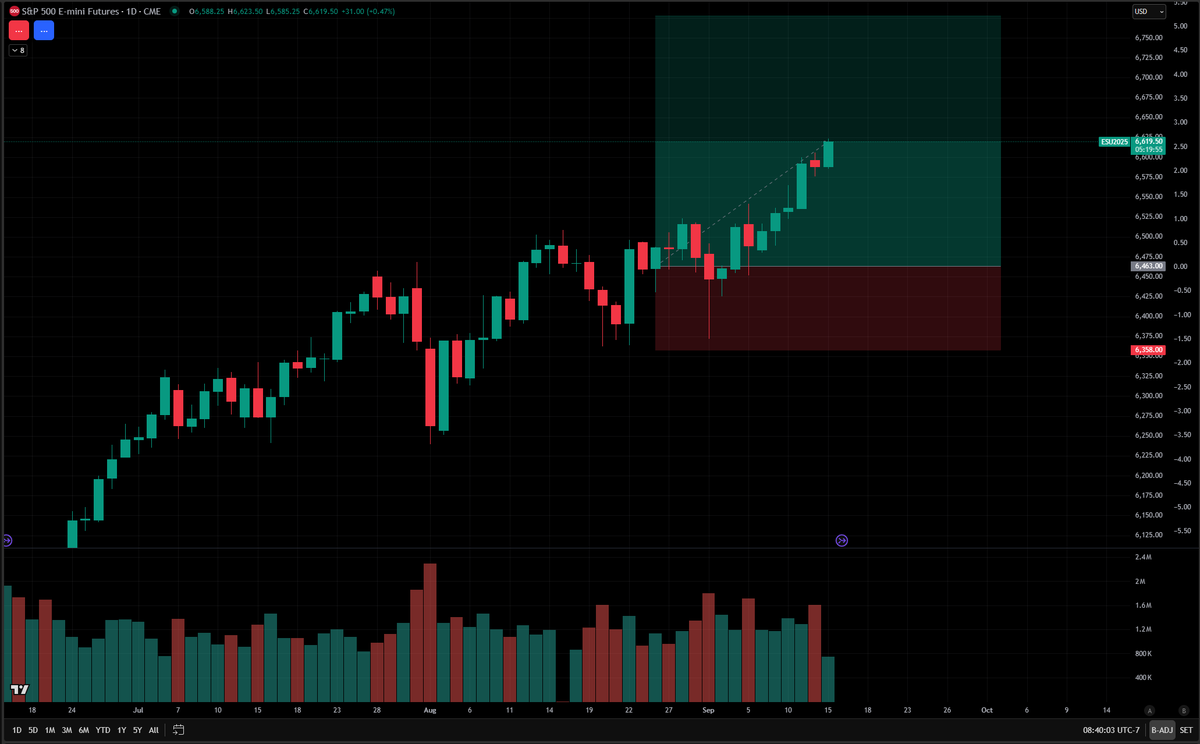
We are still in melt up mode and I am holding the long ES trade I shared
We are still in melt up mode and I am holding the long ES trade I shared
https://x.com/Globalflows/status/1961119060109955178
There are many call option type plays to make bets farther out the risk curve in this environment
I laid out the $HYPD thesis here
I laid out the $HYPD thesis here
https://x.com/Globalflows/status/1965825244947755290
And the most recent new trade I shared is here:
https://x.com/Globalflows/status/1967591496502415574
There will be a moment to exit the train and when my strategy turns neutral and then bearish on equities and Bitcoin, I will publish it on the website:
For now, HIGHER capitalflowsresearch.com
For now, HIGHER capitalflowsresearch.com

• • •
Missing some Tweet in this thread? You can try to
force a refresh