I am extremely grateful for the publication of this result.
Why? Because it means this method has gone mainstream and replications can flourish by using it.
So, here's the first replication, all using the U.K. Biobank. This is for Black-White differences in IQ:
Why? Because it means this method has gone mainstream and replications can flourish by using it.
So, here's the first replication, all using the U.K. Biobank. This is for Black-White differences in IQ:
https://twitter.com/cremieuxrecueil/status/1966156734680150379

Notes!
0. The sample for the population result is *everyone* with ≥1/16 and ≤15/16 African admixture, the within-family result is for the siblings among them. I didn't plot between-families results, but they're pulled from the same distribution as the population result, so when I have those computed I'll replot, but they shouldn't be any different (will take a few hours, maybe be tomorrow, w/e).
1. Yes, datasets will be merged and sharper results will be obtained for the article on this that's coming out ~shortly. Can't be done for all phenotypes in the UKBB, but can be done for IQ at least. For example, we don't have lipoprotein(a) (lp(a)) measurements in some of the samples of young American kids, some of them don't have objective skin color measurements, etc. As a side note, this result holds up with brain size (not shown) in the UKBB, but I'm unsure if it holds up in the young samples that'll be merged with it, as they're still developing in most cases.
Anyway, the IQ p-value is p = 0.008 (two-tailed) within families and extremely low between them. The within-family result is robust, will get sharper with more data, and is also sharpened by using a latent variable instead of a score, and by correcting for measurement error (not needed with the LVM). Score shown for simplicity and ease of others with UKBB access replicating this. Also, accounting for error in the admixture computation, the p-value would drop a bit further, but not by very much since error is very small.
2. The "IQ per unit of admixture" is statistically indistinguishable between the population and within-family results, and yes, it explains most of the Black-White difference in IQ. I just wanted comparably-scaled results for all the traits here, so you're seeing r's. It's pleasant that the within-family variance reductions aren't enormous for siblings, which is what we expect even with quite high heritabilities given their genetic relatedness. It's the same result we've seen with American data, and it's also nice to see that in the case of this trait, the global admixture result *can* be interpreted like the within-family one. Presumably this only holds with measurement invariance, as we see in the U.K. when comparing Whites and Blacks there. Since we see this in the U.S. too, it's likely that the previous, already-published within-family null—which had a sizable effect in the correct direction which also could not be distinguished from the global r—was just a false-negative.
3. This result replicates with other degrees of relatedness, but we might lose the causal interpretation with those ones because the estimand for, say, a cousin test is different given the identity of the "C" variance component shifts for that comparison.
4. What is architectural sparsity and why is it relevant? Consider this table from nature.com/articles/s4159… (cc: @hsu_steve):
Basically, sparsity refers to the number of variants involved in a trait. It also refers to their effect size distribution. So, for Alzheimer's, for example, the trait is highly polygenic, but APOE explains more variance than the entire rest of the PGS, so while being under highly polygenic control, it remains moderately sparse.
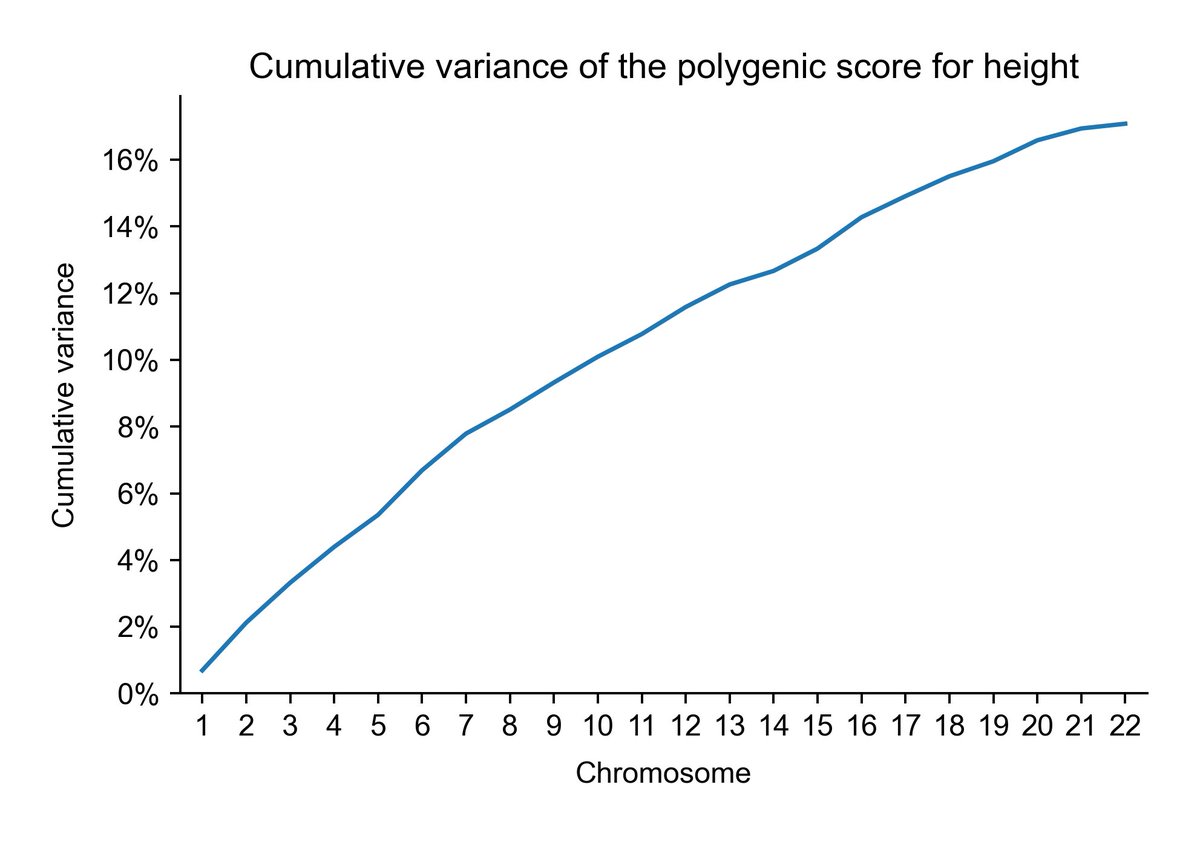
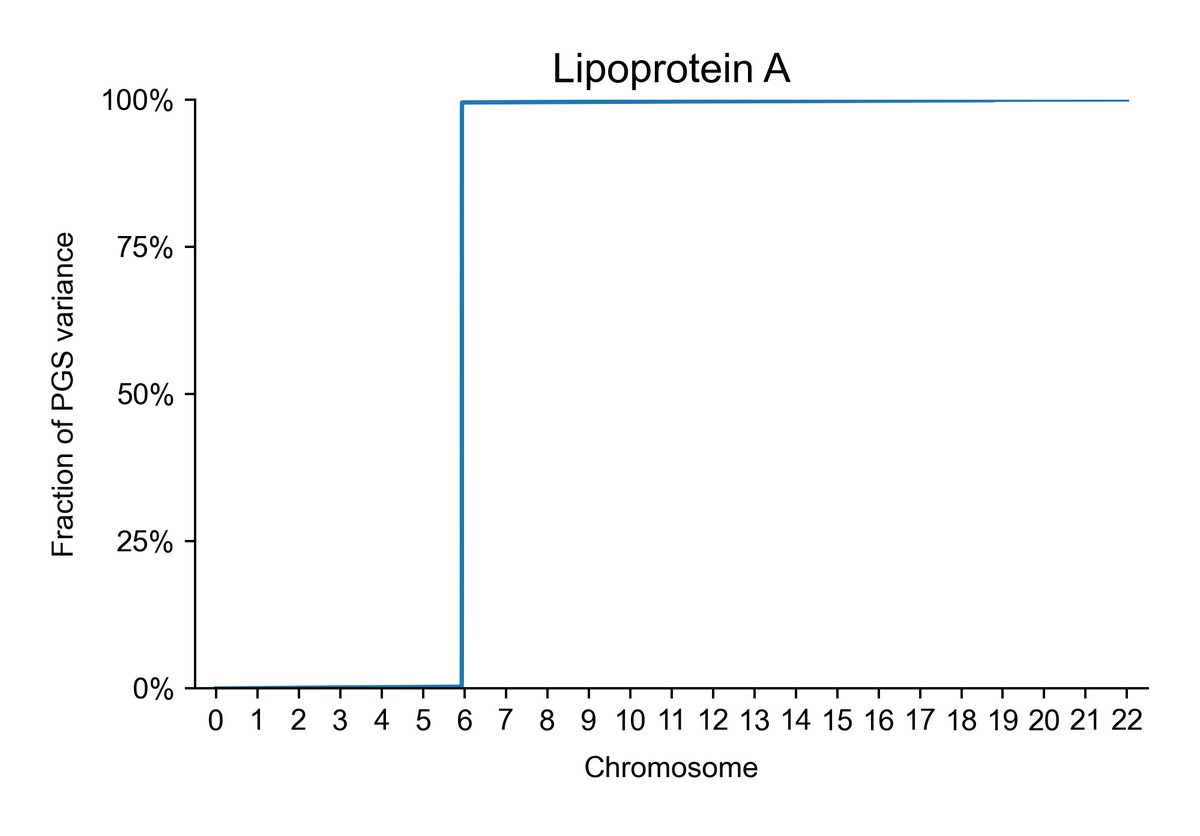
If you're still not grokking what I mean here, consider some distributions of cumulative effects across the chromosomes. Here's the result for lp(a), which is already known to be influenced by essentially one gene. Guess which chromosome it's located on:
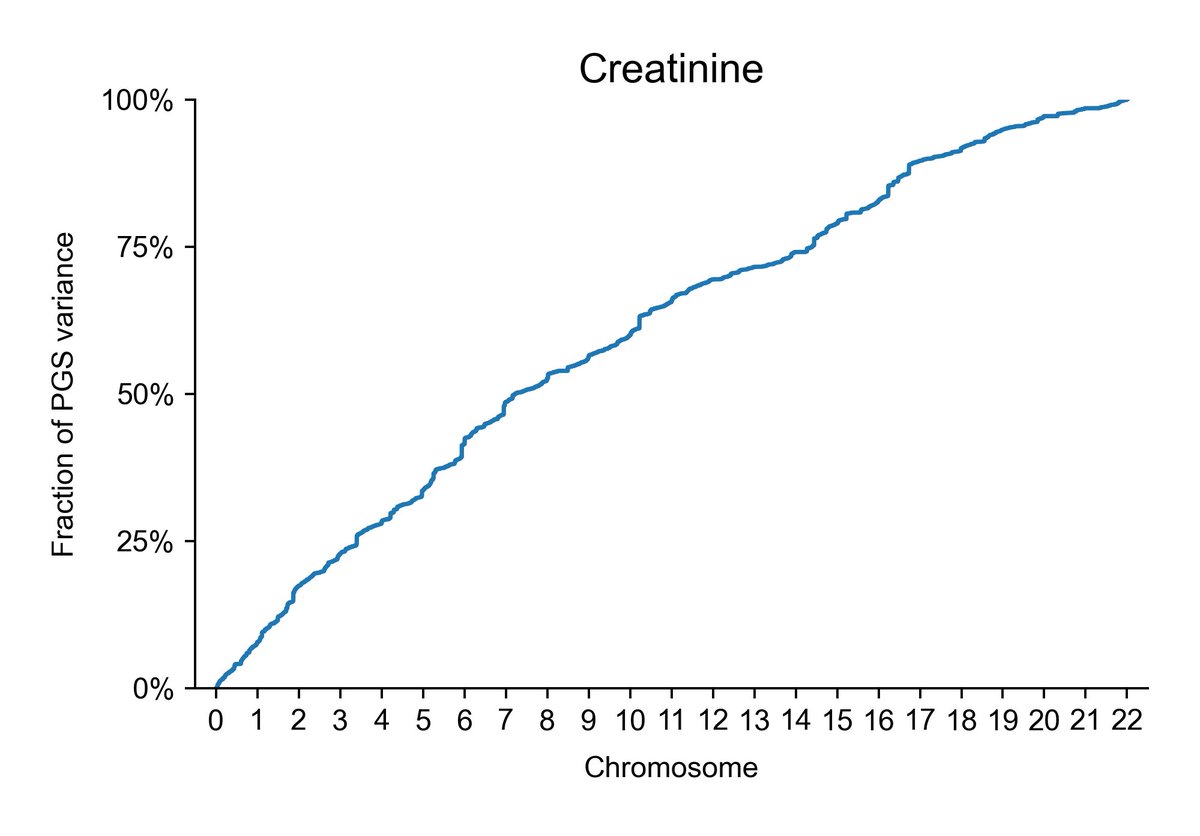
Consider, as a comparison, creatinine, which is considerably less sparse, and thus has effects distributed across all chromosomes:
Now, consider what this does to within-family admixture assessments. Skin color, for example, is controlled by only a handful of genes. This means that global admixture shouldn't tag it very much between siblings. The same is even more true for lp(a). And in fact, now we have confirmation of this!
But, we know from other methods that lp(a) is effectively entirely genetically-caused between populations. This is just accepted within the medical community because it is an obvious fact that follows from its strong control by a single gene. You can also figure this out using local ancestry estimates. Basically, the correlation between genome-wide ancestry and ancestry at a causal loci is what we want to get at, and if you know the causal loci, you gain power by restricting your analysis to that area. This is what we find with lp(a) (not shown, but use your brain. The obviousness of this fact is why the author used lp(a) as an example).
Also, in some sense, the frequency of that locus between ancestries gives you what you need without doing all this within-family stuff, if you're confident it's causal. The effect estimate might still be biased by population structure though, so that's worth keeping in mind.
There will be a post soon with more details and the expanded set of results with the additional datasets, robustness tests, and plenty of other fun things to look at.
TL;DR: this is a spoiler, and it shows that, yes, you can explain the Black-White IQ difference in Britain mostly genetically, and the global admixture result that I've posted here before is equivalent to the within-family one. Woohoo for things that should hold up, in fact, holding up!
As a sort of replication of the Young paper, you cannot explain the difference in educational attainment (as years of education) in this way. Why? Well, hard to say. Compensatory factors like I found with the GCSEs? (Haven't read that post yet? Go check it out here: cremieux.xyz/p/explaining-a…). Poor phenotype quality? Very plausible, because education really is a huge garbage heap, but why would that be in the general population and not within families? Maybe it has to do with what other traits admixture tags? Maybe it does replicate, but we just can't see it, because the precision is too poor (possibly the lp(a) story too). Who knows!
Q: Will the combination with more datasets allow us to fix this educational attainment result?
A: No, because most of the other datasets involve young people, not people who have almost all completed their educations, as in the UKBB. That plus the generational change and international incomparability in the definition of educational attainment makes it too poor as a phenotype. Sorry!
Any questions?
Link to a fun previous post from the same dataset, showing a result that *does* hold up within families: x.com/cremieuxrecuei…
Link to another post mentioning the forthcoming article earlier: x.com/cremieuxrecuei…
0. The sample for the population result is *everyone* with ≥1/16 and ≤15/16 African admixture, the within-family result is for the siblings among them. I didn't plot between-families results, but they're pulled from the same distribution as the population result, so when I have those computed I'll replot, but they shouldn't be any different (will take a few hours, maybe be tomorrow, w/e).
1. Yes, datasets will be merged and sharper results will be obtained for the article on this that's coming out ~shortly. Can't be done for all phenotypes in the UKBB, but can be done for IQ at least. For example, we don't have lipoprotein(a) (lp(a)) measurements in some of the samples of young American kids, some of them don't have objective skin color measurements, etc. As a side note, this result holds up with brain size (not shown) in the UKBB, but I'm unsure if it holds up in the young samples that'll be merged with it, as they're still developing in most cases.
Anyway, the IQ p-value is p = 0.008 (two-tailed) within families and extremely low between them. The within-family result is robust, will get sharper with more data, and is also sharpened by using a latent variable instead of a score, and by correcting for measurement error (not needed with the LVM). Score shown for simplicity and ease of others with UKBB access replicating this. Also, accounting for error in the admixture computation, the p-value would drop a bit further, but not by very much since error is very small.
2. The "IQ per unit of admixture" is statistically indistinguishable between the population and within-family results, and yes, it explains most of the Black-White difference in IQ. I just wanted comparably-scaled results for all the traits here, so you're seeing r's. It's pleasant that the within-family variance reductions aren't enormous for siblings, which is what we expect even with quite high heritabilities given their genetic relatedness. It's the same result we've seen with American data, and it's also nice to see that in the case of this trait, the global admixture result *can* be interpreted like the within-family one. Presumably this only holds with measurement invariance, as we see in the U.K. when comparing Whites and Blacks there. Since we see this in the U.S. too, it's likely that the previous, already-published within-family null—which had a sizable effect in the correct direction which also could not be distinguished from the global r—was just a false-negative.
3. This result replicates with other degrees of relatedness, but we might lose the causal interpretation with those ones because the estimand for, say, a cousin test is different given the identity of the "C" variance component shifts for that comparison.
4. What is architectural sparsity and why is it relevant? Consider this table from nature.com/articles/s4159… (cc: @hsu_steve):
Basically, sparsity refers to the number of variants involved in a trait. It also refers to their effect size distribution. So, for Alzheimer's, for example, the trait is highly polygenic, but APOE explains more variance than the entire rest of the PGS, so while being under highly polygenic control, it remains moderately sparse.
If you're still not grokking what I mean here, consider some distributions of cumulative effects across the chromosomes. Here's the result for lp(a), which is already known to be influenced by essentially one gene. Guess which chromosome it's located on:
Consider, as a comparison, creatinine, which is considerably less sparse, and thus has effects distributed across all chromosomes:
Now, consider what this does to within-family admixture assessments. Skin color, for example, is controlled by only a handful of genes. This means that global admixture shouldn't tag it very much between siblings. The same is even more true for lp(a). And in fact, now we have confirmation of this!
But, we know from other methods that lp(a) is effectively entirely genetically-caused between populations. This is just accepted within the medical community because it is an obvious fact that follows from its strong control by a single gene. You can also figure this out using local ancestry estimates. Basically, the correlation between genome-wide ancestry and ancestry at a causal loci is what we want to get at, and if you know the causal loci, you gain power by restricting your analysis to that area. This is what we find with lp(a) (not shown, but use your brain. The obviousness of this fact is why the author used lp(a) as an example).
Also, in some sense, the frequency of that locus between ancestries gives you what you need without doing all this within-family stuff, if you're confident it's causal. The effect estimate might still be biased by population structure though, so that's worth keeping in mind.
There will be a post soon with more details and the expanded set of results with the additional datasets, robustness tests, and plenty of other fun things to look at.
TL;DR: this is a spoiler, and it shows that, yes, you can explain the Black-White IQ difference in Britain mostly genetically, and the global admixture result that I've posted here before is equivalent to the within-family one. Woohoo for things that should hold up, in fact, holding up!
As a sort of replication of the Young paper, you cannot explain the difference in educational attainment (as years of education) in this way. Why? Well, hard to say. Compensatory factors like I found with the GCSEs? (Haven't read that post yet? Go check it out here: cremieux.xyz/p/explaining-a…). Poor phenotype quality? Very plausible, because education really is a huge garbage heap, but why would that be in the general population and not within families? Maybe it has to do with what other traits admixture tags? Maybe it does replicate, but we just can't see it, because the precision is too poor (possibly the lp(a) story too). Who knows!
Q: Will the combination with more datasets allow us to fix this educational attainment result?
A: No, because most of the other datasets involve young people, not people who have almost all completed their educations, as in the UKBB. That plus the generational change and international incomparability in the definition of educational attainment makes it too poor as a phenotype. Sorry!
Any questions?
Link to a fun previous post from the same dataset, showing a result that *does* hold up within families: x.com/cremieuxrecuei…
Link to another post mentioning the forthcoming article earlier: x.com/cremieuxrecuei…


I want to ping an old post that I've also posted some replications for.
Basically, parents are inequality averse, and they try to compensate for when one sibling is less gifted than another, reducing the ancestry/PGS effect on education within families.
Basically, parents are inequality averse, and they try to compensate for when one sibling is less gifted than another, reducing the ancestry/PGS effect on education within families.
https://x.com/cremieuxrecueil/status/1782834242122125491
To overcome this and see if the direct genetic effect of ancestry/a PGS on EA is similar to the population effect, you would need siblings adopted apart or, potentially, dizygotic twins (i.e., same-age full-sibs).
Simple wording explainer, in case you guys need it:
https://x.com/cremieuxrecueil/status/1967752858251469117
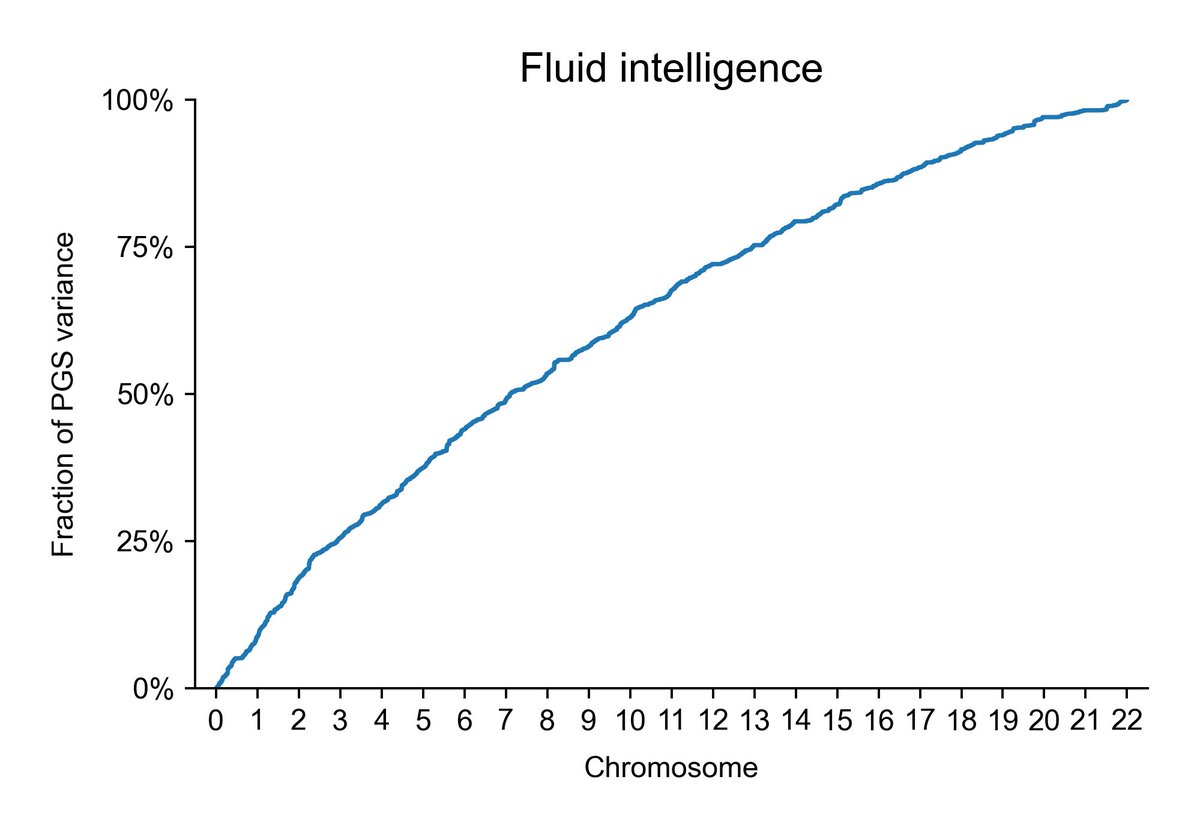
Also, here are sparsity plots for...
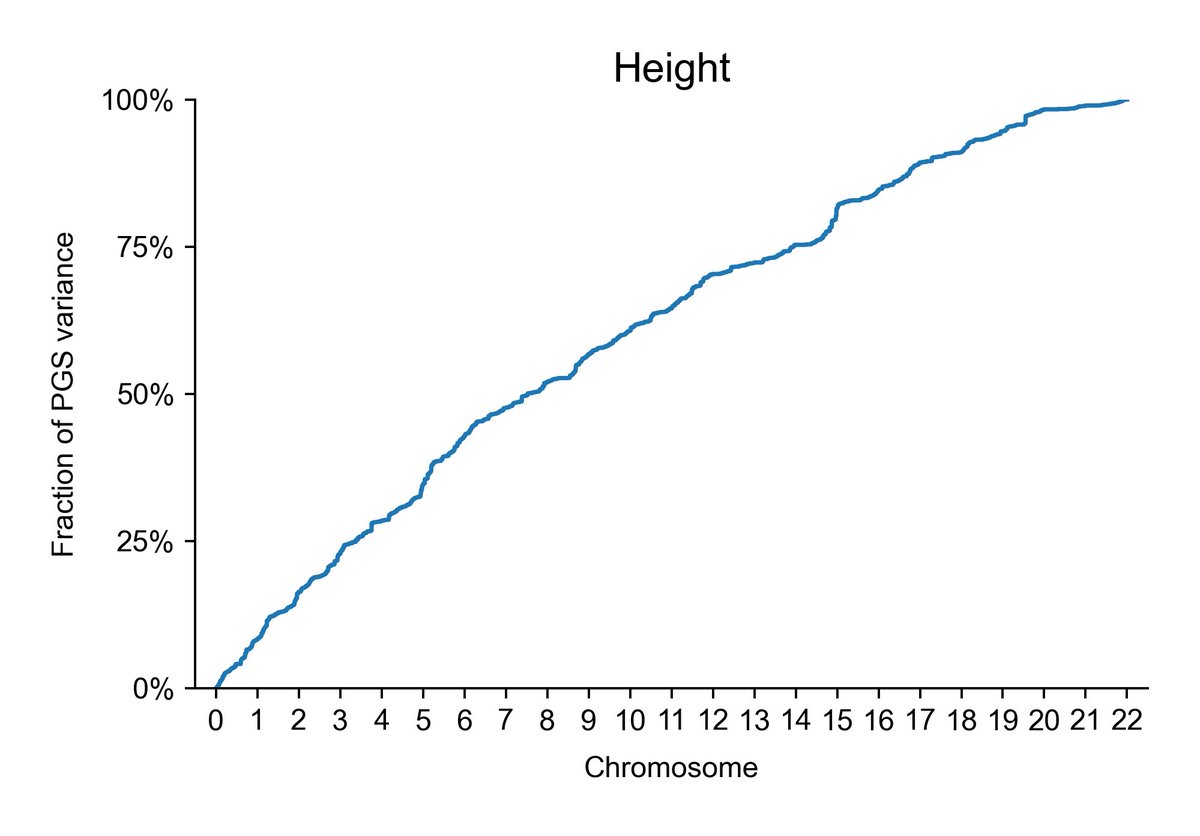
Height:
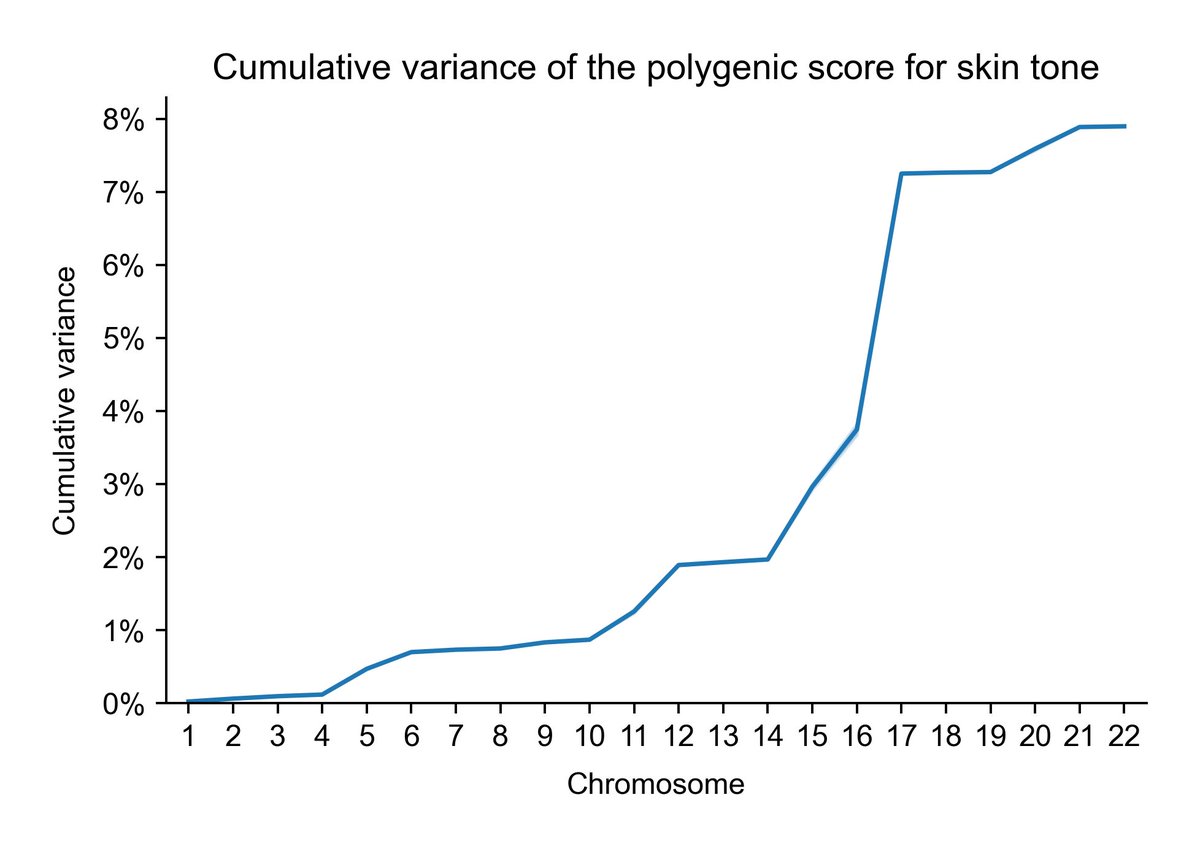
Skin color:
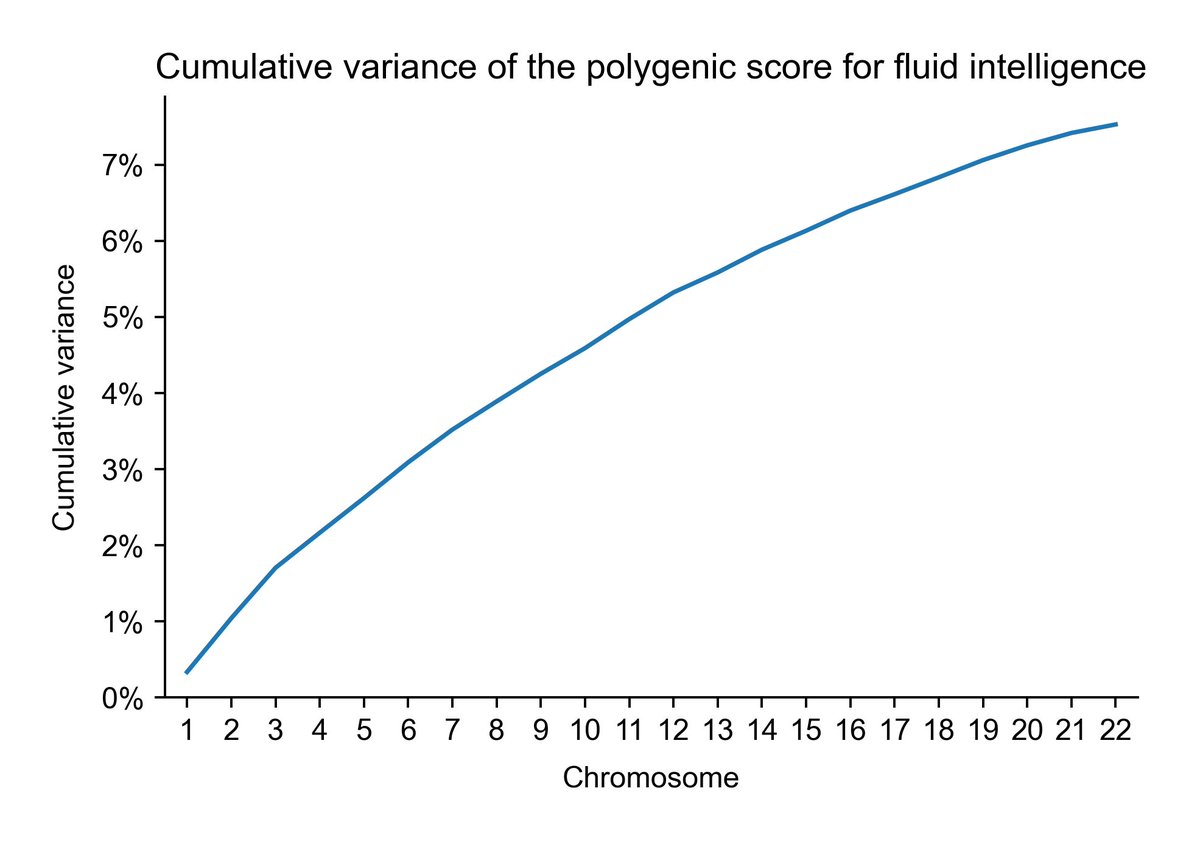
Fluid intelligence:
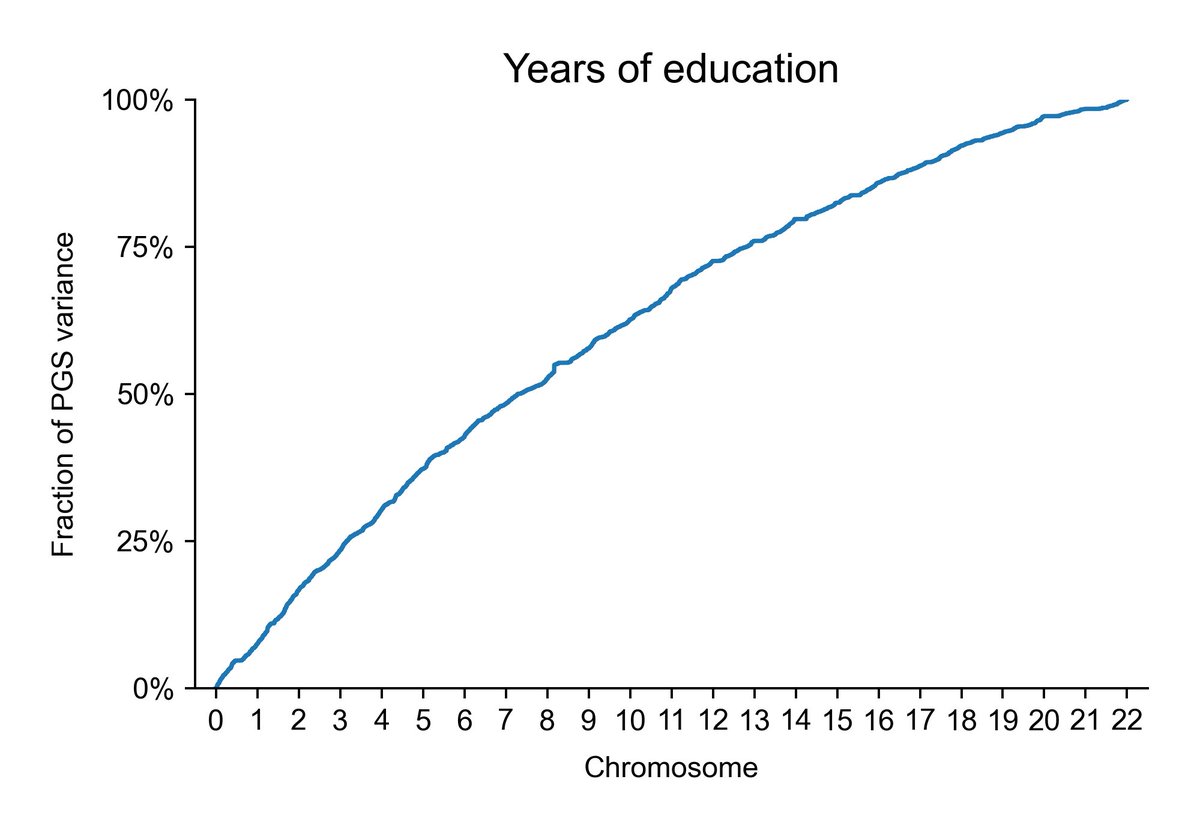
Educational attainment (years):
It's very easy to see why the sibling global admixture design works with a trait like height, but not with one like skin color or lp(a).
Height:
Skin color:
Fluid intelligence:
Educational attainment (years):
It's very easy to see why the sibling global admixture design works with a trait like height, but not with one like skin color or lp(a).

The big next step is to get this result online
After that, it's replicate, replicate, replicate
And then, fight the silly counterarguments, push the facts
But at this point, every realistic counterarg is already off the table. Even discrimination is scientifically indefensible
After that, it's replicate, replicate, replicate
And then, fight the silly counterarguments, push the facts
But at this point, every realistic counterarg is already off the table. Even discrimination is scientifically indefensible
Fractional chromosome resolution versions of the above four sparsity plots instead of plots with discretization at each chromosome.
You can see a bit more clearly like this that intelligence is even more sparse than height. Next post will show that lp(a) is clearly most sparse.
You can see a bit more clearly like this that intelligence is even more sparse than height. Next post will show that lp(a) is clearly most sparse.
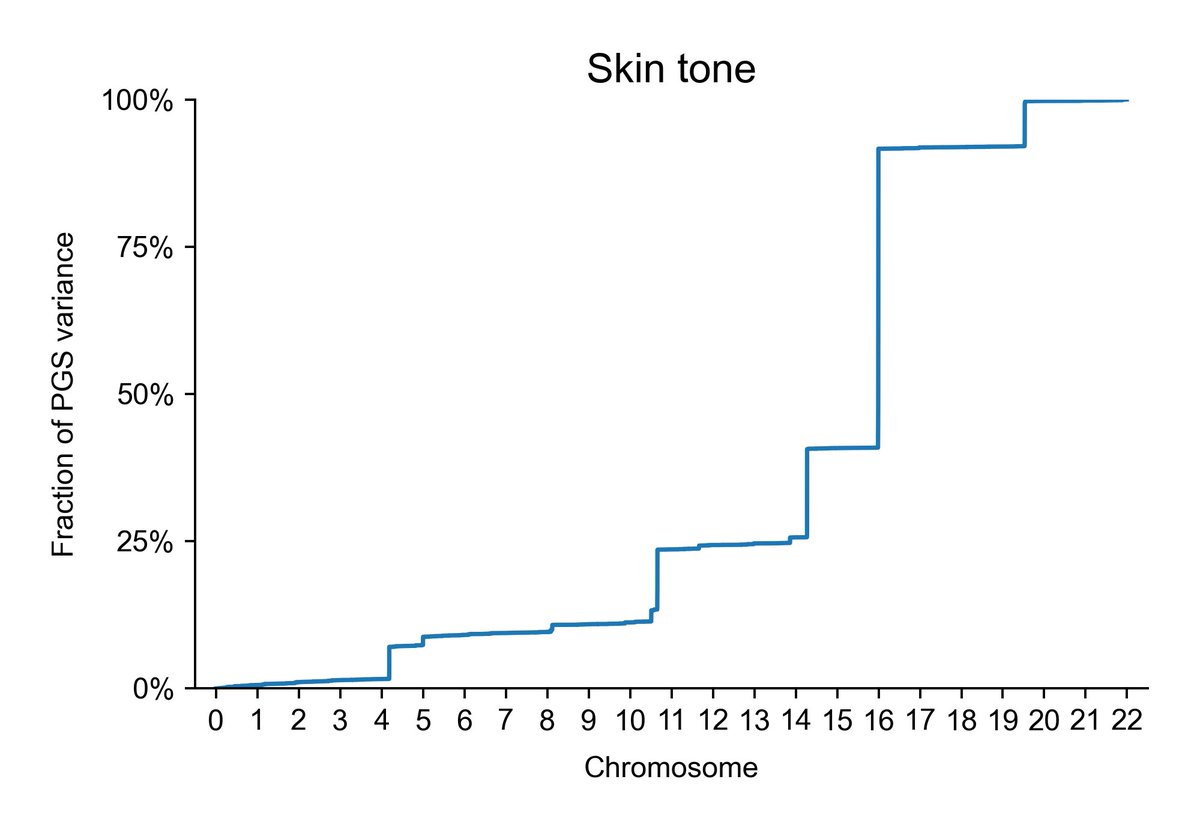
Insane sparsity.
It would work out between siblings if they were discordant for ancestry for the whole gene.
It would work out between siblings if they were discordant for ancestry for the whole gene.
Oh yeah, and creatinine, just in case anyone wants that for some reason.
It's moderate-to-low sparsity:
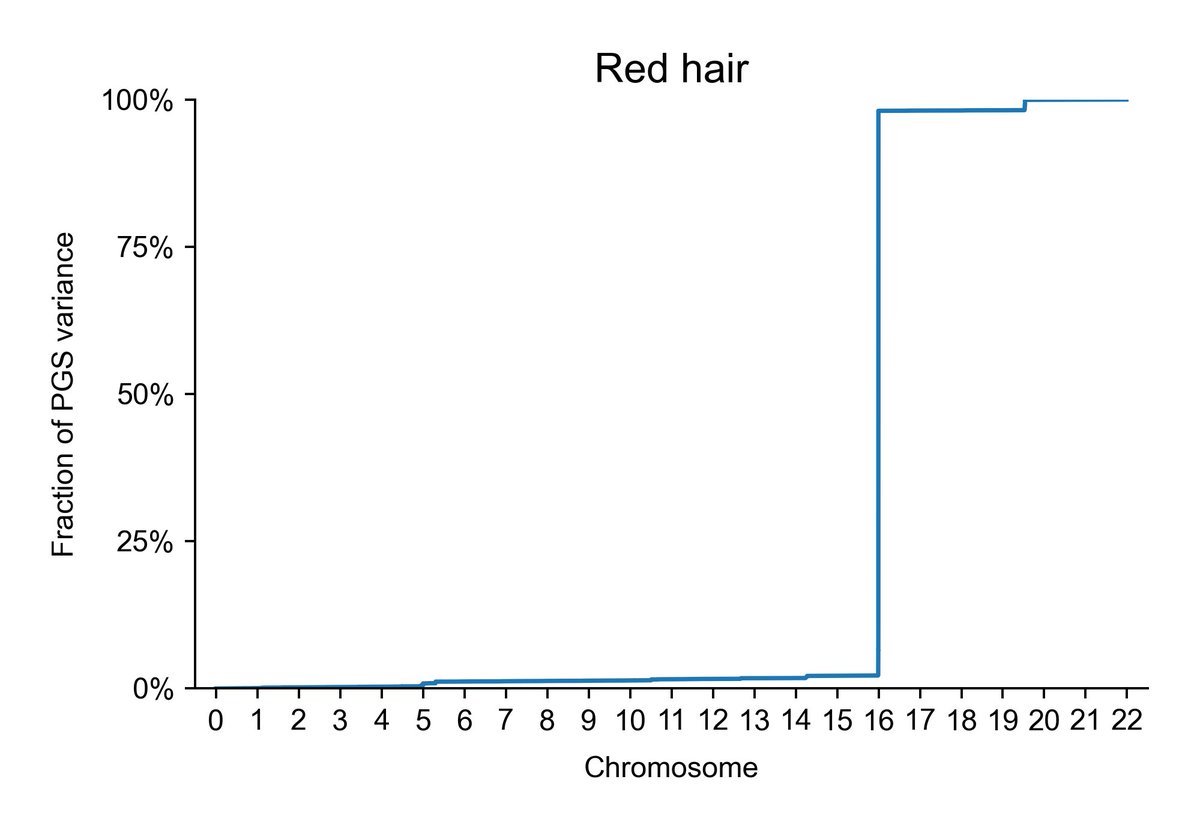
Here's red hair:
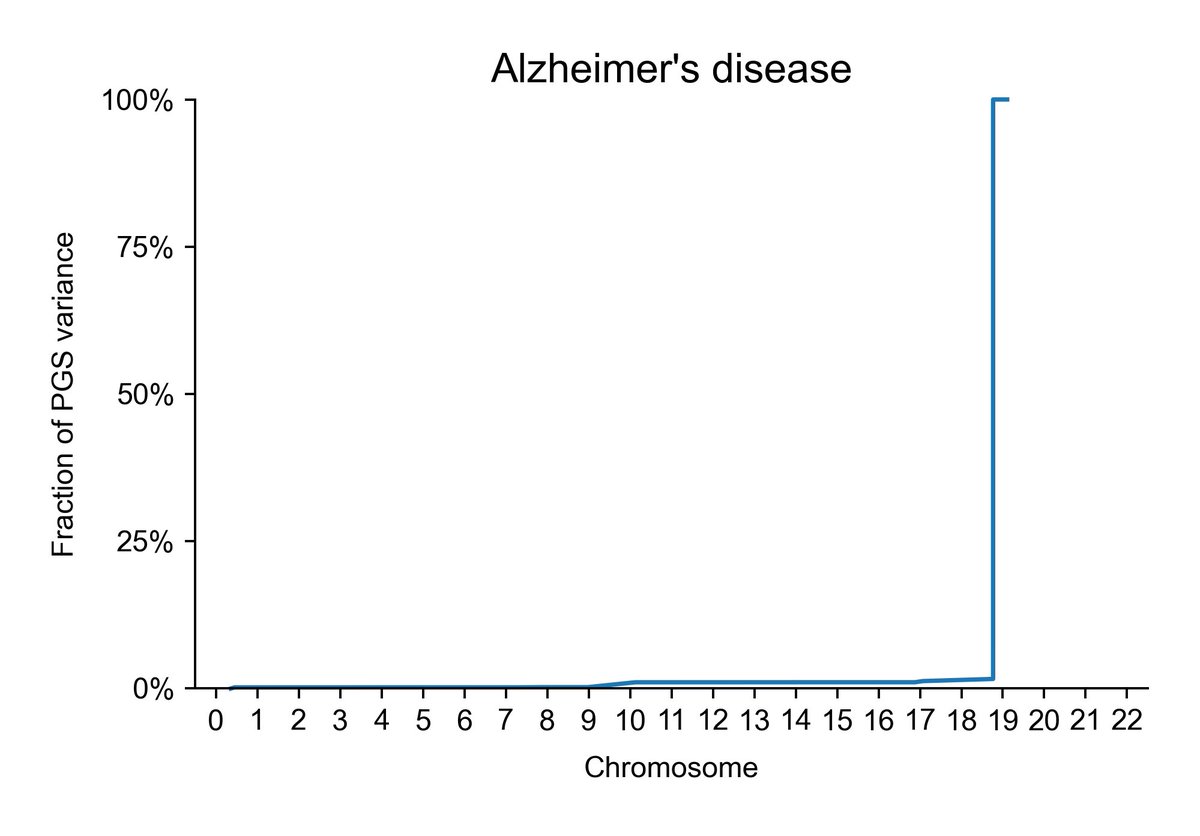
And Alzheimer's, for the highly polygenic but still insanely high sparsity example:
It's moderate-to-low sparsity:
Here's red hair:
And Alzheimer's, for the highly polygenic but still insanely high sparsity example:
The IQ plot caption should say less sparse, but whatever, typos were made.
The above Alzheimer's disease (AD) plot is mostly APOE, includes few variants. A more expansive Alzheimer's PGS shows less sparsity, closer to the moderate bin, but still an insane jump.

• • •
Missing some Tweet in this thread? You can try to
force a refresh