
PMC COVlD Report, Sep 15, 2025 (U.S.)
🧵1/7
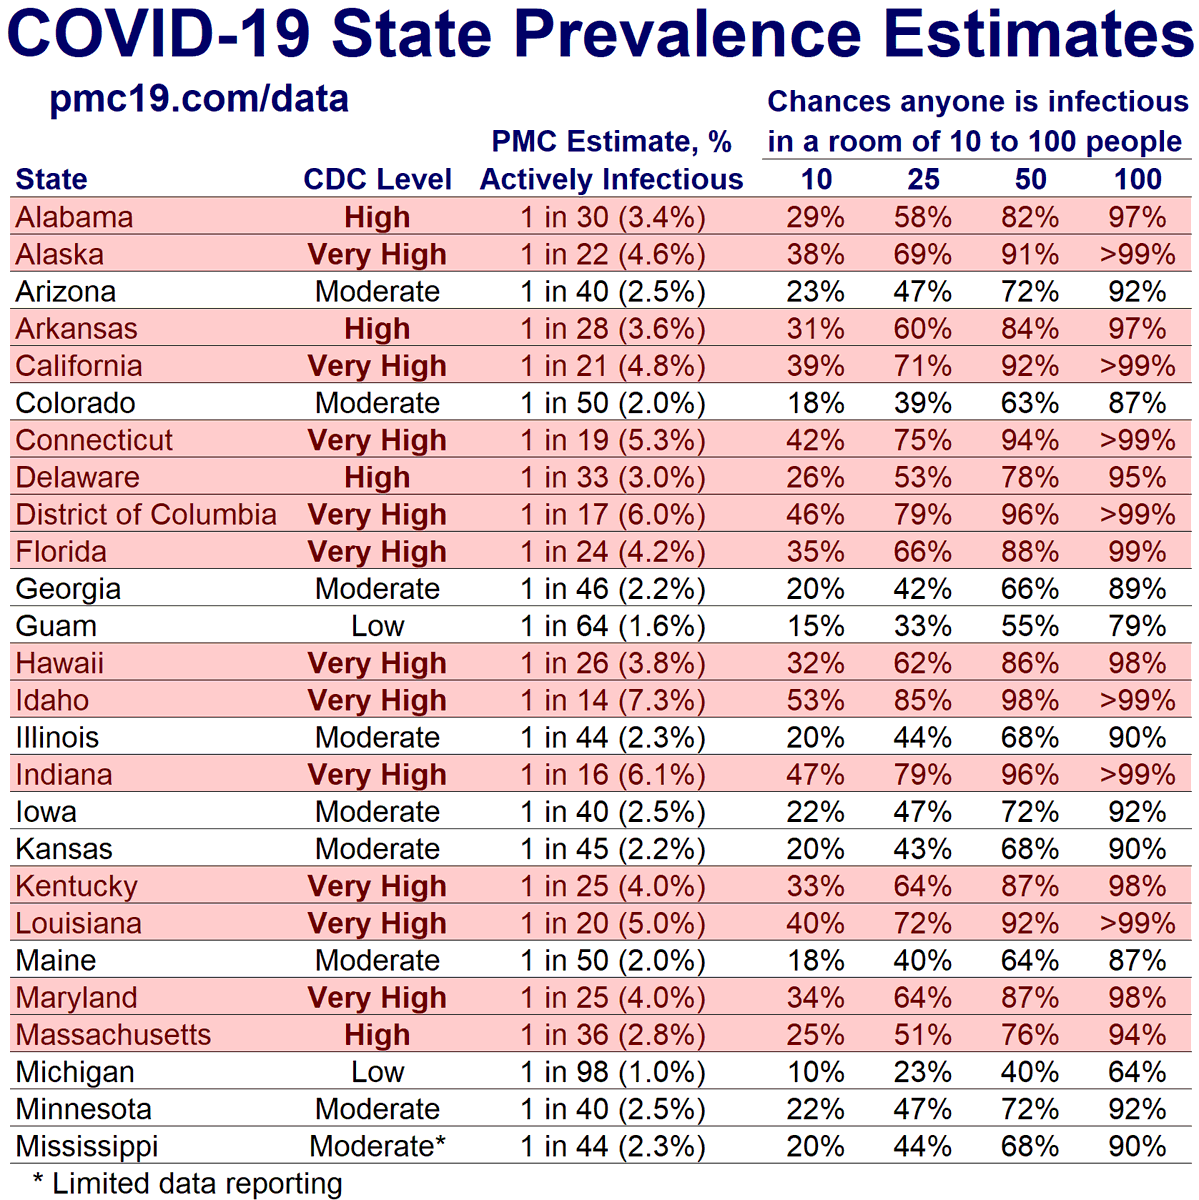
COVlD-19 levels are "Very High" or "High" in the majority of states, per the CDC.
This includes 27 states & D.C.
🔥🔥Very High:
Alaska, Hawai'i, California, Nevada, Idaho, Utah, S. Dakota, Nebraska, Texas, Louisiana, Indiana, Kentucky, Tennessee, Florida, S. Carolina, N. Carolina, D.C., Maryland, and Connecticut.
🔥High:
Washington state, Oregon, Montana, probably N. Dakota (imputed), Arkansas, Alabama, Virginia, Delaware, Rhode Island, and Massachusetts.
PMC estimates 1 in 38 people (2.7%) are actively infectious. Wastewater-derived case estimates suggest 1.3 million new daily infections.
🧵1/7
COVlD-19 levels are "Very High" or "High" in the majority of states, per the CDC.
This includes 27 states & D.C.
🔥🔥Very High:
Alaska, Hawai'i, California, Nevada, Idaho, Utah, S. Dakota, Nebraska, Texas, Louisiana, Indiana, Kentucky, Tennessee, Florida, S. Carolina, N. Carolina, D.C., Maryland, and Connecticut.
🔥High:
Washington state, Oregon, Montana, probably N. Dakota (imputed), Arkansas, Alabama, Virginia, Delaware, Rhode Island, and Massachusetts.
PMC estimates 1 in 38 people (2.7%) are actively infectious. Wastewater-derived case estimates suggest 1.3 million new daily infections.

PMC COVlD Report, Sep 15, 2025 (U.S.)
🧵2/7
Transmission is peaking nationally, but regional variation is common. Know what's happening in your state, and get the word out.
Note that the levels CDC calls "low" are still quite alarming.
🧵2/7
Transmission is peaking nationally, but regional variation is common. Know what's happening in your state, and get the word out.
Note that the levels CDC calls "low" are still quite alarming.
PMC COVlD Report, Sep 15, 2025 (U.S.)
🧵3/7
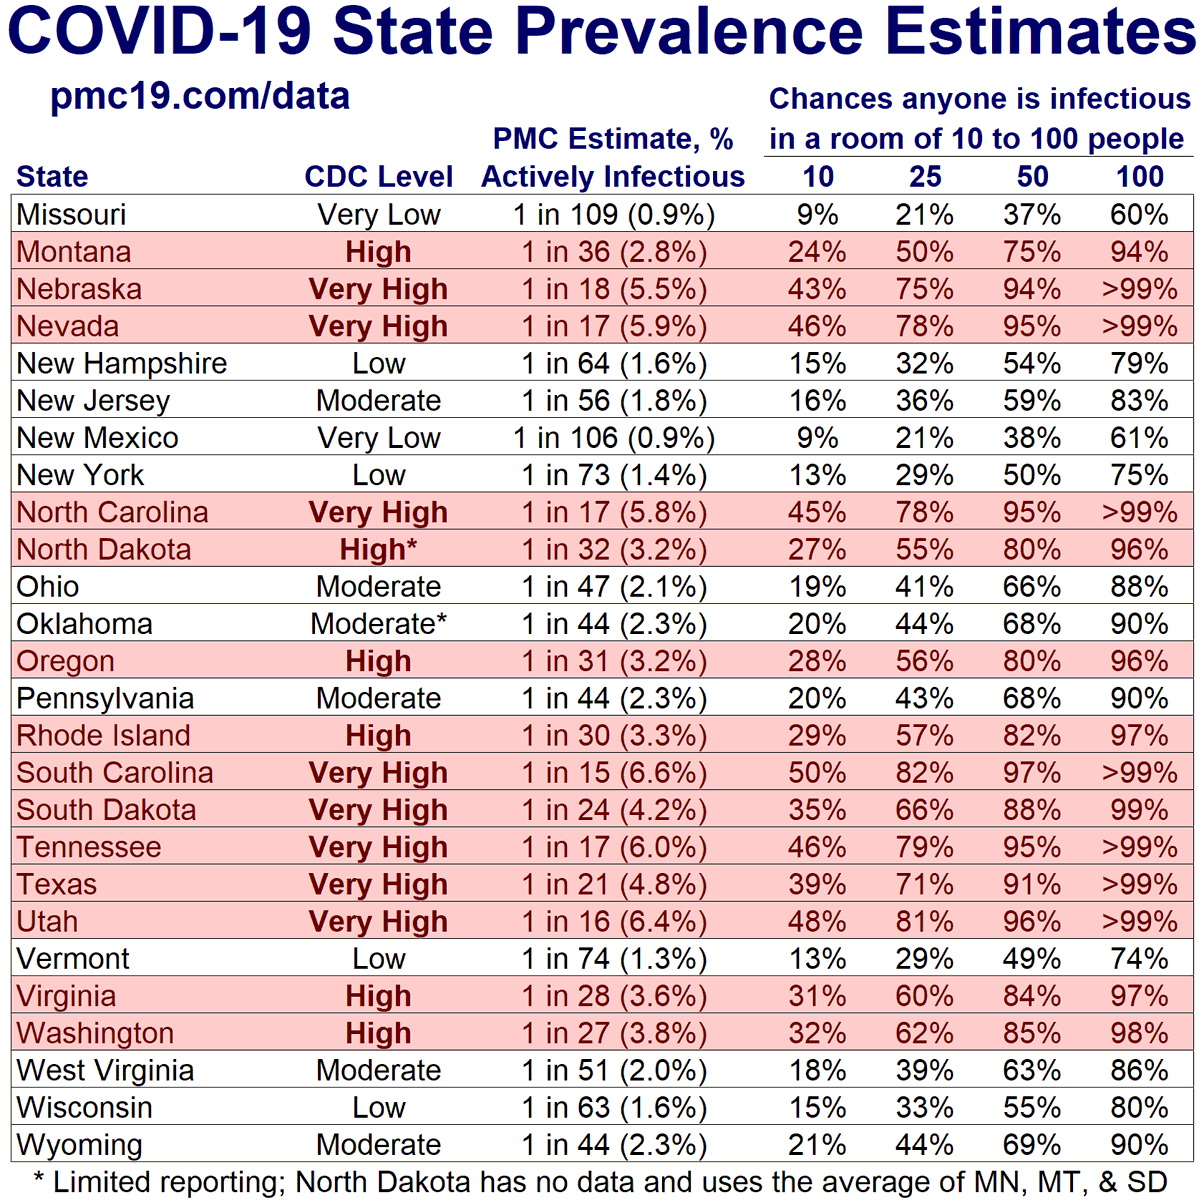
Note that transmission is increasingly spreading from the South & West toward other areas. Know your state-level risk.
Transmission remains alarming even in areas CDC labels "Very Low" (e.g., Missouri, estimated 1 in 109).
🧵3/7
Note that transmission is increasingly spreading from the South & West toward other areas. Know your state-level risk.
Transmission remains alarming even in areas CDC labels "Very Low" (e.g., Missouri, estimated 1 in 109).
PMC COVlD Report, Sep 15, 2025 (U.S.)
🧵4/7
"During COVlD" is today.
The U.S. experiences semi-annual waves. Wastewater-derived case estimates suggest the surge is peaking near 1.3 million new daily infections.
Note. CDC and Biobot made significant upward corrections to their levels reported last week, 5% and 31%, which pushes the estimated wave peak much higher.

PMC COVlD Report, Sep 15, 2025 (U.S.)
🧵5/7
Wastewater-derived case estimates suggest the U.S. is seeing approximately 9.0 million infections per week.
The past week's infections will result in up to 4,200 excess deaths.
Vaccination choice and access are being limited.
🧵5/7
Wastewater-derived case estimates suggest the U.S. is seeing approximately 9.0 million infections per week.
The past week's infections will result in up to 4,200 excess deaths.
Vaccination choice and access are being limited.

PMC COVlD Report, Sep 15, 2025 (U.S.)
🧵6/7
Current transmission (red) has closely tracked that of year 4 (yellow). Data through Sep 6 are shown.
If transmission drops sharply, like in year 4, Sep 6 would be the peak. Otherwise, we would have the latest U.S. summer peak so far.
🧵6/7
Current transmission (red) has closely tracked that of year 4 (yellow). Data through Sep 6 are shown.
If transmission drops sharply, like in year 4, Sep 6 would be the peak. Otherwise, we would have the latest U.S. summer peak so far.

PMC COVlD Report, Sep 15, 2025 (U.S.)
🧵7/7
Last week we noted the following as a plausible scenario. “A very large retroactive correction could shoot the peak substantially higher.” In fact, transmission was retroactively corrected upward, and that creates more uncertainty about the timing of the peak between the 6th and 13th.
The central projection for the current forecast appears to show a plateau heading into a gradual decline in transmission. However, it is best to consider this as an average scenario that must account for both a sudden drop as well as the possibility of continued increases.
Scenario #1: Peak on September 6 (approximately 40% chance). This would be similar to year 4 (see year-over-year graph), with a sharp, pointed peak. The peak would be estimated at approximately 1.25 million new daily infections.
Scenario #2: Peak on September 13 or late (approximately 60% chance). This would more resemble years 3 and 5, where transmission came down more gradually. The peak would be estimated at approximately 1.30 million new daily infections.
The truth may be somewhere in between, but the data only update weekly, so that level of precision is rarely possible. More importantly, transmission varies considerably regionally, so track local data closely.
Finally, note that significant transmission occurs post-peak, so ongoing multi-layered mitigation remains key. We advocate for national policy to increase vaccine eligibility and access across the nation, not merely in select states. I have volunteered to speak at ACIP, and if selected through the lottery system, will focus comments on ongoing and long-term excess mortality.

• • •
Missing some Tweet in this thread? You can try to
force a refresh


