Whole-Genome Sequencing Pilot Study of the Central Asian Genetic Diversity Project Reveals Distinct Genetic Histories, Adaptive Processes, and Introgression Events
Geography-related genetic differentiation among 47 Turkic groups across Eurasia
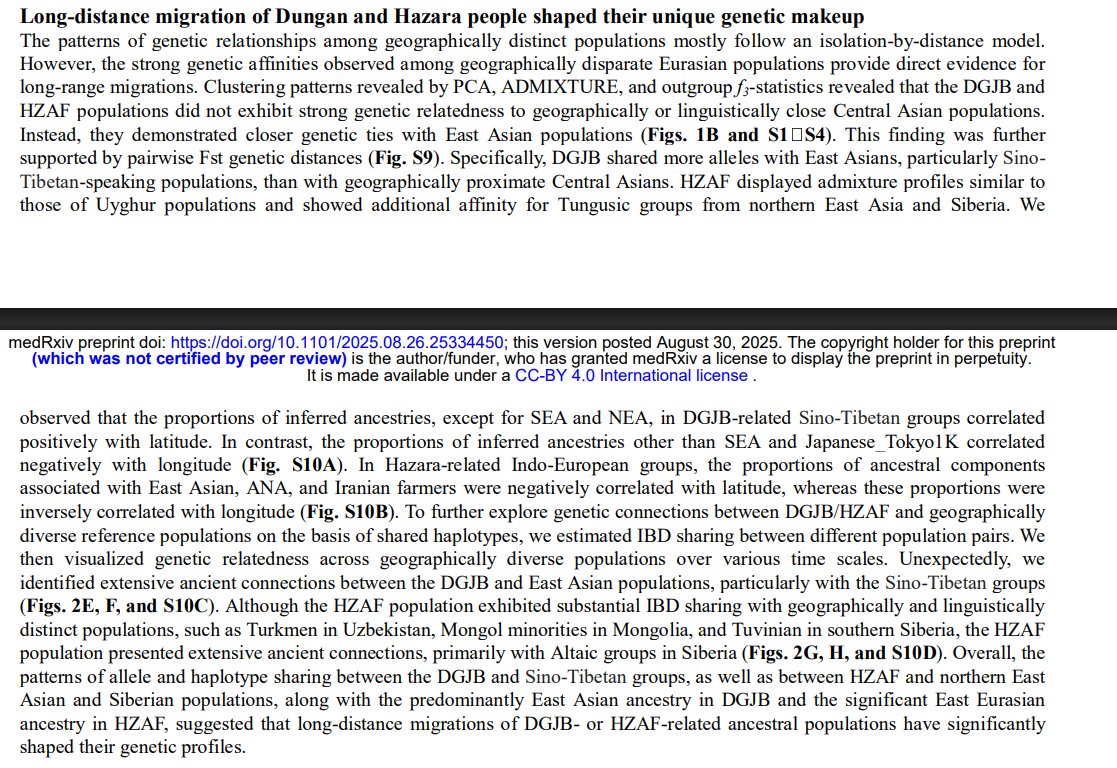
Long-distance migration of Dungan and Hazara people shaped their unique genetic makeup
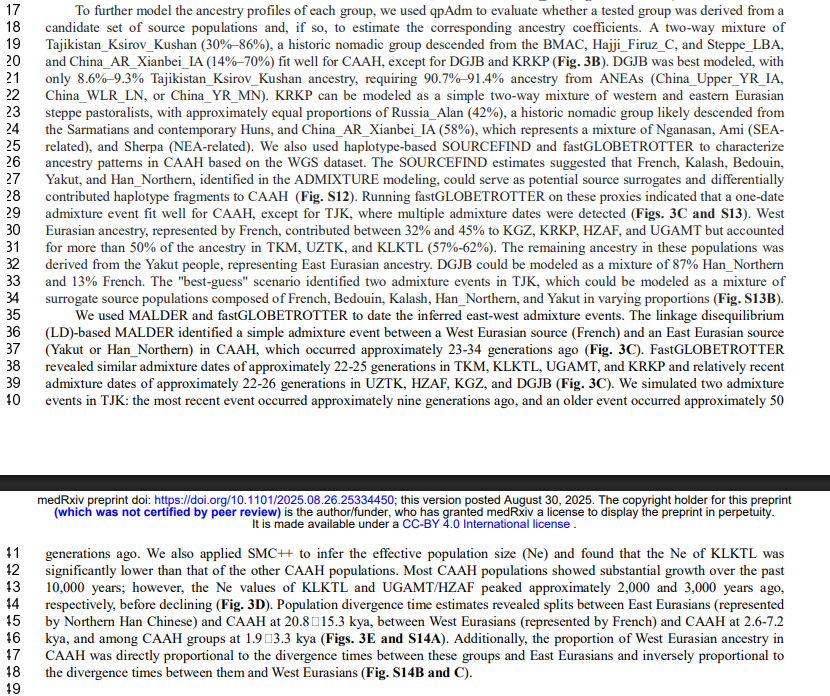
Admixture modeling and admixture time estimation of CAAH
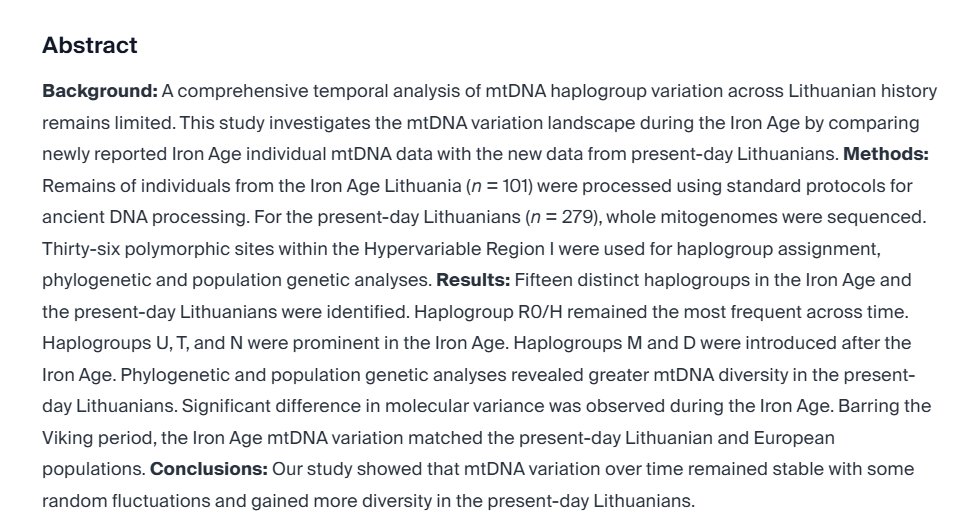
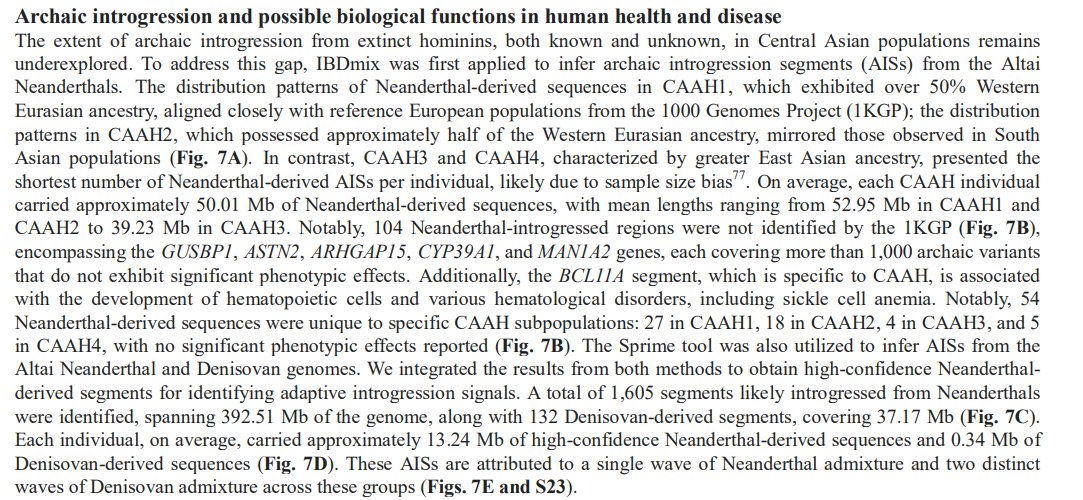
Archaic introgression and possible biological functions in human health and disease
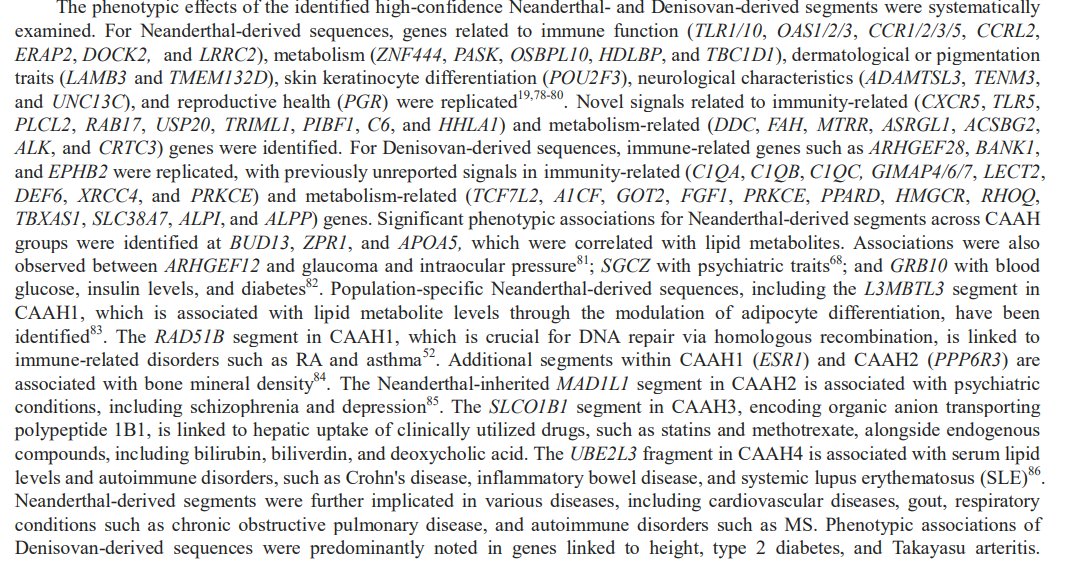
The phenotypic effects of the identified high-confidence Neanderthal- and Denisovan-derived segments were systematically examined.
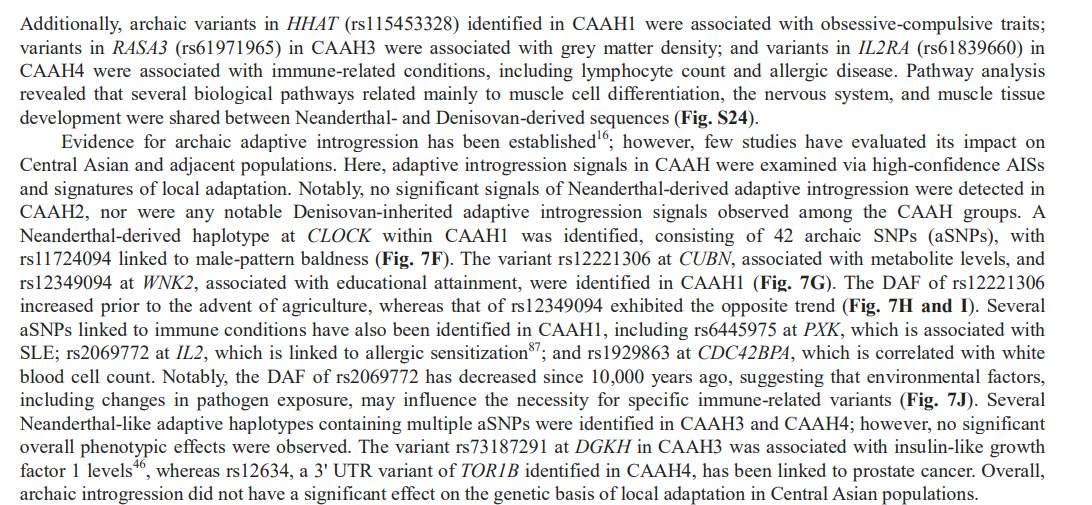
Additionally, archaic variants in HHAT (rs115453328) identified in CAAH1 were associated with obsessive-compulsive traits
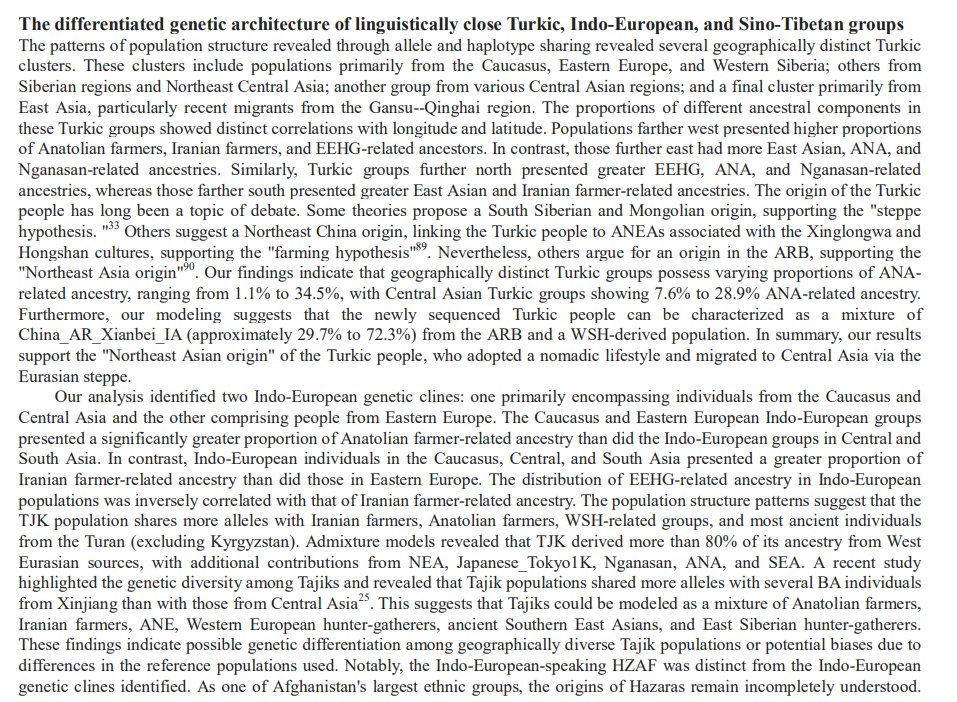
The differentiated genetic architecture of linguistically close Turkic, Indo-European, and Sino-Tibetan groups
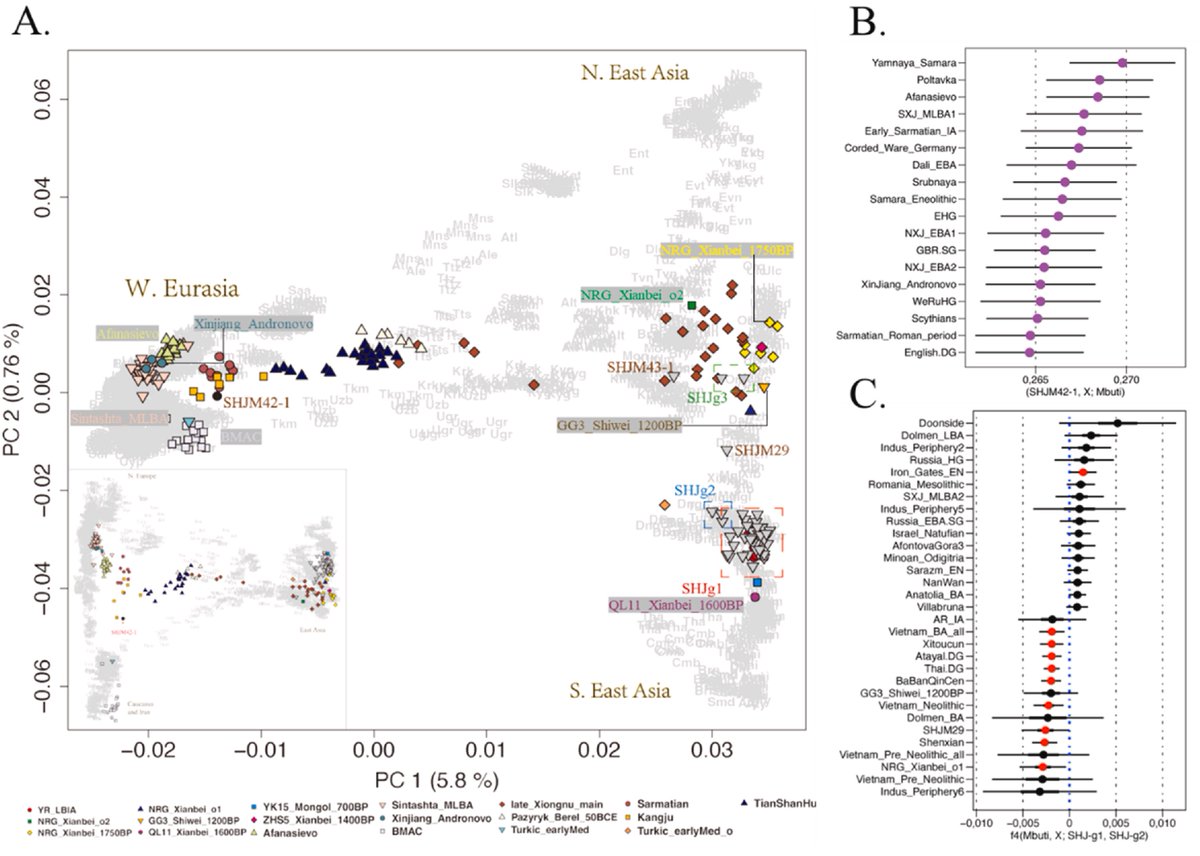
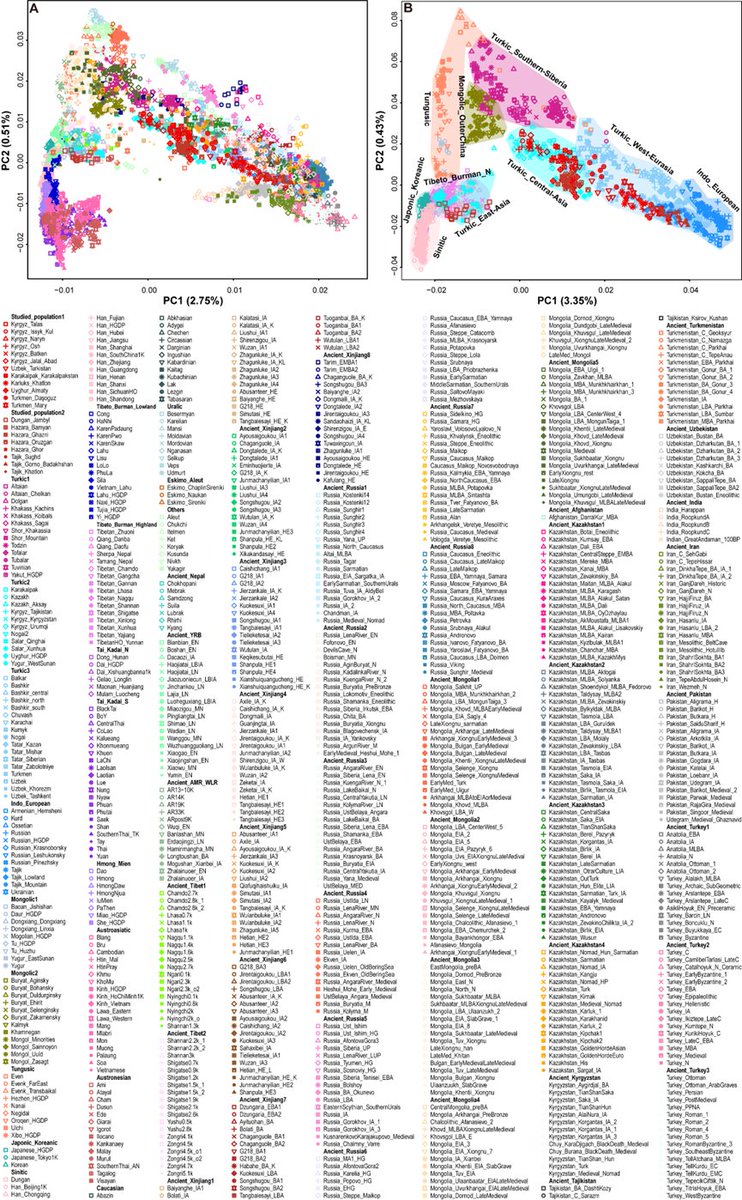
Genetic relationships between newly sequenced CAAH and spatiotemporally diverse Eurasian reference populations revealed based on the merged Human Origins (HO) dataset. (A)
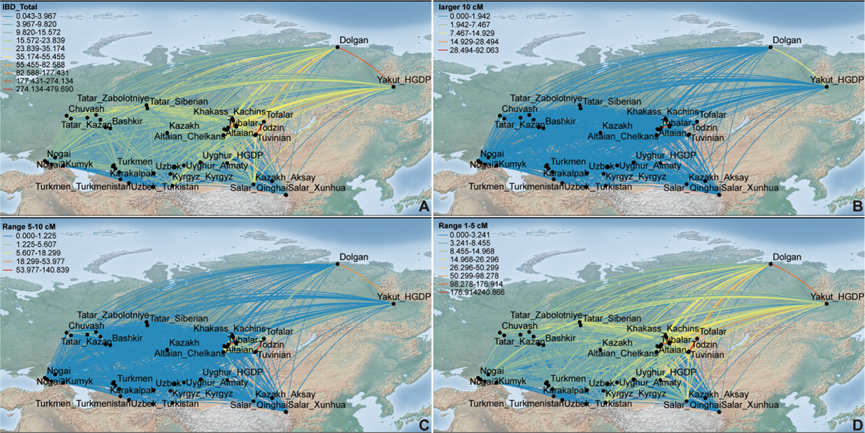
The identity-by-descent (IBD) sharing between all involved Turkic-speaking populations.
• • •
Missing some Tweet in this thread? You can try to
force a refresh
450 ancient Asian genomes trace the most recent common ancestor of the Qiang to ancient Yellow River farmers ~5300 years ago, indicating shared ancestry with other Chinese populations.
"Ancient Yellow River ancestry and divergent admixture histories in the Qiang people"
ADMIXTURE inference of the ancestral makeup of Qiang_H, Qiang_T and other Eurasian populations.
Great illustration. Genetic origin of the Qiang people.
(D) A possible demographic model of the Qiang population. Ancestry proportions were estimated using MultiWaveX and rescaled after incorporating ancient and private ancestry into the model
Fig. 1. The geographic location and time period of the SHJ site (A) Geographic location of the SHJ site and published relevant sites; (B) Timeline of the SHJ site's use during the mid-Pingcheng period of the Northern Wei Dynasty.
Genetic structure and affinities of the SHJ individuals
(A) Principal component analysis (PCA) showing the genetic variation of SHJ individuals projected onto present-day Eurasian populations;
(B) Outgroup f3-statistics showing that SHJM42-1 shares the most genetic drift with Steppe-related groups;
(C) f4-statistics (f4 (Mbuti, X; SHJ-g1, SHJ-g2)) indicate that SHJ-g1 individuals share more ancestry with East Asian populations than SHJ-g2.
Xiongnu armored cavalry, middle of the 1st century BC beginning of the 1st century AD (reconstruction by V. V. Gorbunov, drawing by G. L. Nekhvedavichyus
Warrior’s armor and bladed weapons of Xiongnu: 1—6 — armor plates; 7 — armor; 8 — helmet; 9 — sword; 10 — belt buckle; 11—13 — belt distributors; 14 — dagger (1—6 — after Эрдэнэбаатар и др. 2015:
V. V. Gorbunov Armored Cavalry of the Xiongnu and Xianbi: Reconstructing Armor and Equipment
Using the four ancient ancestral groups as parental components to directly estimate and compare the ancestry proportions of the 333 centenarians and 690 controls, resulting in the following mean values for CENT (WHG = 0.022, Iran_N = 0.019, Turkey_N = 0.63, Yamnaya_EBA = 0.32) and ITA (WHG = 0.017, Iran_N = 0.022, Turkey_N = 0.63, and Yamnaya_EBA = 0.33
Ancient genomes give insight into 160,000 years of East Asian population dynamics and biological adaptation.
How ancestral lineages and agricultural innovations shaped East Asian populations, while migrations and admixture events linked to shifting subsistence strategies contributed to genomic and phenotypic diversity.
Adaptive signatures from ancient genomes further elucidate the underpinnings of high-altitude adaptation, pigmentation, and morphological traits, offering new insights into human evolutionary biology.
Human evolutionary process and potential migrations in East Asia. Symbols of different colors and shapes are used to represent individuals with distinct archeological backgrounds and genetic connections.
The colored outlines delineate various regions: yellow for the TSM, purple for the ARB and WLRB, light yellow for the YRB, dark blue for the YZRB, and light blue for the TP and TYC.
The individual labels were consistent with the shapes and colors used in Fig. 2. The arrows indicate directions of past population spread or diffusion, with arrow colors corresponding to specific regions.