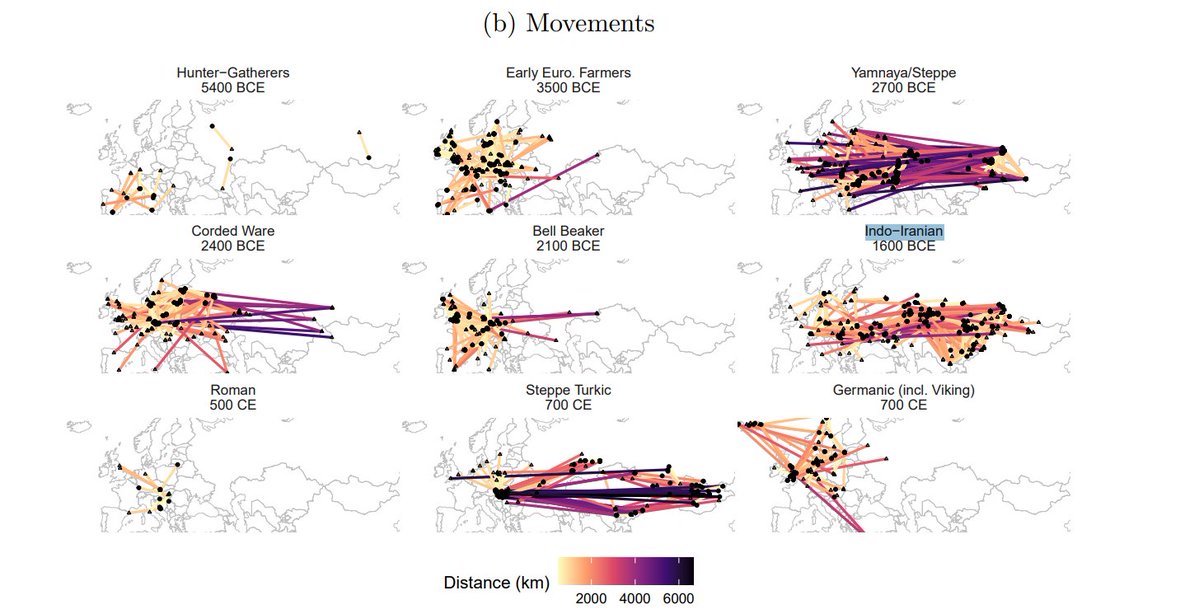
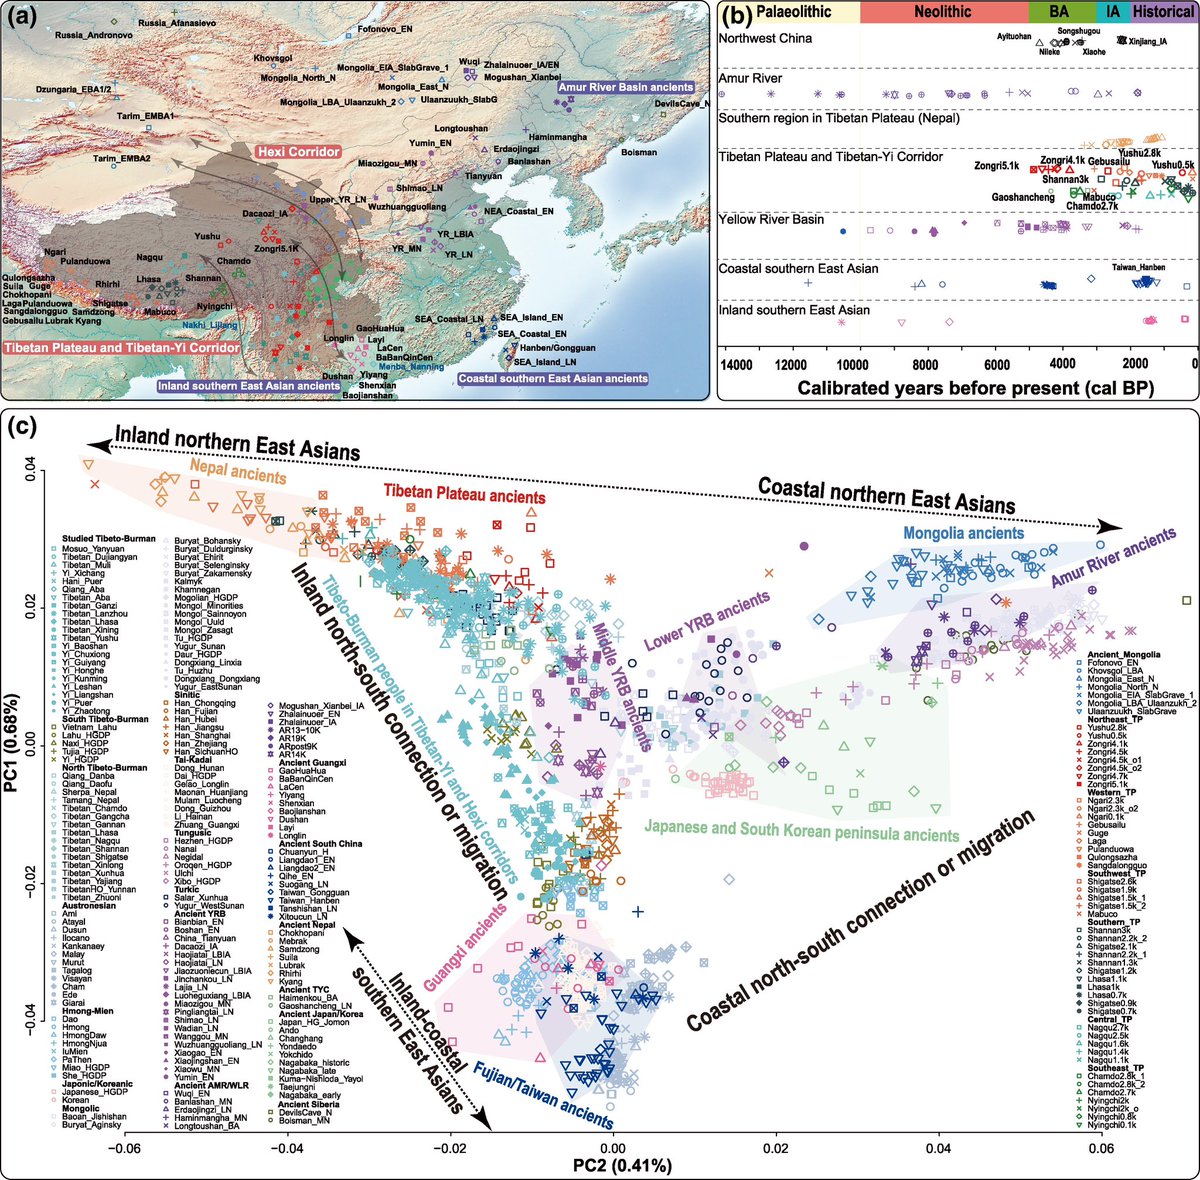
Nrken19 Profile picture
Archeology, History, aDNA, Anthropology. 🇩🇰🇸🇪🇳🇴🇮🇸🇫🇴
Apr 12 6 tweets 2 min read
399 shotgun genomes from the Royal Basilica of Szekesfehervar.

"Genomic landscape of the medieval Hungarian elite from the Szekesfehervar royal necropolis"

biorxiv.org/content/10.648…Image 
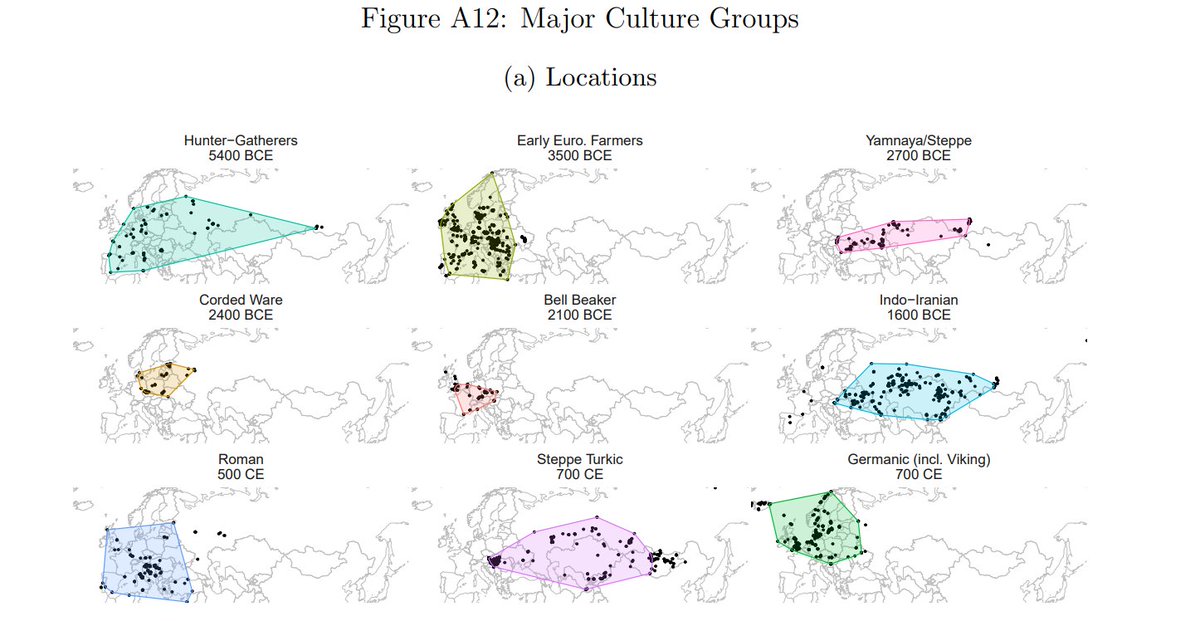
Eastern ancestry largely derived from conquering Hungarians Image
Apr 9 5 tweets 3 min read
Polish nobility. The Piasts were one of the royal dynasties that shaped the political structure of medieval Europe in the 10th century AD.

The Y haplogroup lineage identified in the Piasts is (R1b-BY3549). Also the determination of mtDNA for more than 200 historical figures from 10 European royal dynasties.

“Genetic genealogy of the Piast dynasty and related European royal families”

nature.com/articles/s4146… “a Shows a portion of the Piast family tree with all 21 male members of the dynasty reported to be buried in Płock and Warsaw (purple blocks). The individuals who also belong to this portion of the family tree and were buried elsewhere or at an unknown location are shown as white blocks. For each of the Piasts, his or her historical name, date of death, and age at death (in parentheses) are shown.

b Presents selected results of our anthropological and genomic analyses of 17 skeletal remains found in Płock and Warsaw. For each individual, we showed the mean radiocarbon date (14C), estimated skeletal age (ESA), mt-hg, Y-hg, and if their name was determined earlier by other researchers, their identity. c (Pink) shows the kinships among the 17 examined individuals that we determined on the basis of the obtained genome-wide data. The data in (a, b) are coloured based on the four subsets of 21 historical Piasts/17 skeletal remains (PIAST01-17) we determined: Piast of Płock-1 (PP-1, orange), Piast of Płock-2 (PP-2, green), Piast of Płock-3 (PP-3, yellow) and Piast of Warsaw (PW, blue).”Image
Apr 6 5 tweets 2 min read
This study clarified the population structure of Y haplogroups in the Slavic population of European Russia.

“Biochip for Determination of 92 Human Y-Chromosome Haplogroups by SNP Markers and Frequency Distribution of These Haplogroups in Slavic Population of European Russia”

link.springer.com/article/10.113… “The haplogroup I-U179 is a West European haplogroup and has two distribution foci, North European countries (27‒48%) with carriers of the subclade I1-M253 and Balkan countries (30‒47%) with carriers of the subclades I2-M438. I1-M253 is sufficiently common in Estonia (15%). Its two downstream subclades, I1a1-Z2336 and I1a2-Z58, were included in the panel. The haplogroup I2 is widespread in Ukraine (13%), Belarus (7%), and Russia (5%). Three down-stream subclades of the haplogroup were selected for the panel: I2a1a-S2648, I2a1b-M436, and I2a2-L596.”
Jan 15 5 tweets 2 min read
450 ancient Asian genomes trace the most recent common ancestor of the Qiang to ancient Yellow River farmers ~5300 years ago, indicating shared ancestry with other Chinese populations.

"Ancient Yellow River ancestry and divergent admixture histories in the Qiang people"

science.org/doi/10.1126/sc…Image 
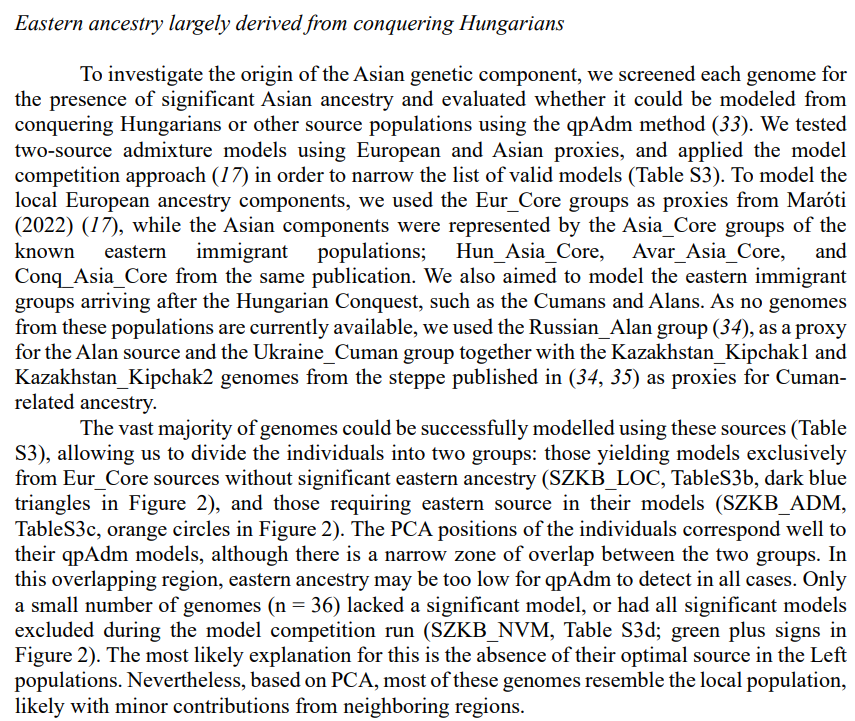
ADMIXTURE inference of the ancestral makeup of Qiang_H, Qiang_T and other Eurasian populations. Image
Jan 10 8 tweets 3 min read
Multidisciplinary analysis reveals genetic heterogeneity and millet farmer ancestry in late Xianbei individuals

sciencedirect.com/science/articl…Image 
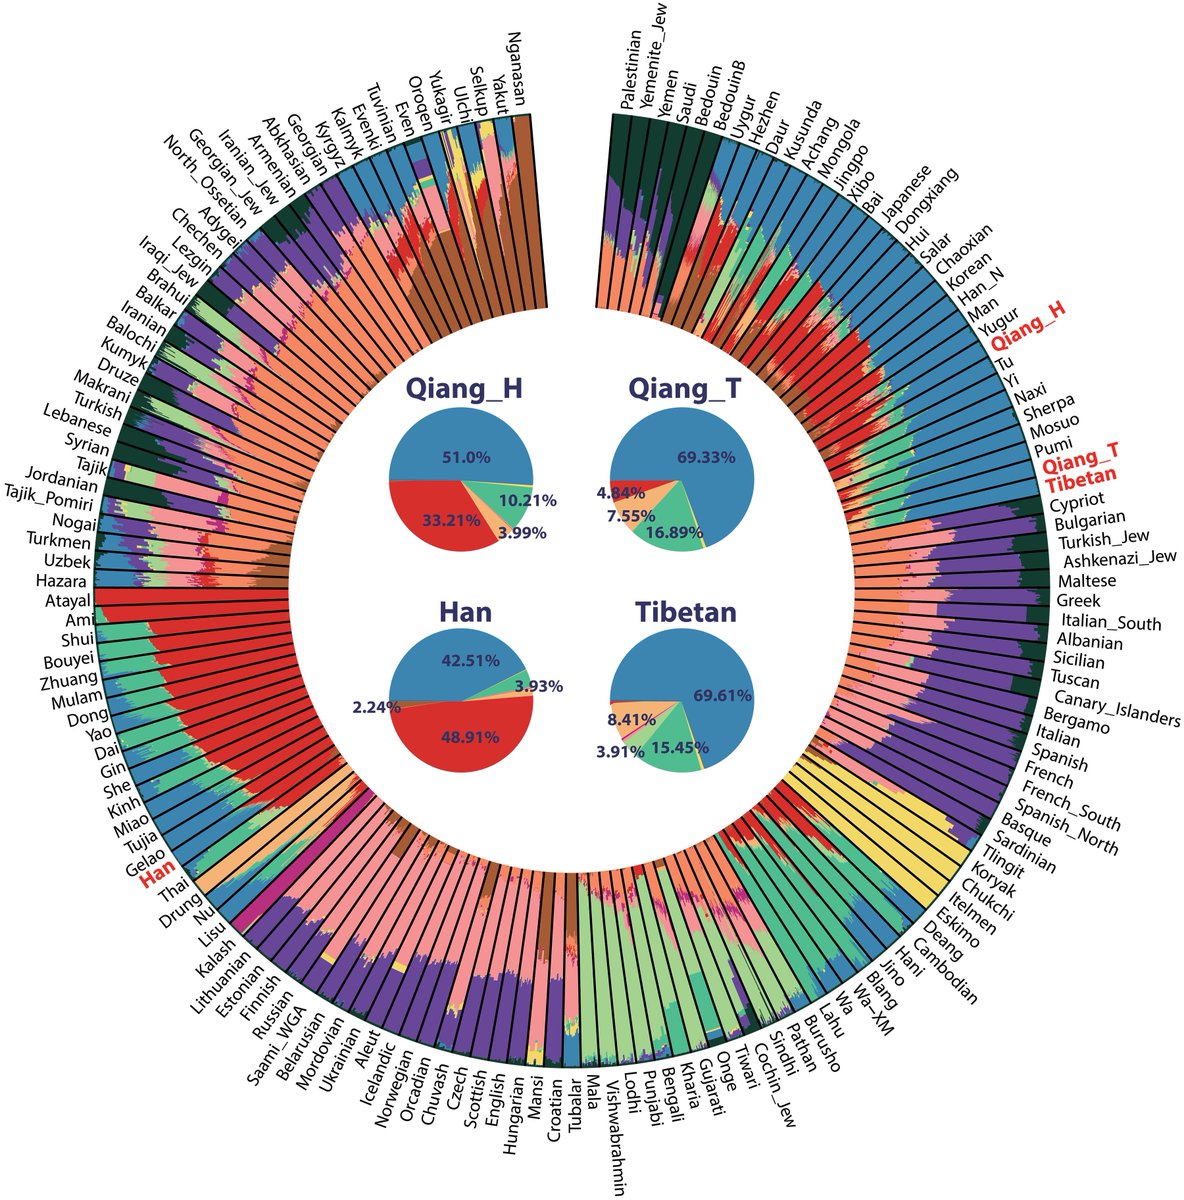
Fig. 1. The geographic location and time period of the SHJ site (A) Geographic location of the SHJ site and published relevant sites; (B) Timeline of the SHJ site's use during the mid-Pingcheng period of the Northern Wei Dynasty. Image
Jan 9 4 tweets 2 min read
Xiongnu armored cavalry, middle of the 1st century BC beginning of the 1st century AD (reconstruction by V. V. Gorbunov, drawing by G. L. Nekhvedavichyus Image 
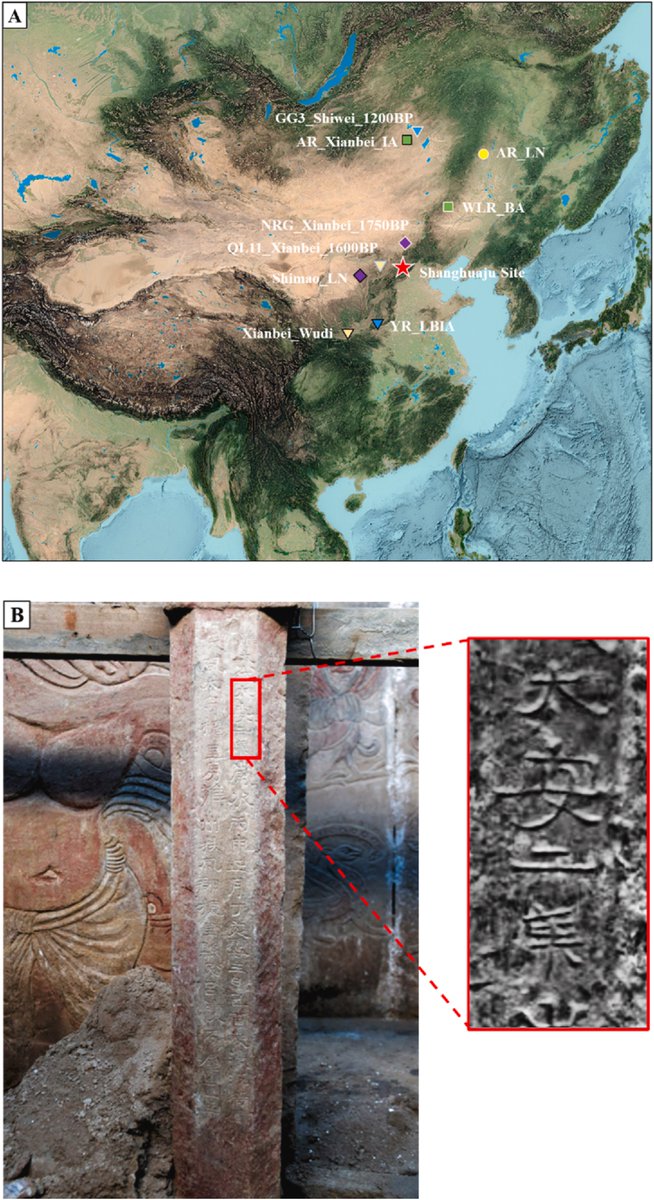
Warrior’s armor and bladed weapons of Xiongnu: 1—6 — armor plates; 7 — armor; 8 — helmet; 9 — sword; 10 — belt buckle; 11—13 — belt distributors; 14 — dagger (1—6 — after Эрдэнэбаатар и др. 2015: Image
Dec 13, 2025 4 tweets 2 min read
Millennia of Mitochondrial Change: Tracing Haplogroup Variation in Lithuania

mdpi.com/2571-9408/8/12…Image 
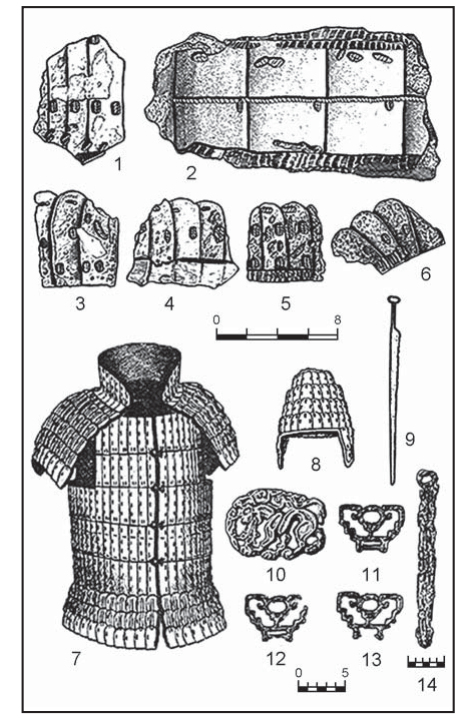
Part of the discussion Image
Dec 13, 2025 4 tweets 2 min read
Western Hunter-Gatherer genetic (WHG) ancestry contributes to human longevity in the Italian population

link.springer.com/article/10.100… Abstract Image
Dec 10, 2025 4 tweets 2 min read
Ancient genomes give insight into 160,000 years of East Asian population dynamics and biological adaptation.

How ancestral lineages and agricultural innovations shaped East Asian populations, while migrations and admixture events linked to shifting subsistence strategies contributed to genomic and phenotypic diversity.

Adaptive signatures from ancient genomes further elucidate the underpinnings of high-altitude adaptation, pigmentation, and morphological traits, offering new insights into human evolutionary biology.

link.springer.com/article/10.118… Graphical abstract Image
Dec 1, 2025 4 tweets 2 min read
Genetic ancestry proportions of research participants who reported that all four grandparents were born in Mexico.

(a) Genetic ancestry proportions of individuals in the initial clustering cohort; the x-axis reflects the mean ancestry of every five individuals with the most similar ancestry proportions (for anonymity purposes).

(b) Mean genetic ancestry proportions of the nine populations identified in the initial round of PPSBM clustering, with the mean proportions of sub-population identified in subsequent sub-clustering shown to the right.

(c) Genetic ancestry proportions of additional PPSBM clustering applied to the Central Mexican Highlands population, followed by the Central–Isthmus Corridor population. Genetic ancestry populations presented at very low proportions are merged into the “Trace” category. Inner circles of the wheels, when present, represent continental-level ancestry proportions.Image 
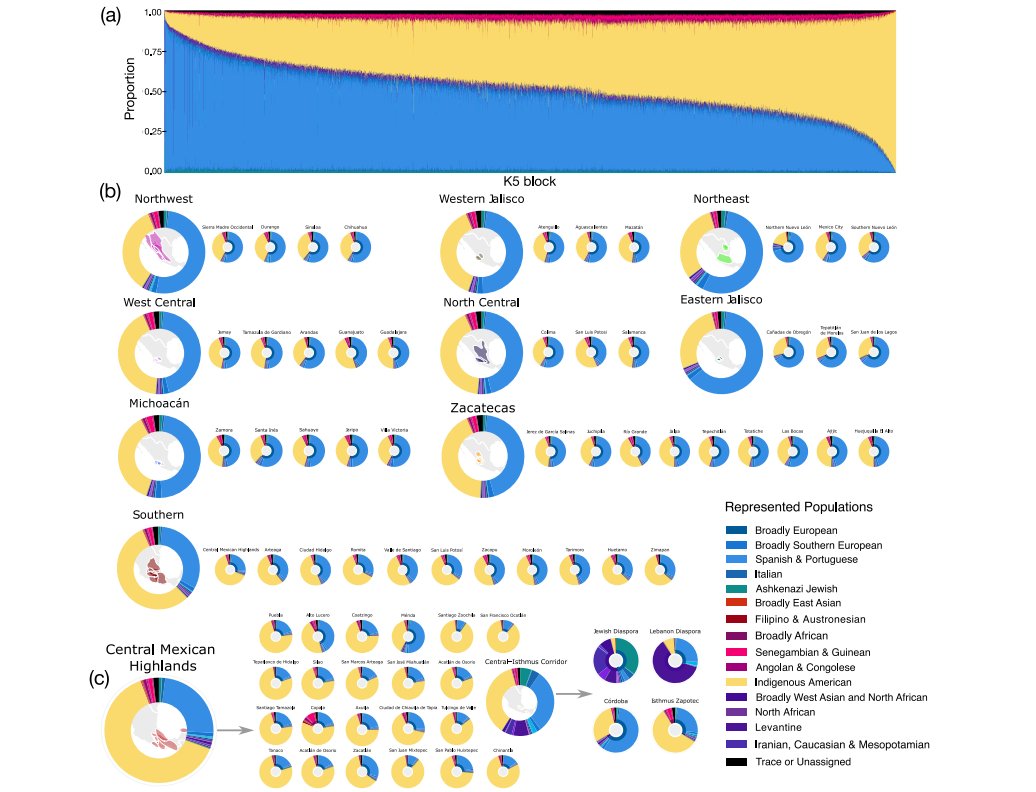
"Fully Bayesian framework that models IBD sharing with a generative planted-partition stochastic block model (PPSBM). To benchmark accuracy, we simulated genomes under recent population divergence and compared PPSBM estimates with those from the widely used Leiden community-detection algorithm. The PPSBM correctly assigned 81.0% of individuals on average versus 67.0% for Leiden, outperforming Leiden in 92.0% of replicates."

"Bayesian inference of population structure using identity-by-descent-based stochastic block models"

biorxiv.org/content/10.110…Image
Nov 19, 2025 9 tweets 5 min read
The origins of Tibeto-Burman populations on the eastern Tibetan Plateau (TP), especially within the Tibetan-Yi Corridor, remain unresolved.

By sequencing whole genomes of 293 individuals from 21 Tibeto-Burman-speaking groups and genotyped 799 individuals from 60 Sino-Tibetan-speaking groups to reconstruct regional population history.

academic.oup.com/mbe/article/42… Genetic landscape of Sino-Tibetan-speaking populations in Eastern Eurasia. a) Geographic distribution of newly genotyped Sino-Tibetan groups alongside modern and ancient reference populations, providing a spatial context for the genetic background of the population. b) The temporal framework of ancient East Asian reference populations was plotted along a timeline of YBP. c) PCA of modern and ancient East Asians, in which ancient individuals were projected onto the patterns based on the two principal components estimated from modern population genetic variations. Modern individuals are grouped by language family in the PCA, with colored polygons indicating genetic or linguistically cultural affinities.Image
Nov 15, 2025 7 tweets 3 min read
Fifteen millennia of human mitogenome evolution in Sicily

science.org/doi/10.1126/sc…Image 
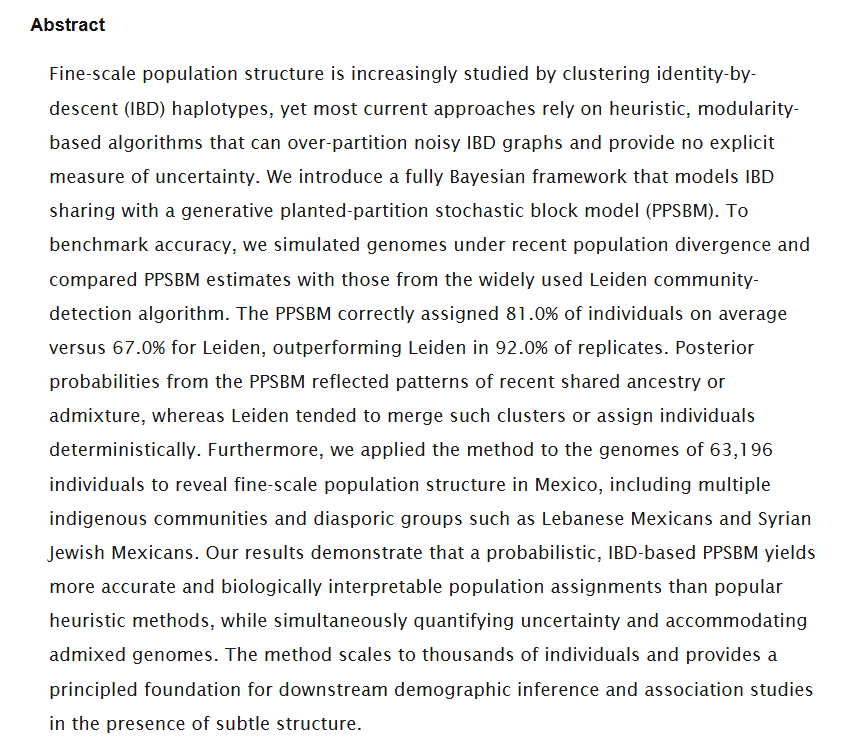
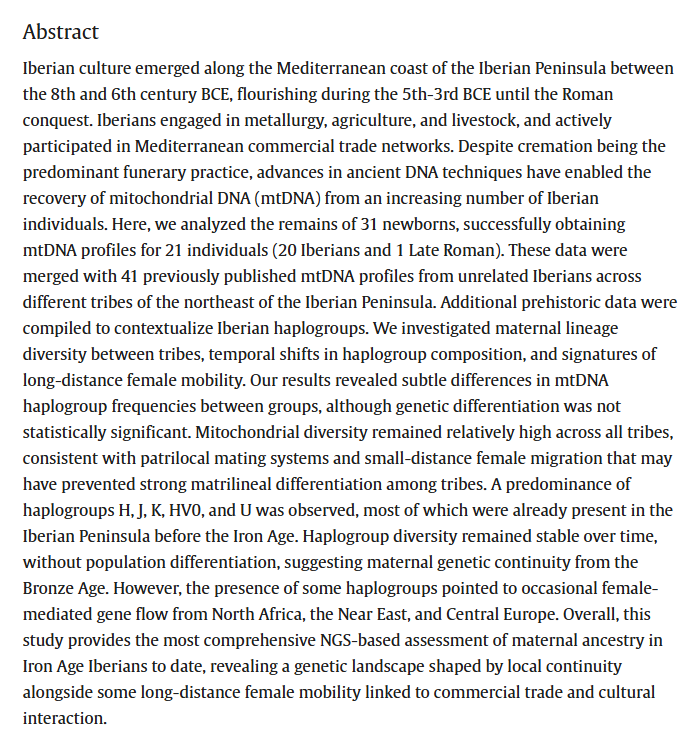
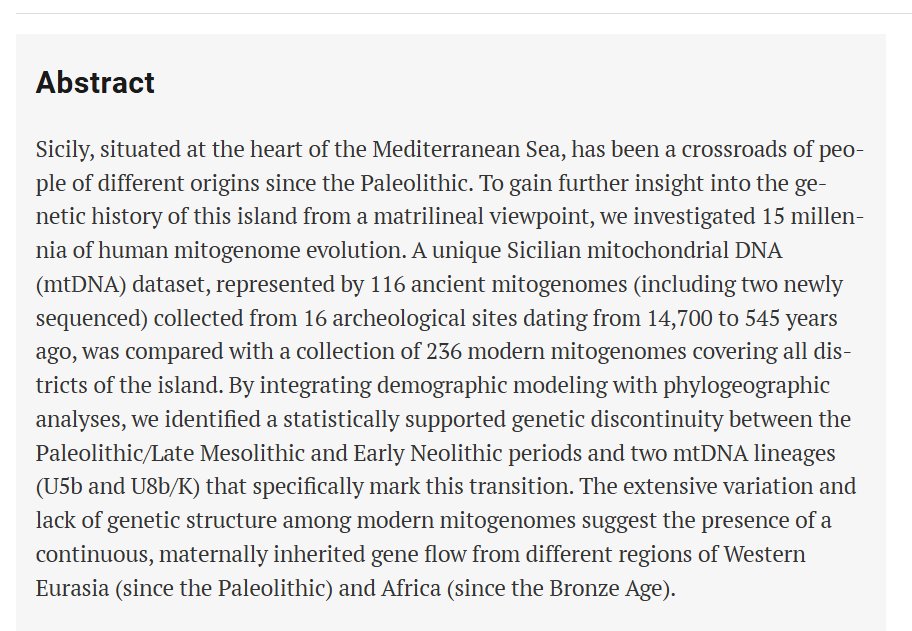
Origin of mitogenomes and haplogroup frequencies. Image
Nov 7, 2025 4 tweets 2 min read
Effects of ancestry, agriculture, and lactase persistence on the stature of prehistoric Europeans

Highlights

•Polygenic scores predict about 9% of height variation in ancient Europeans

•Slightly shorter Neolithic statures can be explained by genetics

•Re-estimated ancient height SNP effects are consistent with present-day effects

•Lactase persistence affects ancient height even though there is no effect today

sciencedirect.com/science/articl…Image 
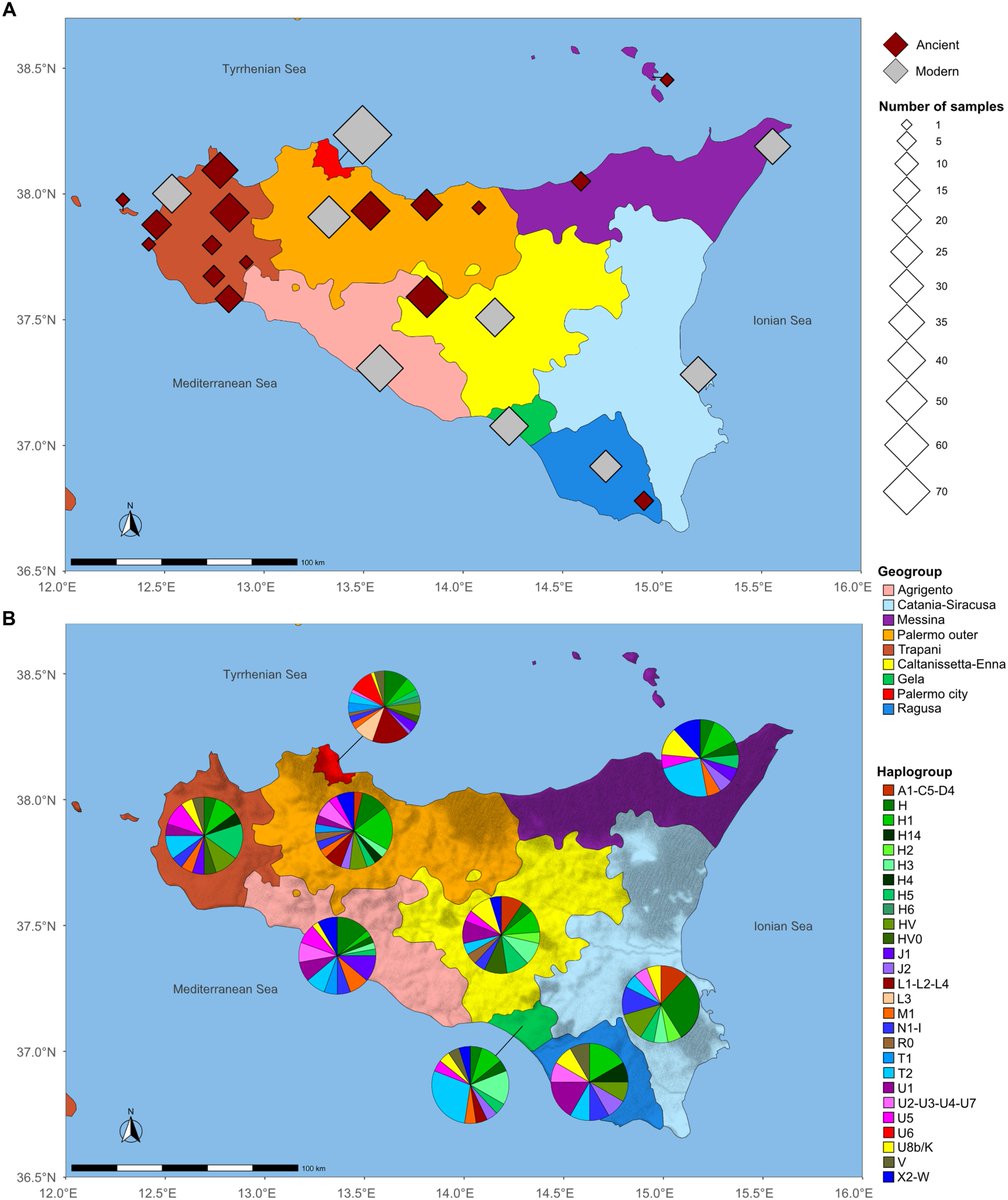
The Neolithic transition had limited effect on stature Image
Nov 7, 2025 5 tweets 2 min read
This study analysed published Y-STR data for 186 populations and regions, including 14,504 individuals from 52 Middle Eastern and 134 African populations.

The most common haplogroups in the Middle Eastern populations were J1a (29.4%), while in the African populations, E1b1a (43.2%) was the most prevalent.

link.springer.com/article/10.100… Phylogenetic tree of genetic relationships among the 43 Middle Eastern and African populations. Five clusters (K = 5) were created. The red-coloured cluster is the largest (15 populations), followed by the cyan-coloured cluster (7 populations), and the purple-coloured cluster (6 populations). The remaining two clusters each have five populations. This phylogenetic tree was generated using POPTREE2 softwareImage
Nov 4, 2025 7 tweets 3 min read
Ancient genomic evidence uncovers a 6th-century cross-border couple between South Asia and East Asia.

Highlights

•First genomic evidence of a 6th-century cross-border couple between South Asia and East Asia.

•Li Dan’s ancestry aligns with modern Brahmins, supporting his Brahmanic descent from epitaph records.

•Integration of genetics, archaeology, and history resolves complex ancestry in Silk Road era.

sciencedirect.com/science/articl…Image Fig. 1. The location and the archaeological information of Li Dan’s tomb. (A) The location of Li Dan’s tomb and the approximate geographical territories of Northern Zhou (572 CE) and Jibin. (B) Plan view of Li Dan’s tomb. (C) Epitaph of Li Dan. Please refer to the supplementary materials for detailed information and further explanation of the epitaph. (D) Incised drawings on the front end plate of the stone coffin. (E) Obverse and reverse of the gold coin from the reign of Emperor Justinian I of the Eastern Roman Empire.Image
Oct 19, 2025 6 tweets 2 min read
Youth bullying in ancient Greece Image Athenian culture was similarly highly competitive, especially among higher-status individuals Image
Oct 16, 2025 17 tweets 8 min read
Ancient genomes from eastern Kazakhstan reveal dynamic genetic legacy of Inner Eurasian hunter-gatherers

🧵

science.org/doi/10.1126/sc…Image 
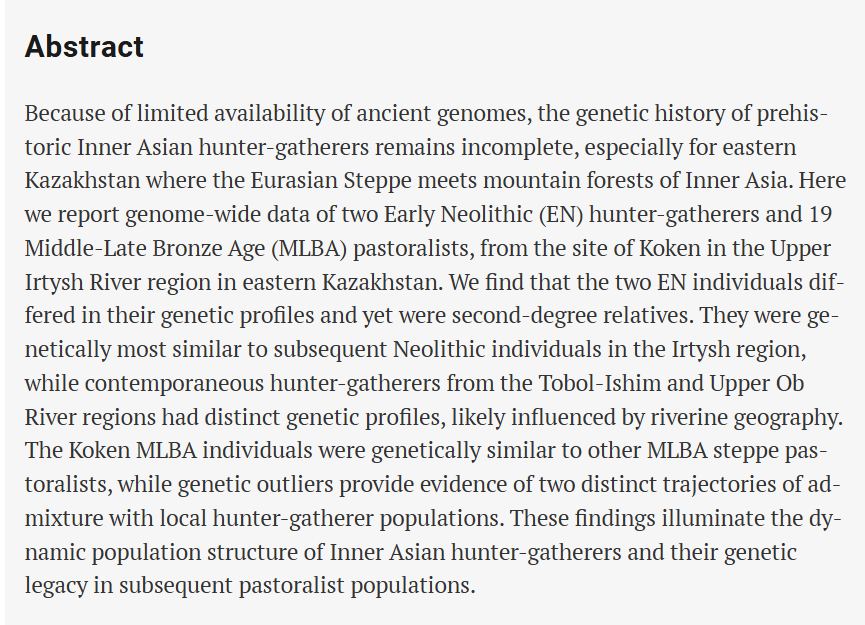
Archaeological site of Koken.

(A) Koken is a multiperiod site occupied since the Epipaleolithic in Abai region of eastern Kazakhstan (inset, green). The basemaps used in (A) are in the public domain and accessible through the Natural Earth website (naturalearthdata.com/downloads/10m-…; last accessed 3 March 2022). (B) Koken is situated in a semiarid steppe zone along the northern foothills of the Kokentau Mountains, and it falls within a biodiverse ecosystem of steppe grasslands, seasonal streams, birch and juniper groves, marshland, and mineral outcrops. (C) Excavation photograph of Burial 13 (KKBR13), a representative MLBA Andronovo culture cist grave surrounded by a stone fence containing the remains of individual KKN090. (D) Calibrated radiocarbon dates for individuals at Koken, showing 95.4% probability. The burials date broadly within the EN (green) and MLBA (yellow) periods. Dates were calibrated with OxCal v4.4.4 (99) using atmospheric data from Reimer et al. (55) (Photo Credit: P.D.D., Nazarbayev University).Image
Oct 9, 2025 4 tweets 2 min read
Mitochondrial (maternal) DNA diversity in northeast Iberians during the Iron Age

Highlights

•Ancient mtDNA reveals high maternal diversity in Iron Age Iberians.

•Haplogroups show continuity from the Bronze Age to the Iron Age in northeast Iberia.

•Subtle lineage differences found between Iberian groups, but no strong splits.

•Local ancestry dominated, with long-distance contacts shaping diversity.

sciencedirect.com/science/articl…Image 
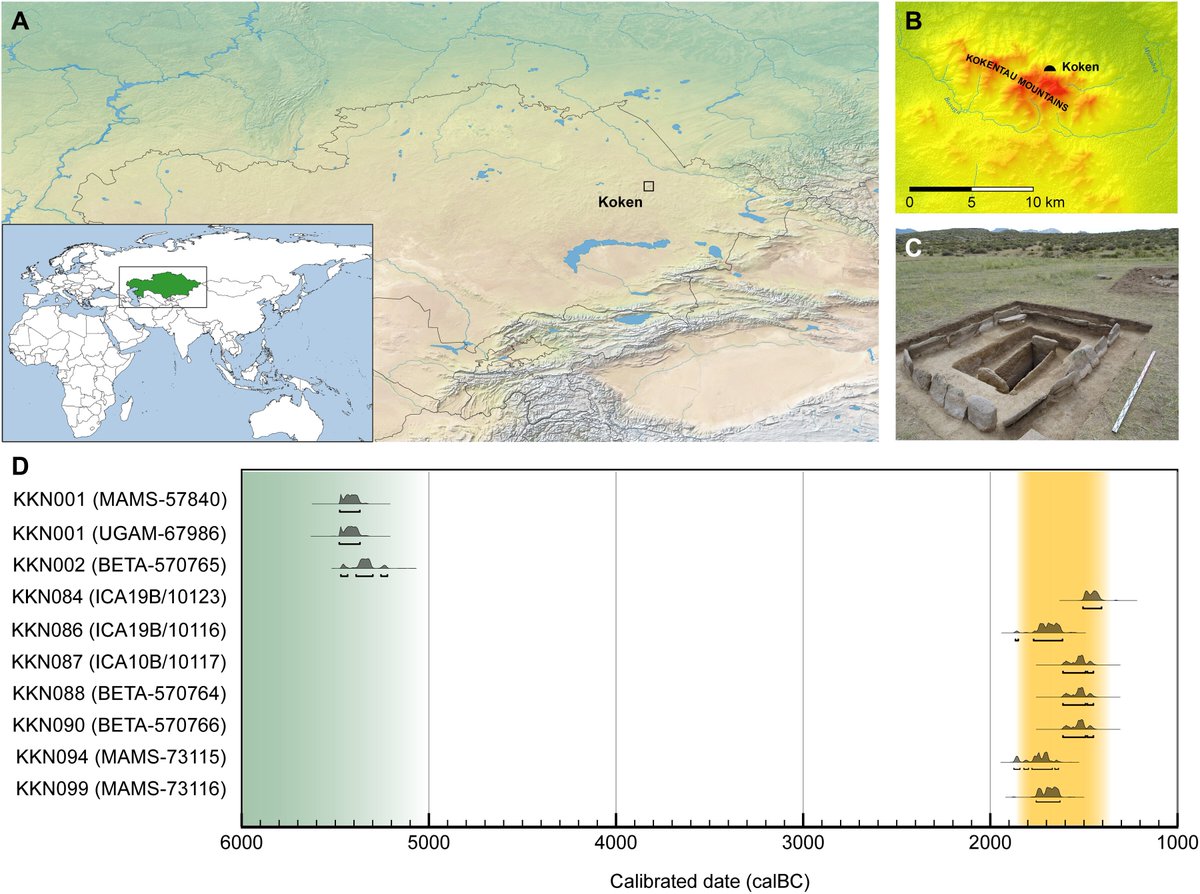
ENA project for data

ebi.ac.uk/ena/browser/vi…
Oct 6, 2025 14 tweets 5 min read
Most males in modern Poland carry Y-chromosomal lineages from clades that have recently expanded over Central, Eastern and South-Eastern Europe

link.springer.com/article/10.100… “The results of deep genotyping of 598 chromosome Y sequences from modern Poland and demonstrate that about 60% of Polish males can be assigned to subhaplogroups that are both relatively young and widely distributed among different Slavic populations, thus supporting the scenario in which Early Slavic mass migration and territorial expansion took place in the first millennium of the common era”
Sep 28, 2025 5 tweets 2 min read
Warfare and killings in the Neolithic Image 
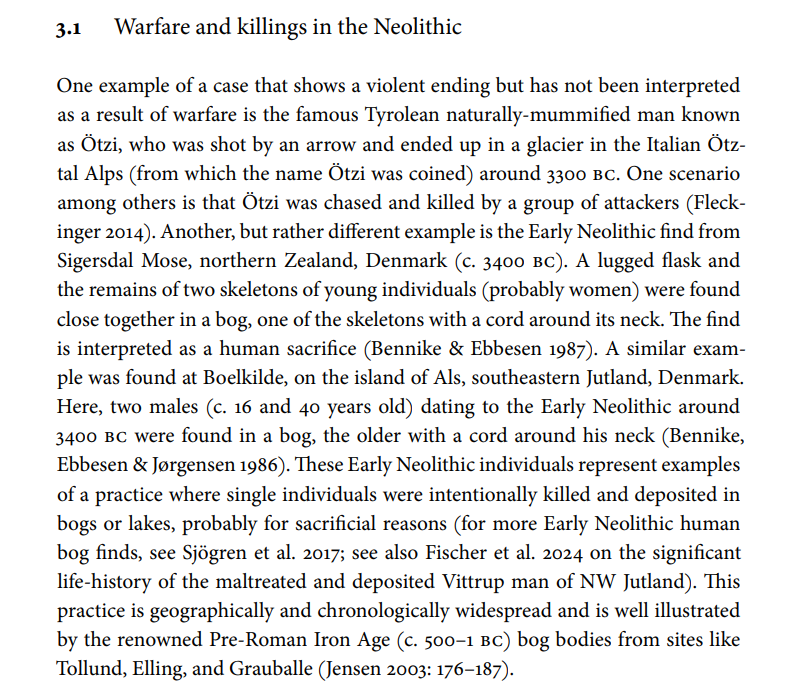
Warfare and ritual practices are thus closely intertwined as raids became a necessity for the cult Image
Image
Sep 27, 2025 6 tweets 3 min read
About half of Russian R1a carriers in the Volga-Oka region are descended from a pre-Slavic population, suggesting that the Slavs did not fully replace the autochthonous population but rather mostly culturally assimilated the Meshchyora documented in the Russian chronicles and other local tribes

"Pre-Slavic and Slavic Interaction at Eastern Periphery of Slavic Expansion in Northeastern Europe (Y-Gene Pools of Volga-Oka Region)"

mdpi.com/2073-4425/16/1…Image Table 1. Frequencies of Y-chromosome haplogroups (%) in the indigenous populations of the Volga-Oka region (Russians from the east of the Ryazan region and Mordovia’s Erzya, Shoksha and Moksha).

Note. Data meeting the 5% allele frequency criterion is highlighted in bright red. Haplogroups are arranged in the descending order of their frequencies in the gene pool of the Volga-Oka region. “Shoksha” is an arbitrary name for the Erzyan population from Tengushevsky district in the north-west of Mordovia.Image