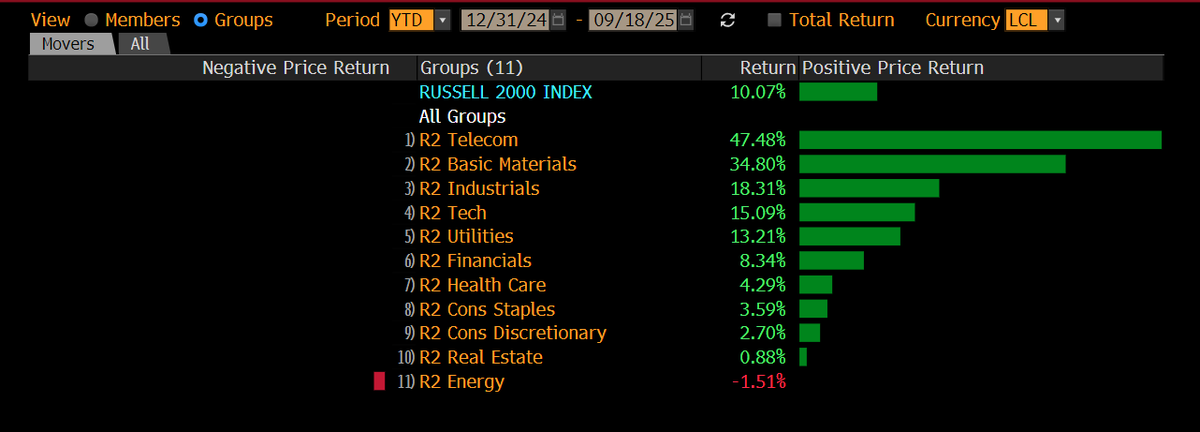
The Russell is setting up for an imminent breakout to all-time highs
This is on the back of the Fed rate cut and is hurling the market toward an unsustainable melt-up
This will set the stage for larger risks
Here is the full playbook for navigating it: 🧵👇
This is on the back of the Fed rate cut and is hurling the market toward an unsustainable melt-up
This will set the stage for larger risks
Here is the full playbook for navigating it: 🧵👇

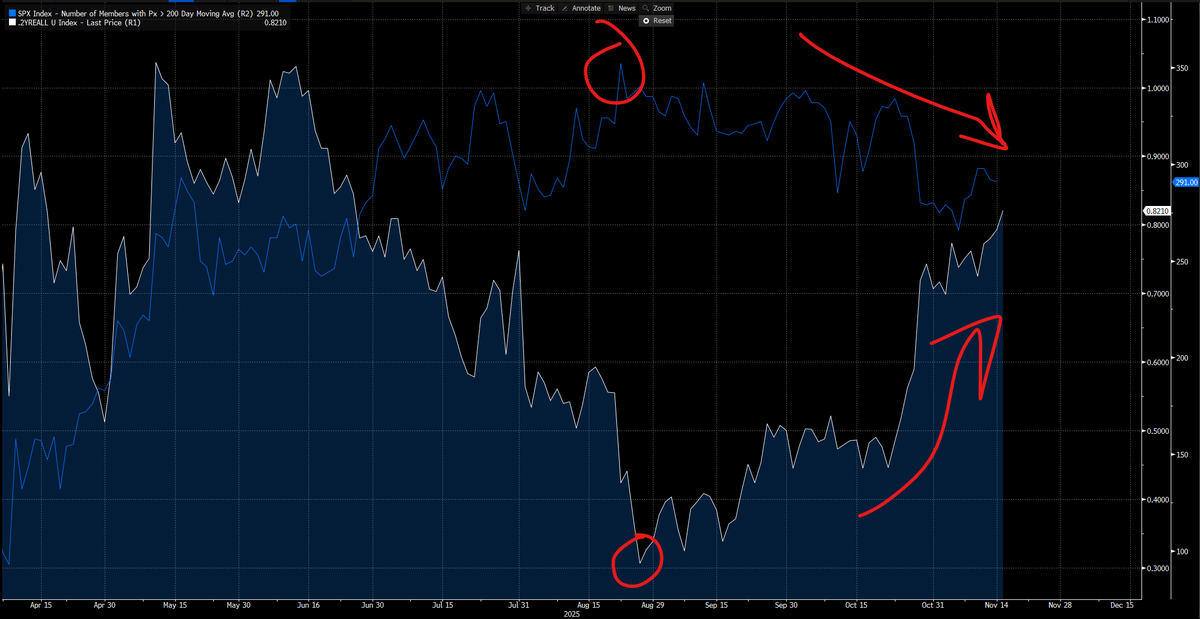
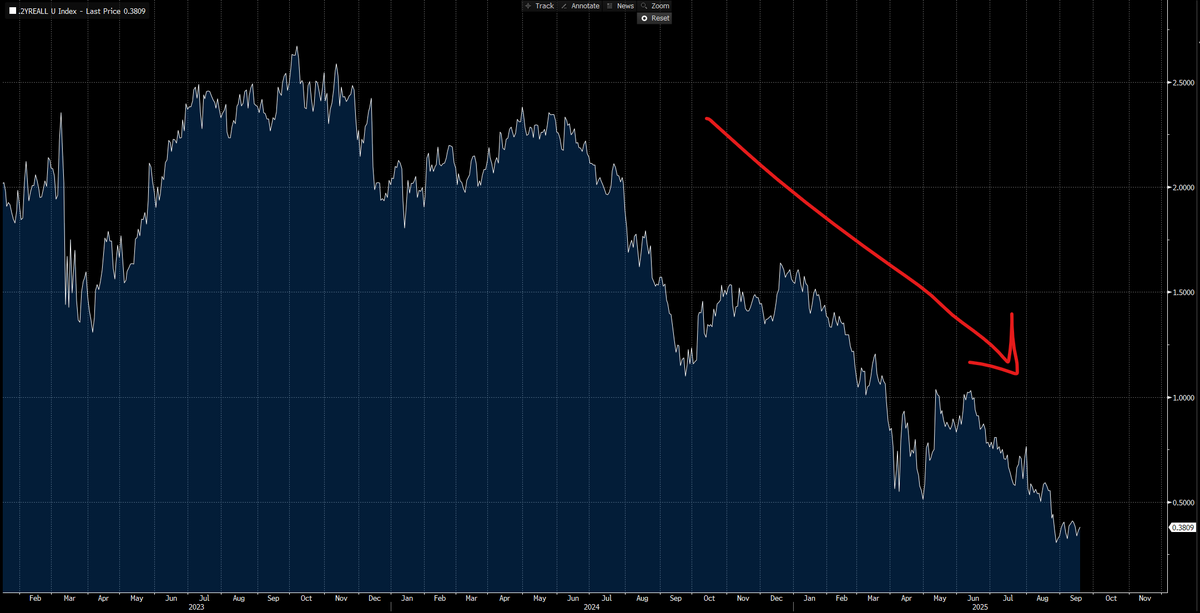
We have been in a melt-up with the Russell for a while now because the curve is steepening as real rates are falling. In simple terms, nominal growth remains positive and liquidity is increasing.
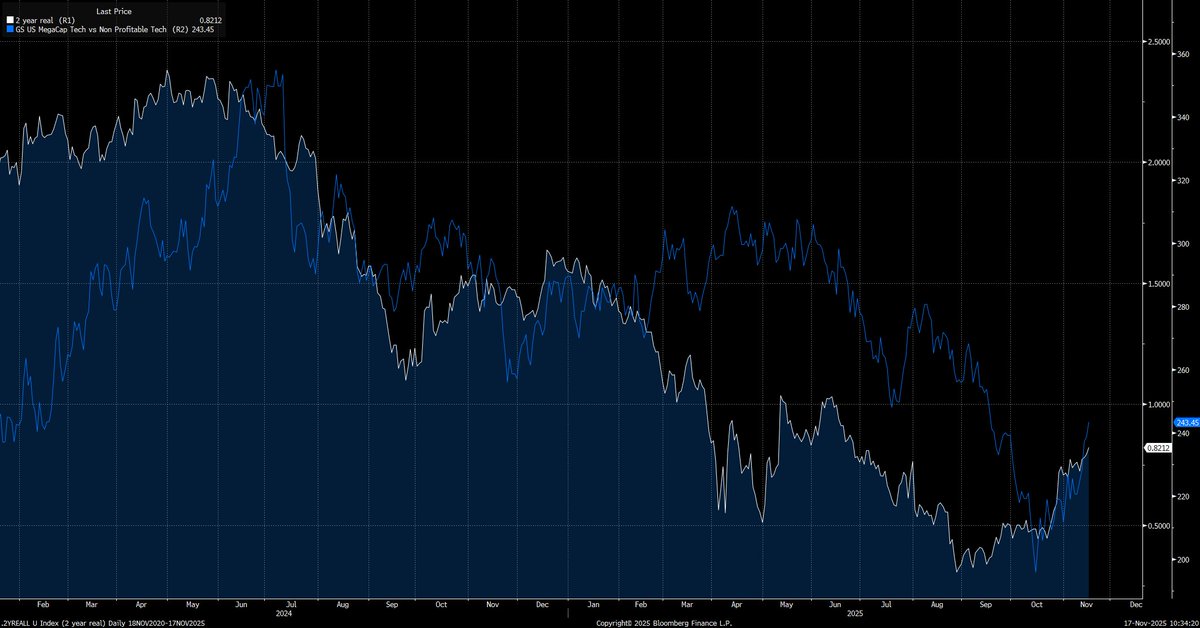
When real rates are falling into positive growth, risk assets fuction as a release valve and capital moves out the risk curve
When real rates are falling into positive growth, risk assets fuction as a release valve and capital moves out the risk curve
This is why we have seen a convergence of all these factors post FOMC which I noted in the video breakdown and connected playbooks here
https://x.com/Globalflows/status/1968471239422566667
The result of this environment is MASSIVE gains in the Russell 2000 sectors. Anyone telling you a recession or market crash is imminent is blatantly ignoring the factor that the worst companies with the highest sensitivity to the economy are doing amazing
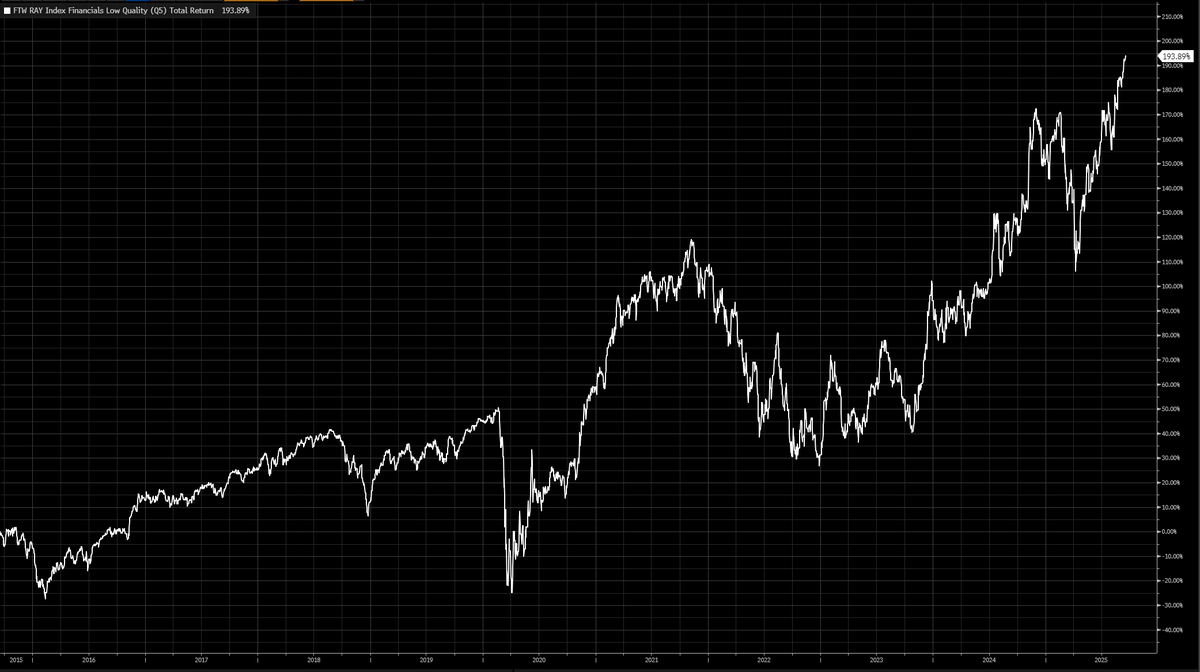
The lowest quality financial companies in the Russell are at all time highs right now
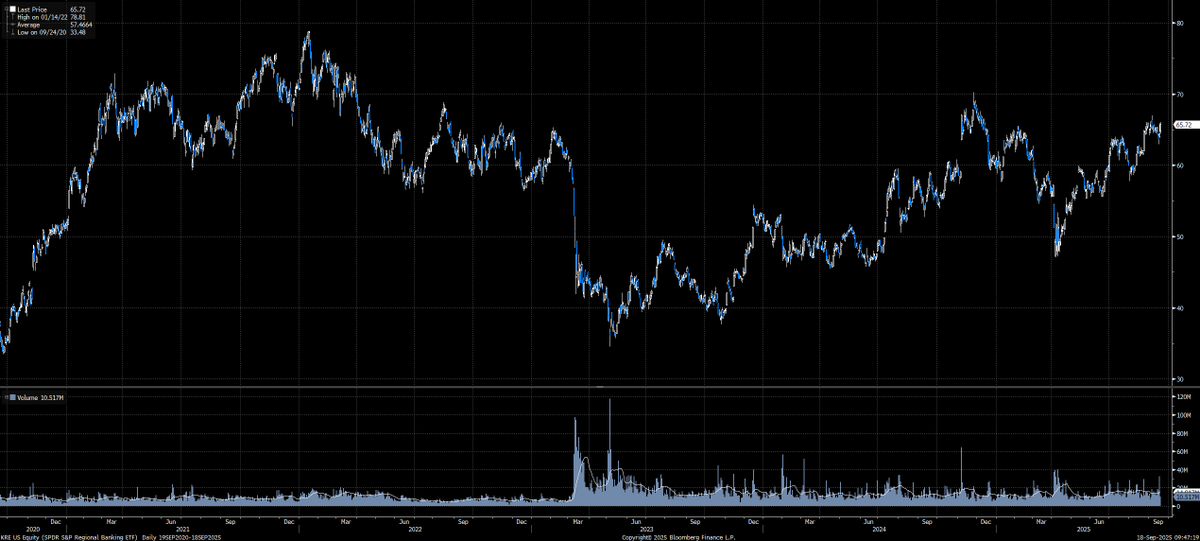
The regional banking sector is poised for a breakout:
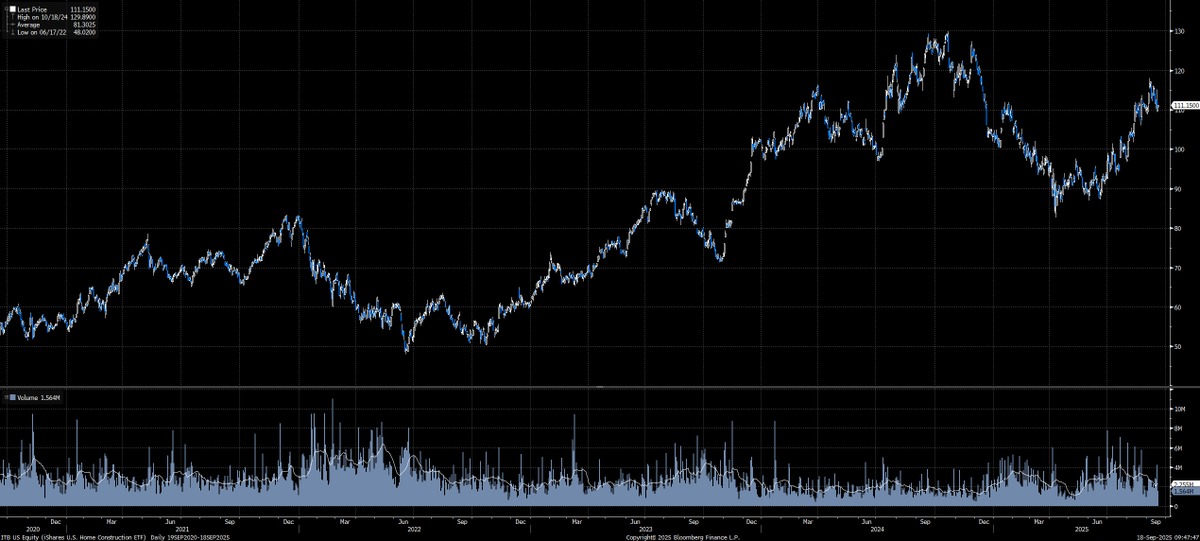
And homebuilders keep rallying off their lows
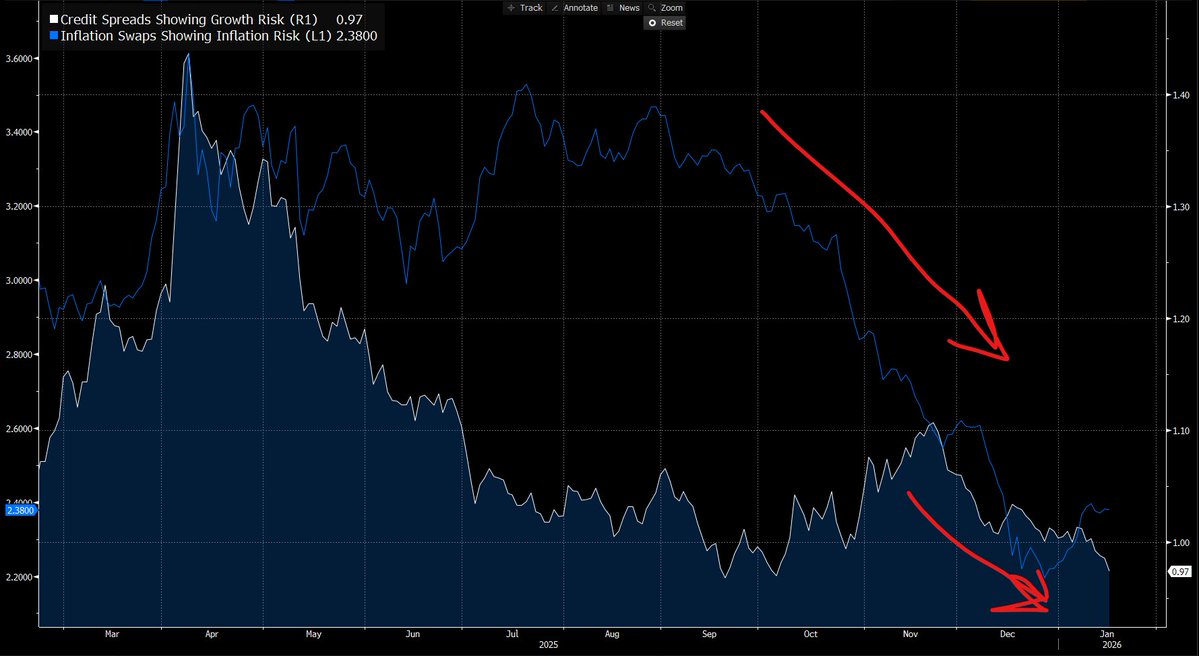
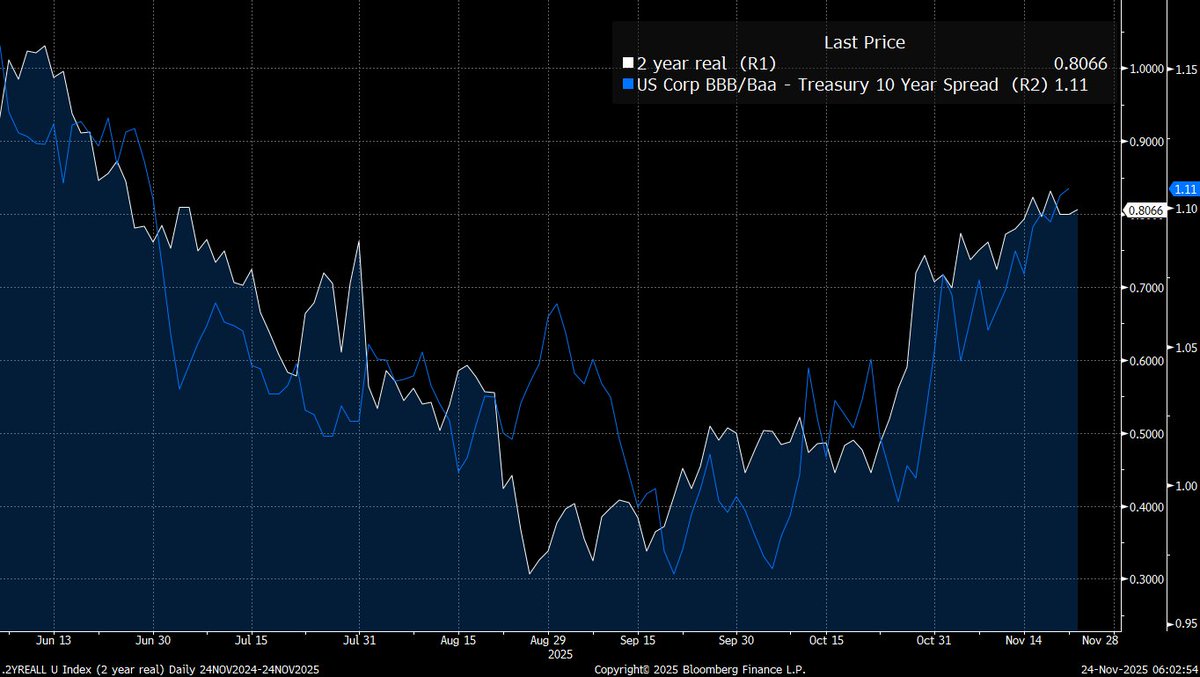
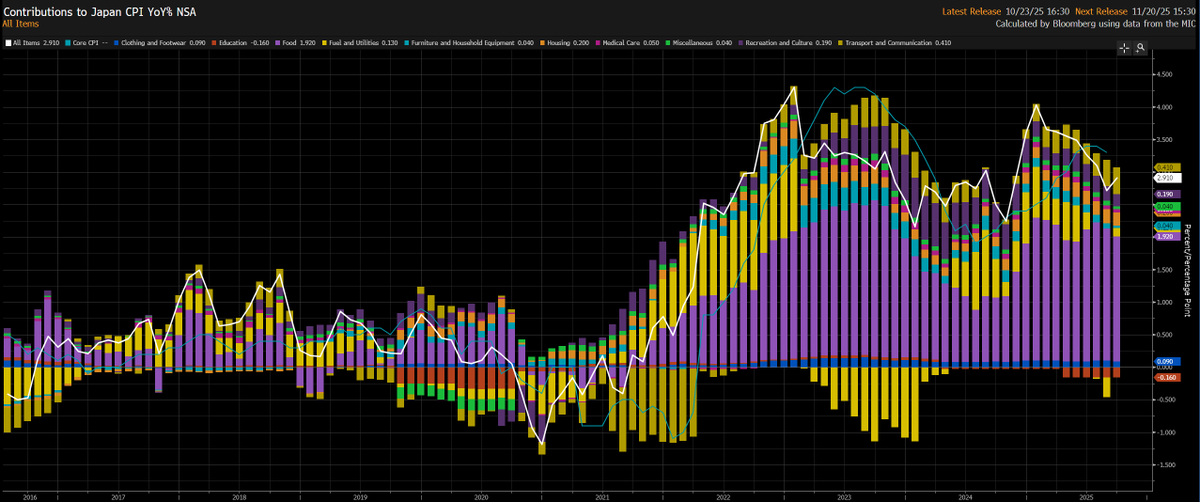
We are now seeing the Fed cut into the massive spread between inflation swaps and credit spreads. In simple terms, credit spreads are at cycle lows, representing the loose financial conditions and resilience in growth. Inflation swaps are above 3% showing that inflation risk is elevated.
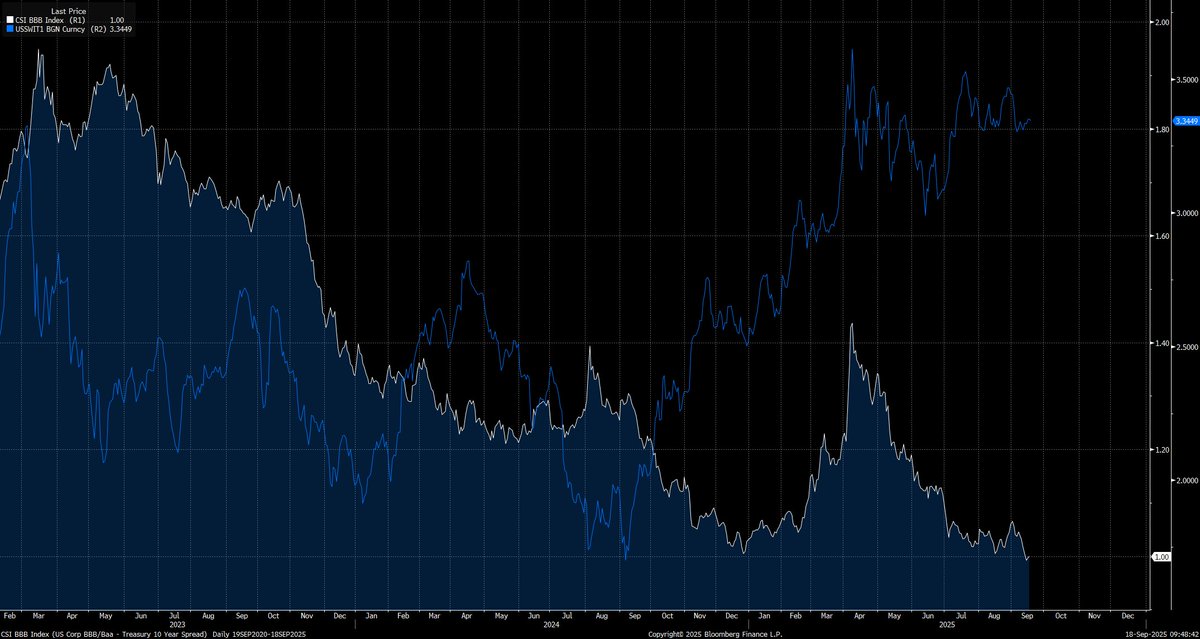
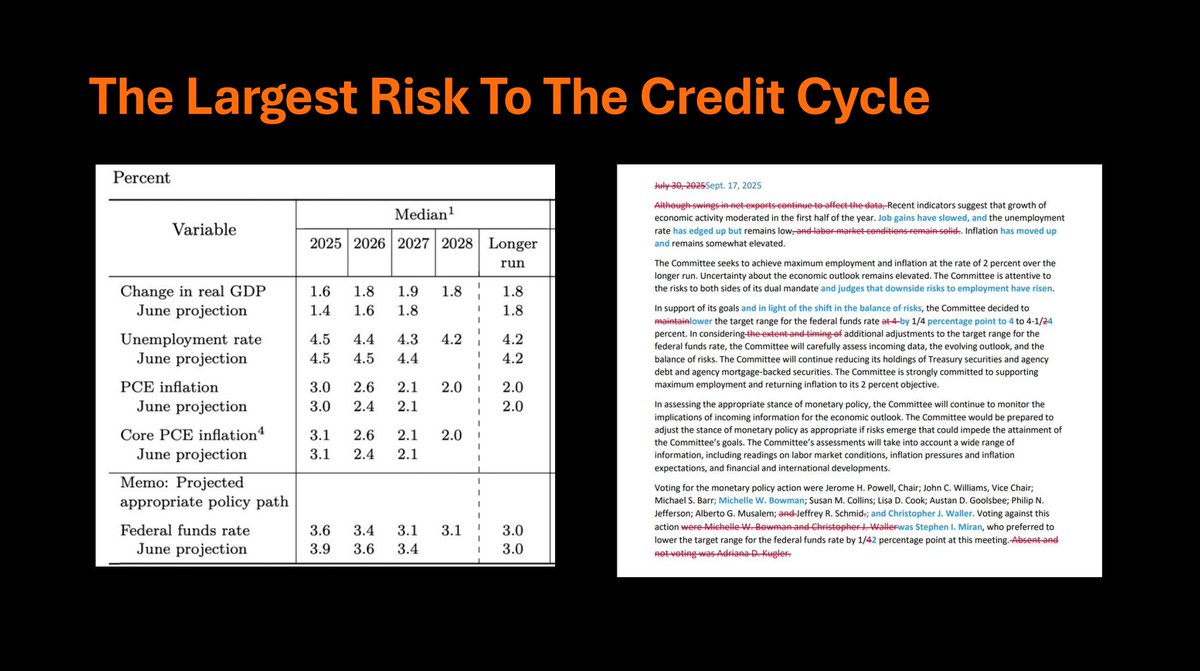
What does the Fed do? They revise up their growth expectations, keep their inflation expectations flat and cut into resilient growth
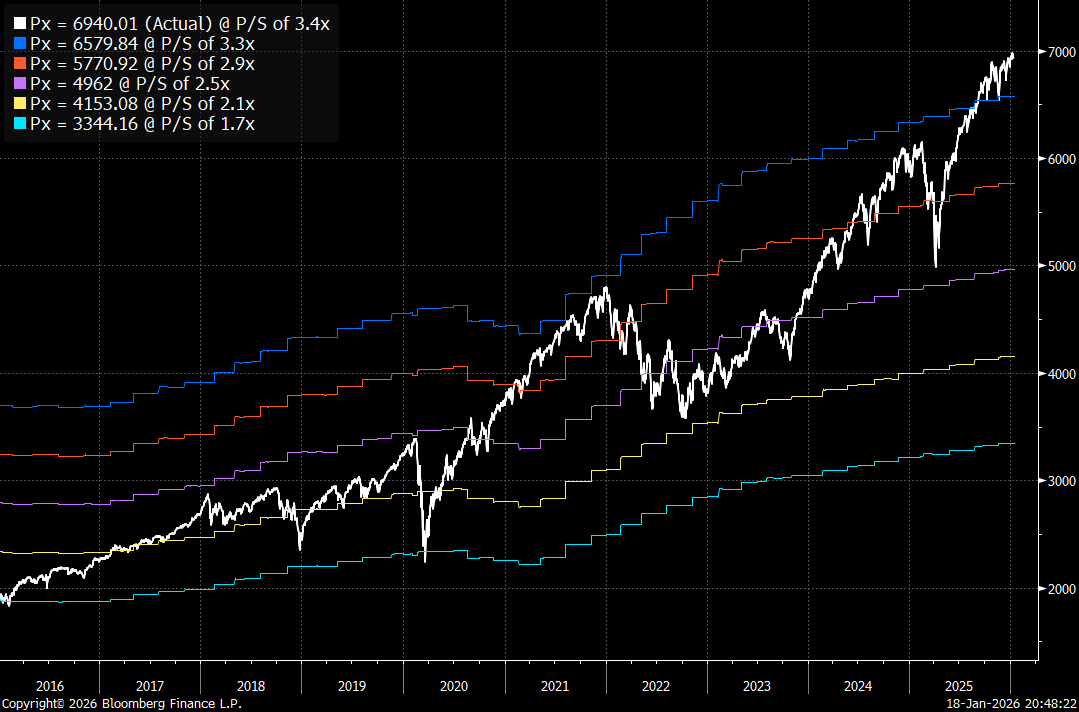
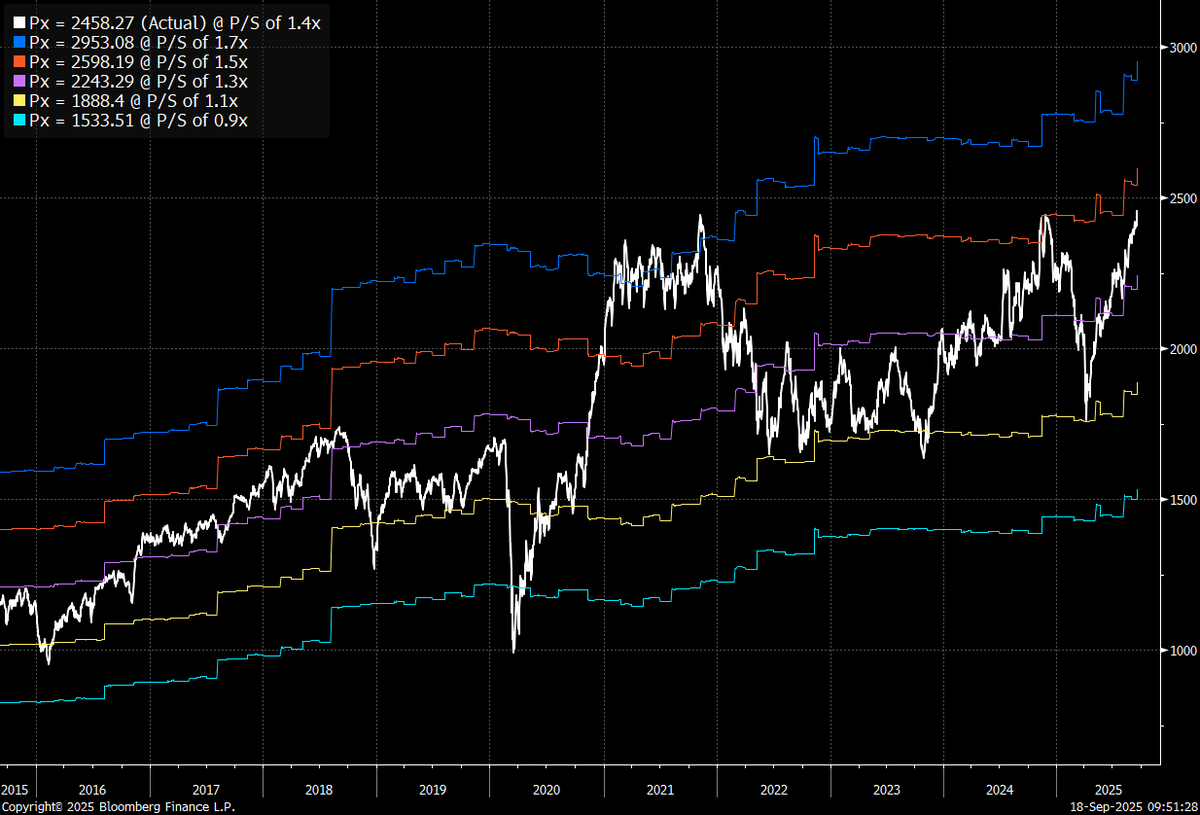
This is the same playbook as 2021 except at a higher base of interest rates. This TYPE of liquidity injection sows the seed of its own demise as the Russell begins to expand in its valuations closer to 2021 levels
So the entire question everyone wants to know is WHEN will this melt up end and HOW HIGH can we go?
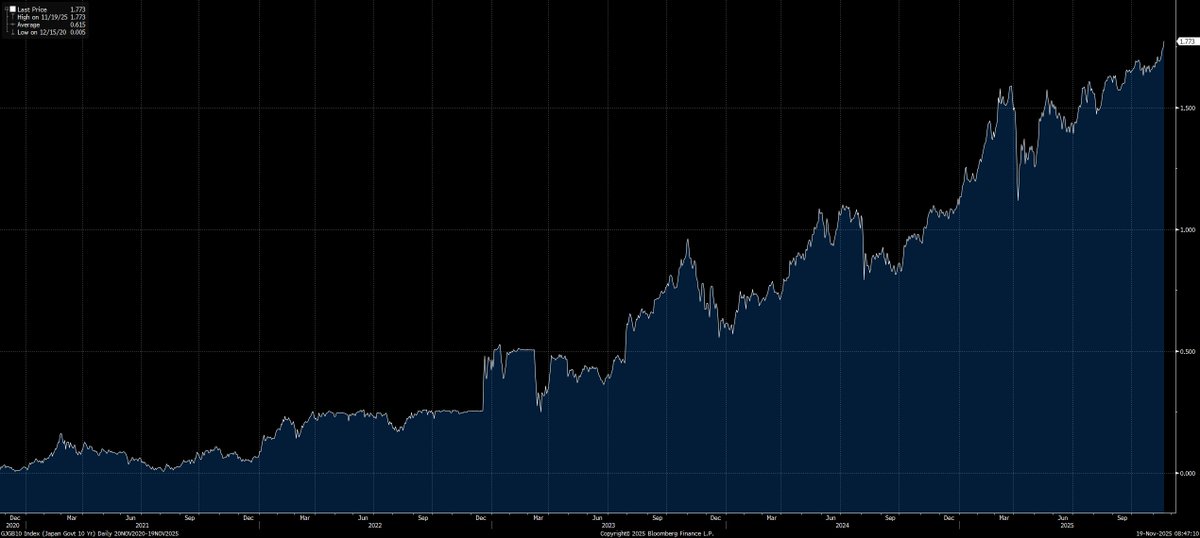
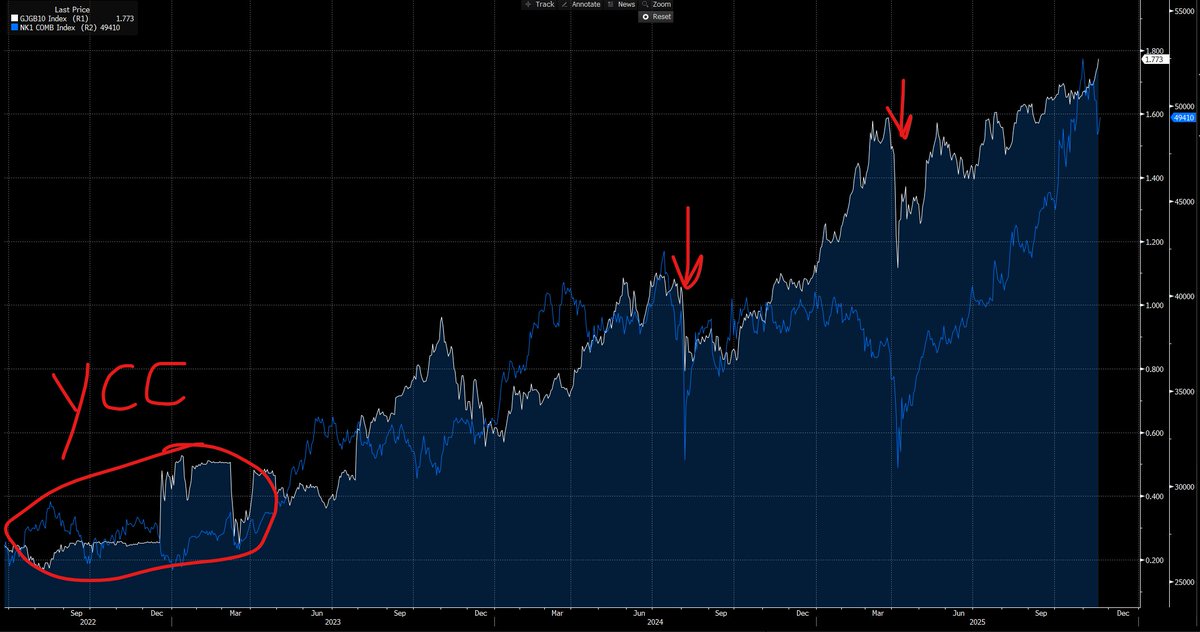
Let me just say at the beginning of this, the Nikkei rallied for a decade into the melt-up they experienced during the 80s. In the 70s, the Nikkei had a 91% year
Let me just say at the beginning of this, the Nikkei rallied for a decade into the melt-up they experienced during the 80s. In the 70s, the Nikkei had a 91% year
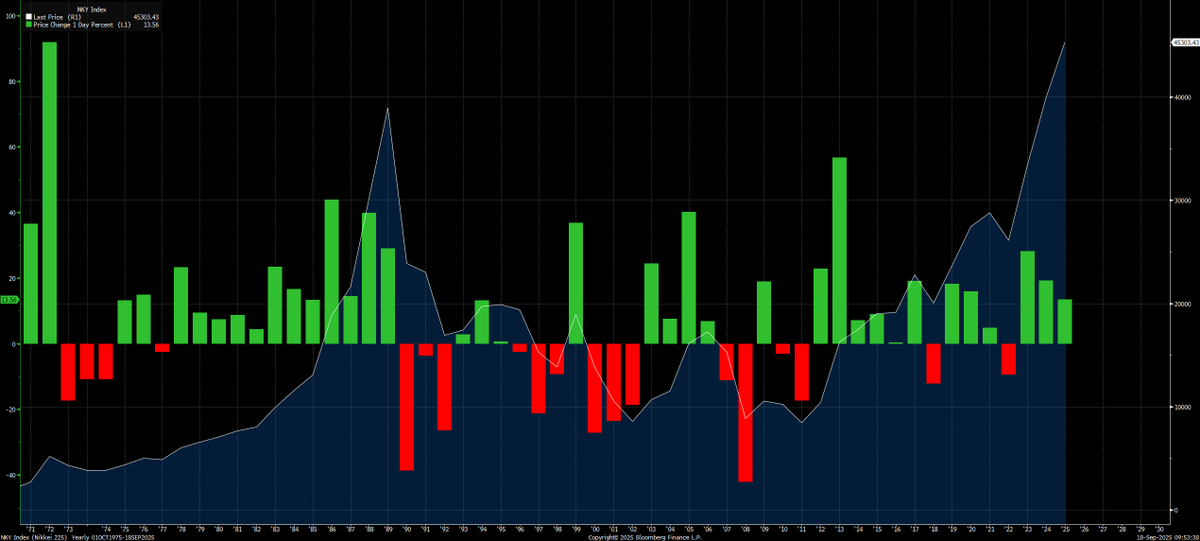
If you think the upside is limited, just know we can go much MUCH higher before we go lower.
I have already laid out all of the playbooks for mapping the credit cycle as well as spreadsheets to measure every economic data point (these are all free here: ) capitalflowsresearch.com/p/research-syn…
I have already laid out all of the playbooks for mapping the credit cycle as well as spreadsheets to measure every economic data point (these are all free here: ) capitalflowsresearch.com/p/research-syn…

You can find the two excel models that map all major economic datapoints for this period of time here:
capitalflowsresearch.com/p/macro-regime…
capitalflowsresearch.com/p/macro-regime…
There are 3 major signals you need to watch in order to map WHEN the melt up is losing strength and when moving to cash is THE play. These apply to all risk assets, including equities, crypto, real estate, or any type of private equity investment.
1) Capital needs to begin to move BACK across the risk curve as the yield curve steepens. We don't know if the source of the the crash will be from bear steepening or bull steepening because its unclear if long end rates blowing out will be the source of the crash.
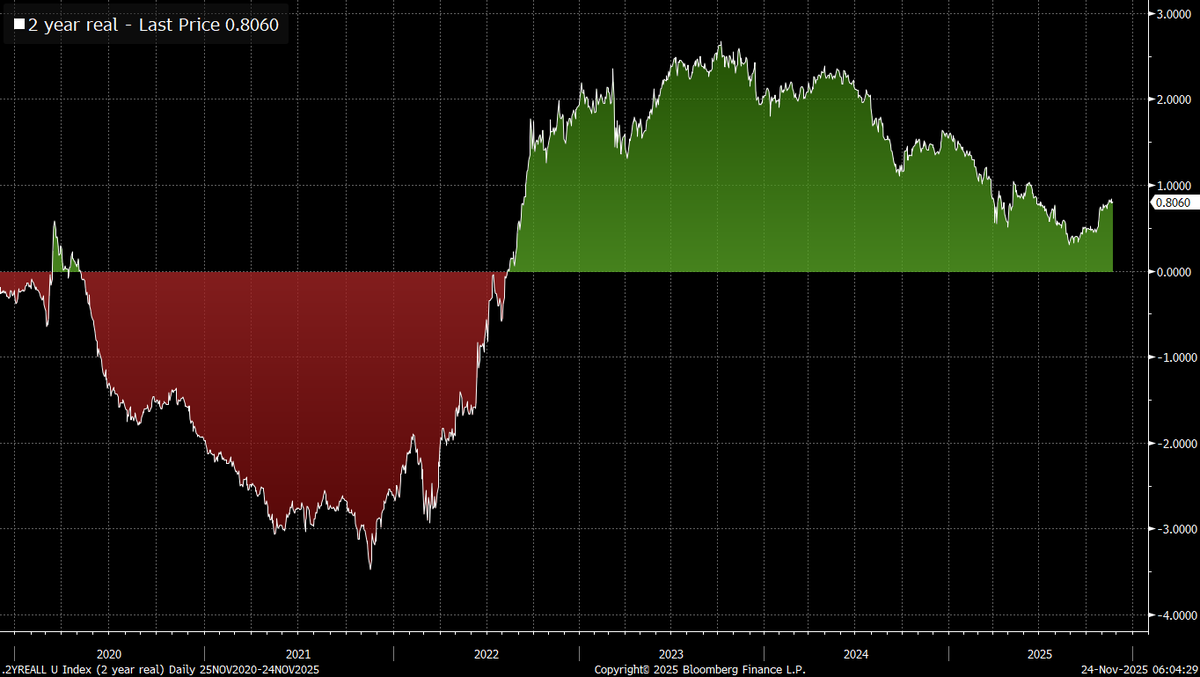
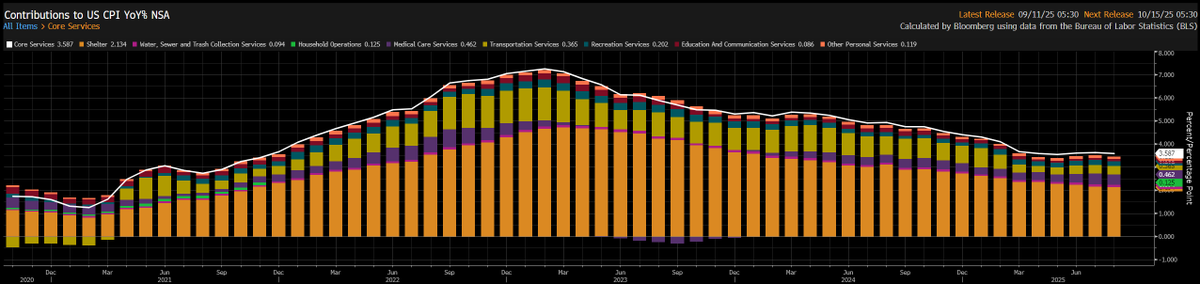
Simply put, the Fed is cutting into resilient growth and core services above 3%. This creates a higher probability of inflation rising.
The Fed can cut rates to zero but the long end will always price its mistake.
If long end rates rise, then it will cause the curve to bear steepen and this could create significant issues for equities and the underlying economy.
WE AREN'T HERE YET!
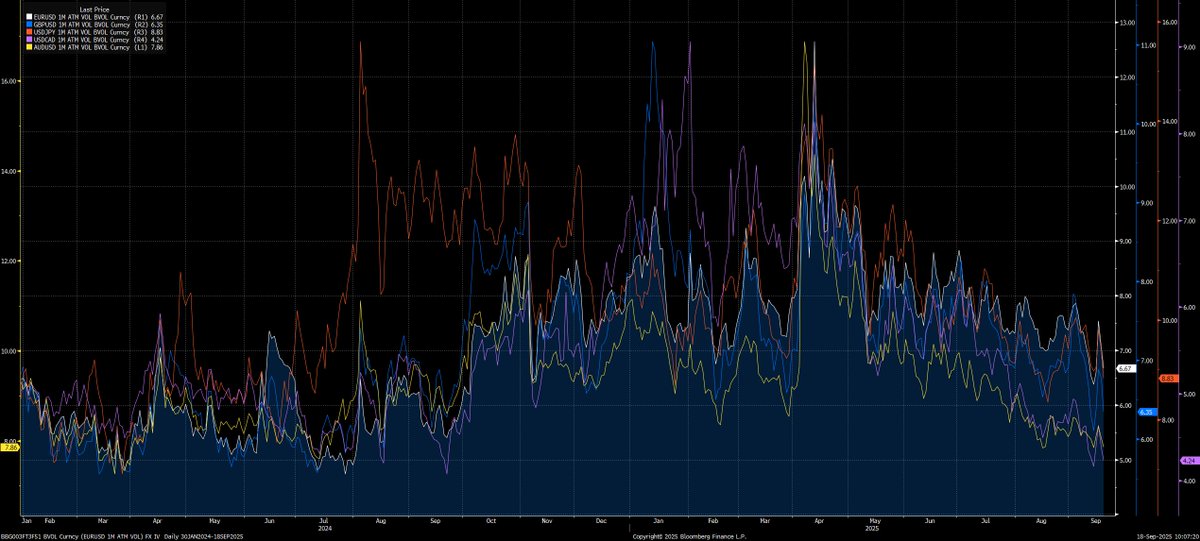
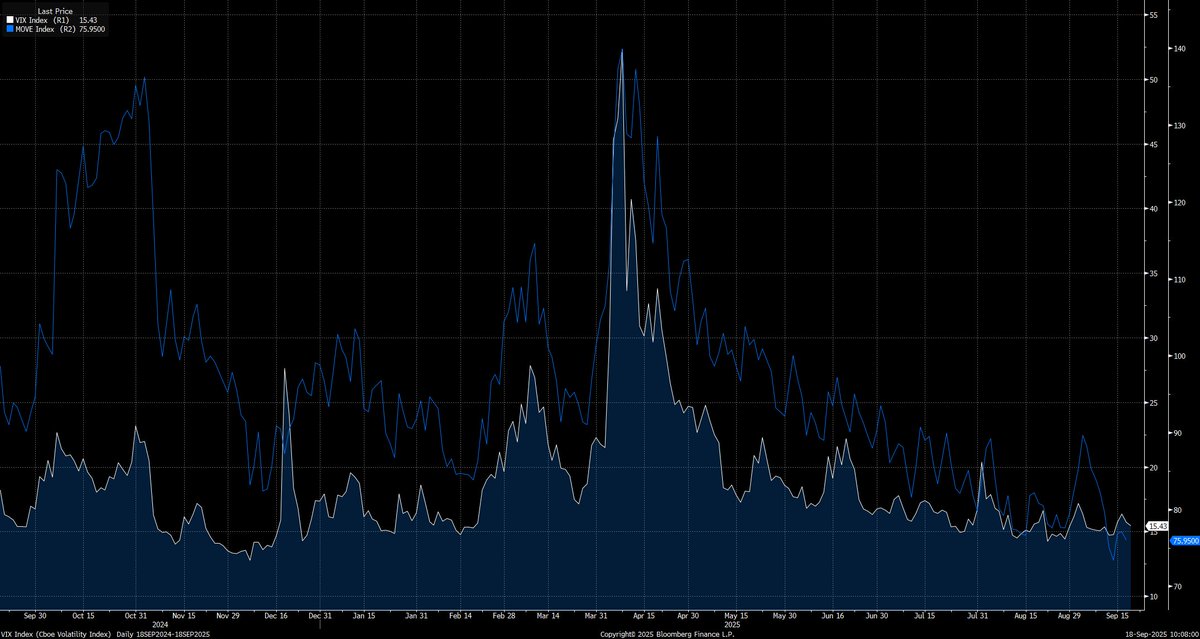
2) We need to see cross asset volatility rise as carry trades unwind, bond position shifts and the VIX rises. (NOT HAPPENING RIGHT NOW)
When volatility rises, we need to see the DRIVER of the volatility have persistence behind it as opposed to one off shocks. This is what brings us to the third point.
When volatility rises, we need to see the DRIVER of the volatility have persistence behind it as opposed to one off shocks. This is what brings us to the third point.
3) We need to see a clear shift in the macro regime with economic data moving into contractionary growth from either disinflation or stagflation. If we have disinflation, it will cause the curve to bull steepen (depending on the Fed but the Fed keeps begin ahead of the curve in this cycle) and if we move into stagflation then its likely to bear steepen (especially in 10s30s)
Clear shifts in macro data take place across ALL economic datapoints, sector rotations, and earnings. No one in macro that is managing risk is using a few NFP revisions to make any decisions. I explained WHY the NFP revisions are not a massive concern yet in this report: capitalflowsresearch.com/p/macro-report…
Clear shifts in macro data take place across ALL economic datapoints, sector rotations, and earnings. No one in macro that is managing risk is using a few NFP revisions to make any decisions. I explained WHY the NFP revisions are not a massive concern yet in this report: capitalflowsresearch.com/p/macro-report…
Macro inflection points are historically characterized by a shift in volatility, shift in correlations, and an underlying driver that has persistence.
Cross-border flows and the balance sheet of this economy is going to play an outsized role on the UPSIDE AND DOWNSIDE which I have laid out in the macro reports
here capitalflowsresearch.com/p/macro-report…
and here: capitalflowsresearch.com/p/macro-report…
Cross-border flows and the balance sheet of this economy is going to play an outsized role on the UPSIDE AND DOWNSIDE which I have laid out in the macro reports
here capitalflowsresearch.com/p/macro-report…
and here: capitalflowsresearch.com/p/macro-report…
If we pull all of these moving parts together, the implication is clear, the melt up is still on. Equities and risk assets remain skewed to the upside but the risks are building because the policy error by the Fed is sowing the seeds for a future crash. The signals for this crash are clear. Until we begin to see these signals take place so that the risk reward in equities is neutral, I remain long.
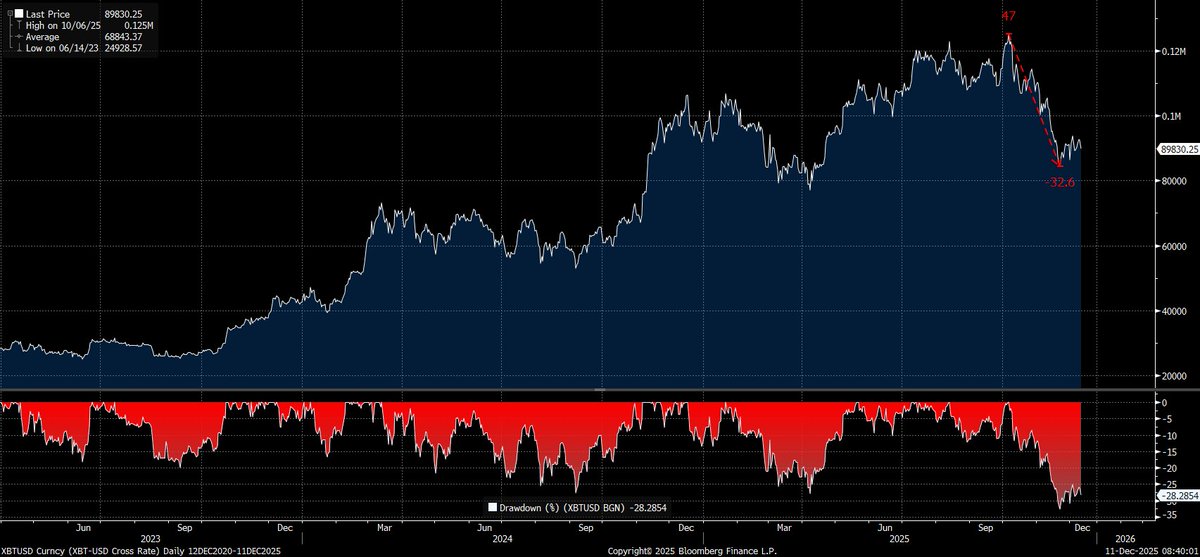
My strategy pulls together all of these moving parts and runs trades in real time. I remain long equities and will continue to run longs across the risk curve until my strategy shifts to neutral. Once things shift bearish, I will start running shorts in equities, Bitcoin, and anything that will go down.
This won't end well but for now we remain in melt up mode
welcome to global macro
welcome to global macro

Everything is laid out in this video and the connected reports
https://x.com/Globalflows/status/1968471239422566667
• • •
Missing some Tweet in this thread? You can try to
force a refresh