1/25 The GraphCall Credit quality vs spread metric
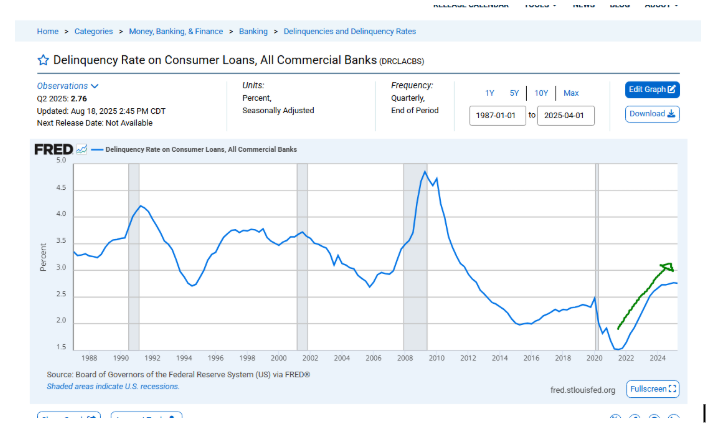
Watching the consumer delinquencies rise is worrying but it is not per se at a very high record (although some adjustments in those calculations are coming and BNPL have data silo issues)....
Are the credit spreads reflecting that properly?
Watching the consumer delinquencies rise is worrying but it is not per se at a very high record (although some adjustments in those calculations are coming and BNPL have data silo issues)....
Are the credit spreads reflecting that properly?
2/25
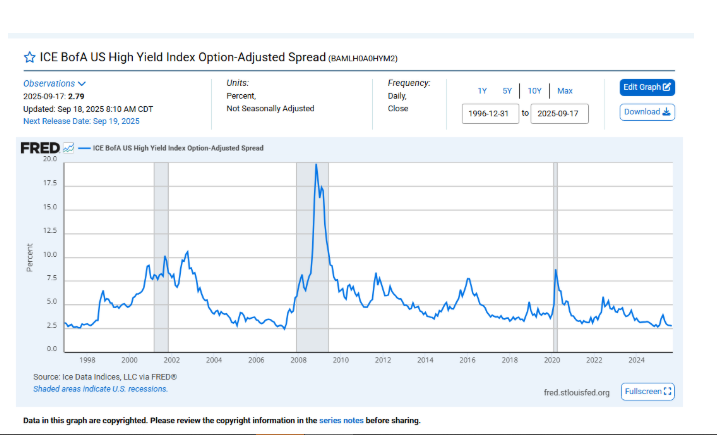
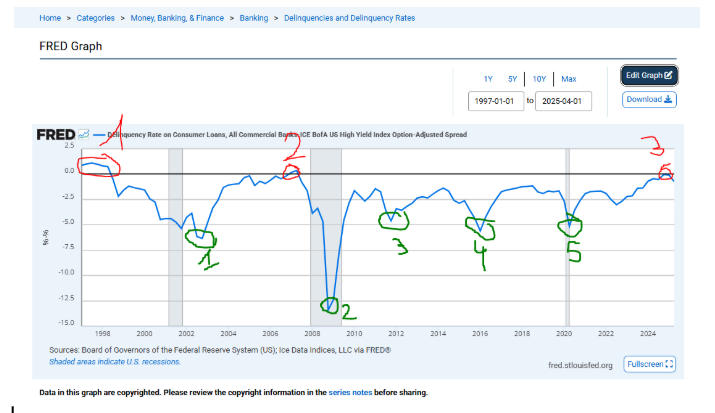
Those are the credit spreads
Those are the credit spreads
3/25
RATIONALE:
In other words if the consumer delinquencies are low but the credit spreads are low it sounds rather rational.
If the delinquencies are high but the credit spreads are ALSO high then there it also sounds rather rational
RATIONALE:
In other words if the consumer delinquencies are low but the credit spreads are low it sounds rather rational.
If the delinquencies are high but the credit spreads are ALSO high then there it also sounds rather rational
4/25
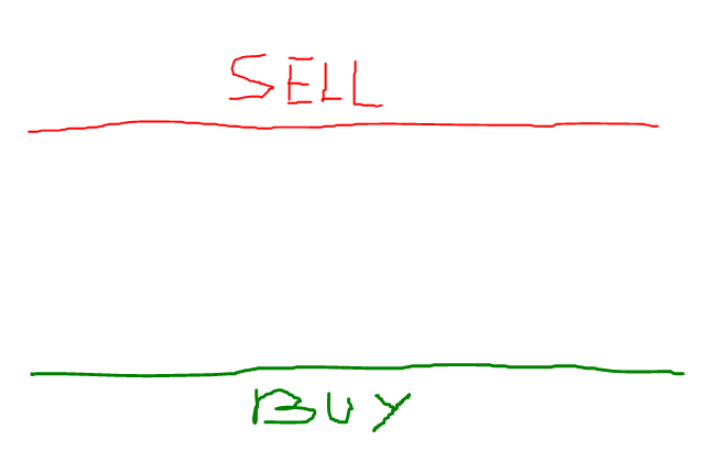
OVERSHOOTING HIGH:
If the delinquencies (a) are high but the credit spreads are tight (b), then it gives a high number.
It means irrationally bidding for garbage.
and that is a sell.
Because the (credit spreads are too tight vs credit quality)
OVERSHOOTING HIGH:
If the delinquencies (a) are high but the credit spreads are tight (b), then it gives a high number.
It means irrationally bidding for garbage.
and that is a sell.
Because the (credit spreads are too tight vs credit quality)
5/25
OVERSHOOTING LOW:
If the delinquencies (a) are low but the credit spreads are very high (b);
It gives a low number and that’s a buy (spreads too wide vs credit quality)
OVERSHOOTING LOW:
If the delinquencies (a) are low but the credit spreads are very high (b);
It gives a low number and that’s a buy (spreads too wide vs credit quality)
6/25
RESULT EXPECTED?
RESULT EXPECTED?
7/25
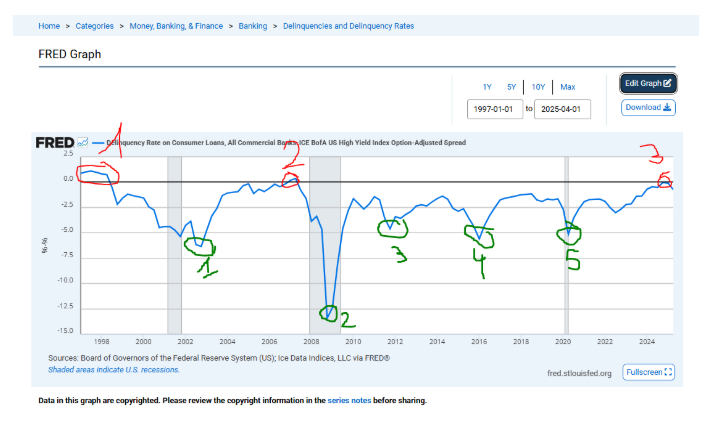
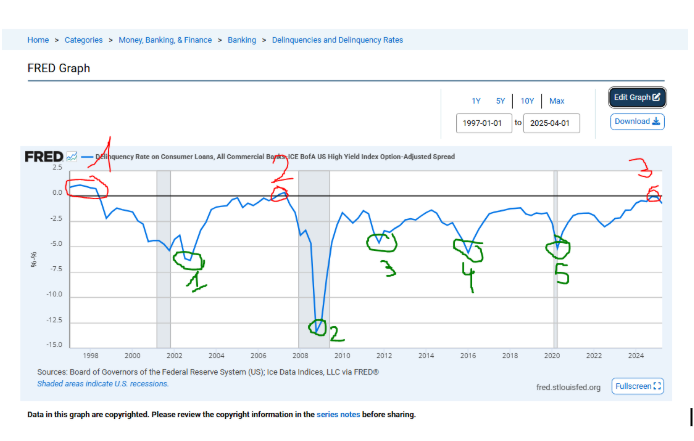
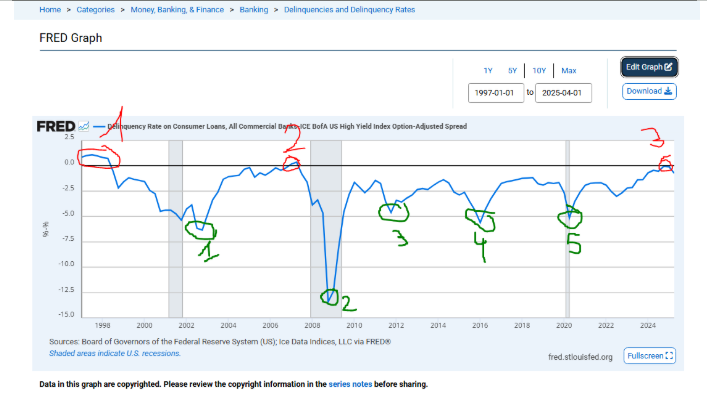
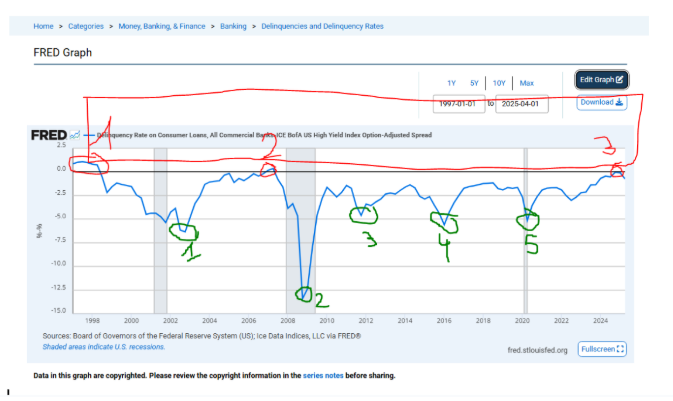
ACTUAL RESULTS:
Alright so let’s see if this simple logical approach has any echo in past situations so we take the consumer delinquencies and we subtract the credit spread.
It worked 6 times out of 7.
ACTUAL RESULTS:
Alright so let’s see if this simple logical approach has any echo in past situations so we take the consumer delinquencies and we subtract the credit spread.
It worked 6 times out of 7.
8/25
The first instance (one red) fails miserably it indicates a high in Q3 1997, maybe that's why Druck got short too early?
The first instance (one red) fails miserably it indicates a high in Q3 1997, maybe that's why Druck got short too early?

9/25
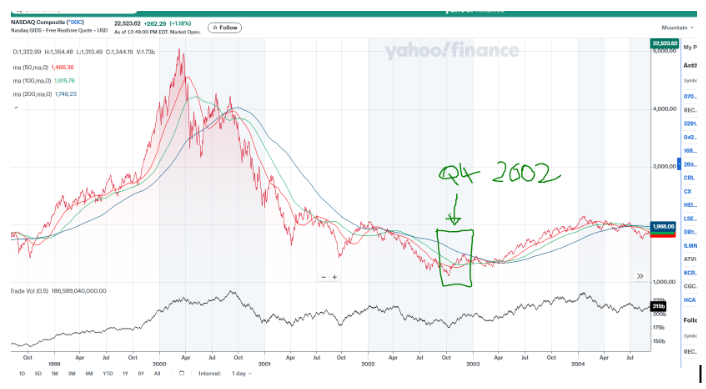
The Bottom on Q4 2002 was quite good however (1 green)
The Bottom on Q4 2002 was quite good however (1 green)
10/25
The second peak (2 red) ?
The second peak (2 red) ?
11/25
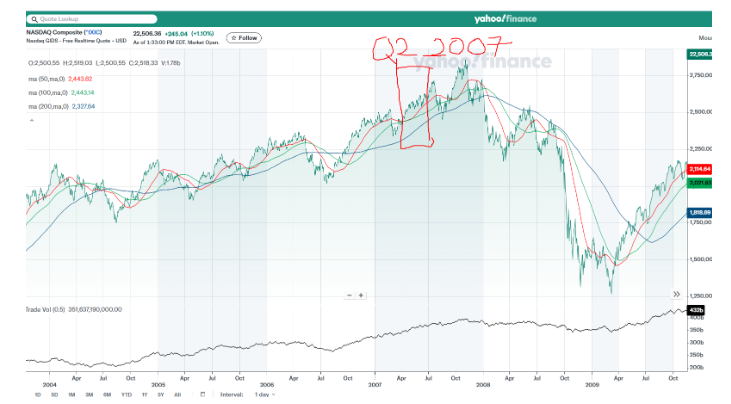
Awesome Q2 2007. Works great.
Awesome Q2 2007. Works great.
12/25
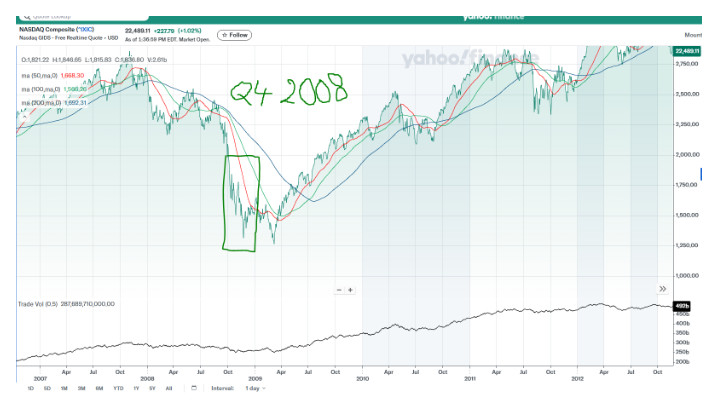
Second Bottom? Q4 2008
Second Bottom? Q4 2008
13/25
Great
The bottom are in sync not delayed, it’s bottoming in Q4 2008
Great
The bottom are in sync not delayed, it’s bottoming in Q4 2008
14/25
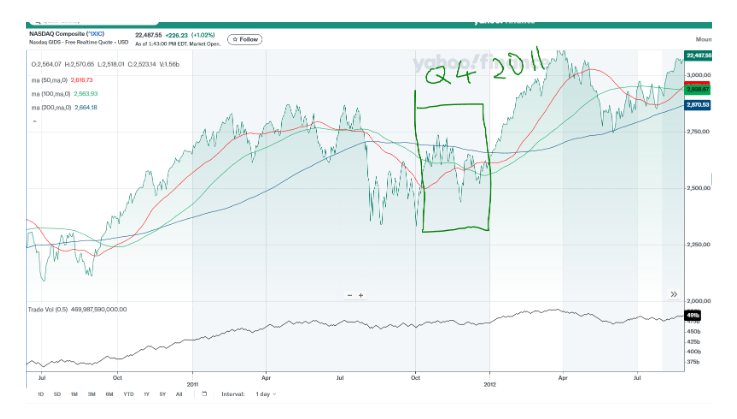
The intermediary bottom in 3 is Q4 2011
The intermediary bottom in 3 is Q4 2011
15/25
Works
Works
16/25
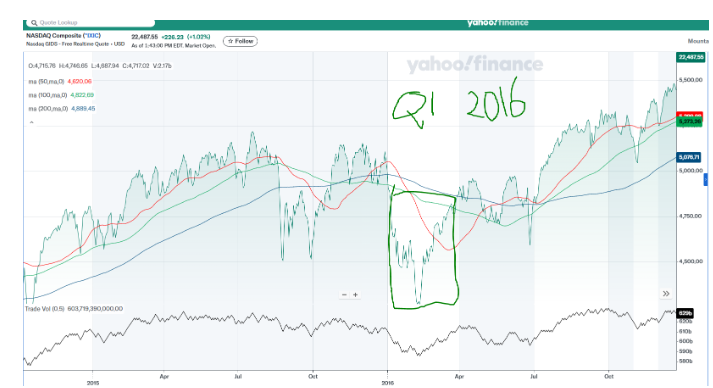
The intermediary bottom 4 is in Q1 2016
The intermediary bottom 4 is in Q1 2016
17/25
Works
Works
18/25
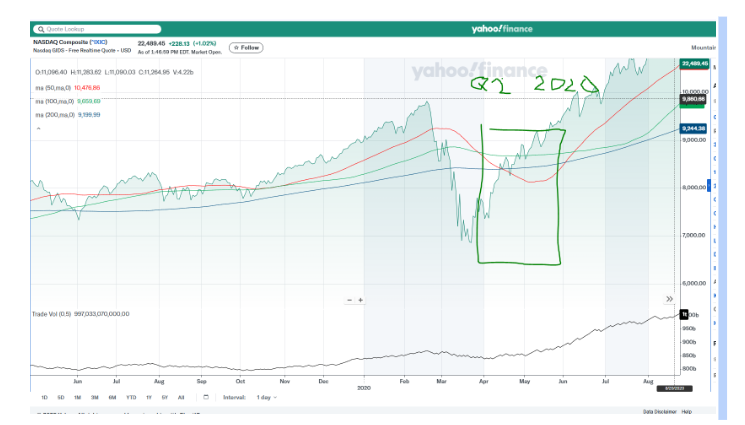
The next bottom 5 is Q2 2020
The next bottom 5 is Q2 2020
19/25
It is slightly late, by a few months
It is slightly late, by a few months
20/25
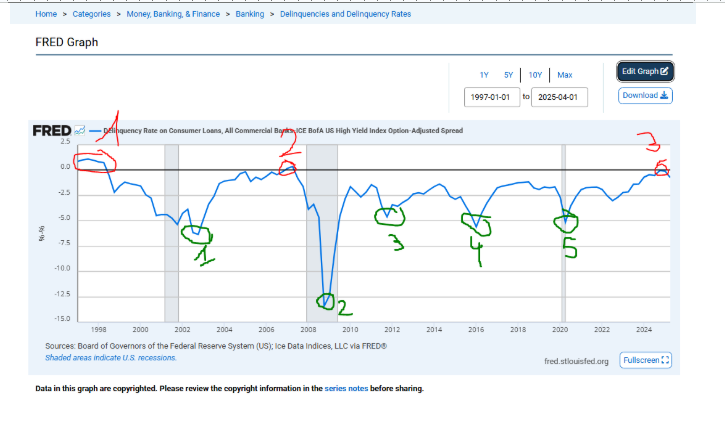
But where are we now?
We are in TOP 3 and reversion.
But where are we now?
We are in TOP 3 and reversion.
21/25
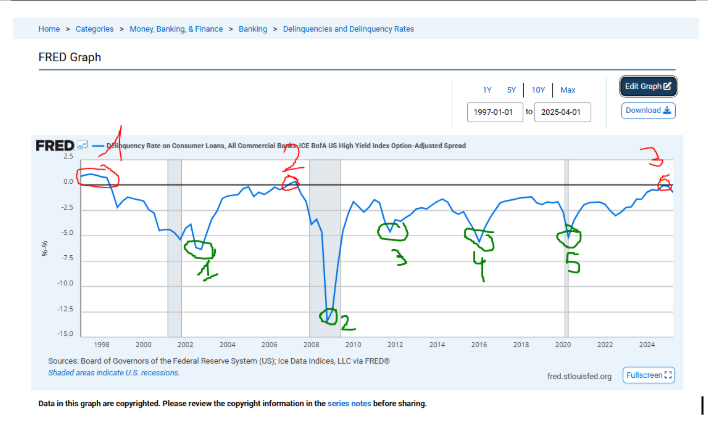
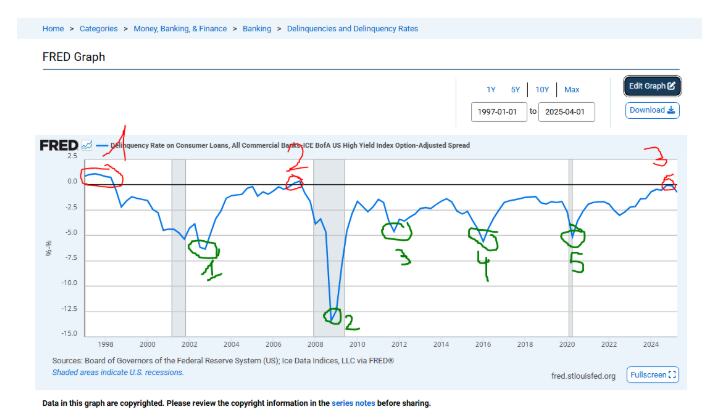
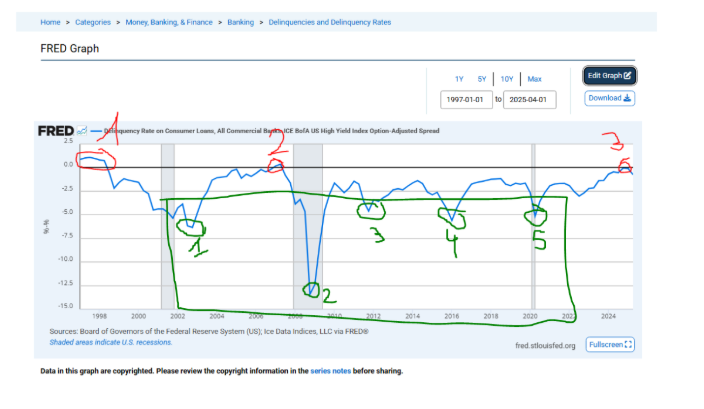
Interpretation:
The high points mean this: The credit quality is not great (relatively high deliquency) yet the markets overshoot in overbidding bad credit, mispricing bad credit.
Interpretation:
The high points mean this: The credit quality is not great (relatively high deliquency) yet the markets overshoot in overbidding bad credit, mispricing bad credit.
22/25
If you pay too much for bad credit you will make losses. That’s the area in red
If you pay too much for bad credit you will make losses. That’s the area in red
23/25
As the losses materialize people ask for more spread in relation to delinquencies which makes matter worse actually, they continue until they overshoot asking too much spread vs credit quality and then that’s your bottom . Green part
As the losses materialize people ask for more spread in relation to delinquencies which makes matter worse actually, they continue until they overshoot asking too much spread vs credit quality and then that’s your bottom . Green part
24/25
And we note that some bank like WFC reducing exposure on consumer lending, PNC reducing, USB selling and JPM freezing at telling you. They talking about spread compression at WFC to explain why they reduced the balances.
And we note that some bank like WFC reducing exposure on consumer lending, PNC reducing, USB selling and JPM freezing at telling you. They talking about spread compression at WFC to explain why they reduced the balances.
25/25
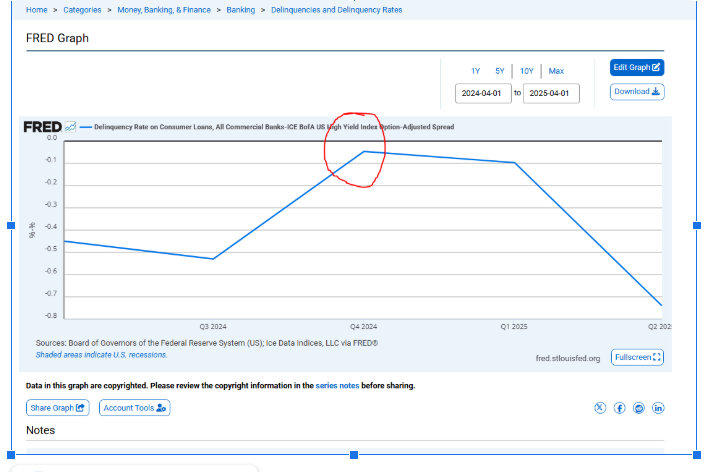
They simply say what is on the chart in red. We are not compensated for the quality. (what Gundlach also said). We have peaked in Q4 2024
Jamie Dimon sold his shares in Feb 2025. He knows one or two things about banking.
They simply say what is on the chart in red. We are not compensated for the quality. (what Gundlach also said). We have peaked in Q4 2024
Jamie Dimon sold his shares in Feb 2025. He knows one or two things about banking.
• • •
Missing some Tweet in this thread? You can try to
force a refresh