Good morning☕️
📈Weekly Charts📉
A big week: Fed cut rates, indices pushed to new highs, small caps reclaimed leadership, and leaders kept pressing higher.
Let’s take a look at the charts that matter most 👇
📈Weekly Charts📉
A big week: Fed cut rates, indices pushed to new highs, small caps reclaimed leadership, and leaders kept pressing higher.
Let’s take a look at the charts that matter most 👇

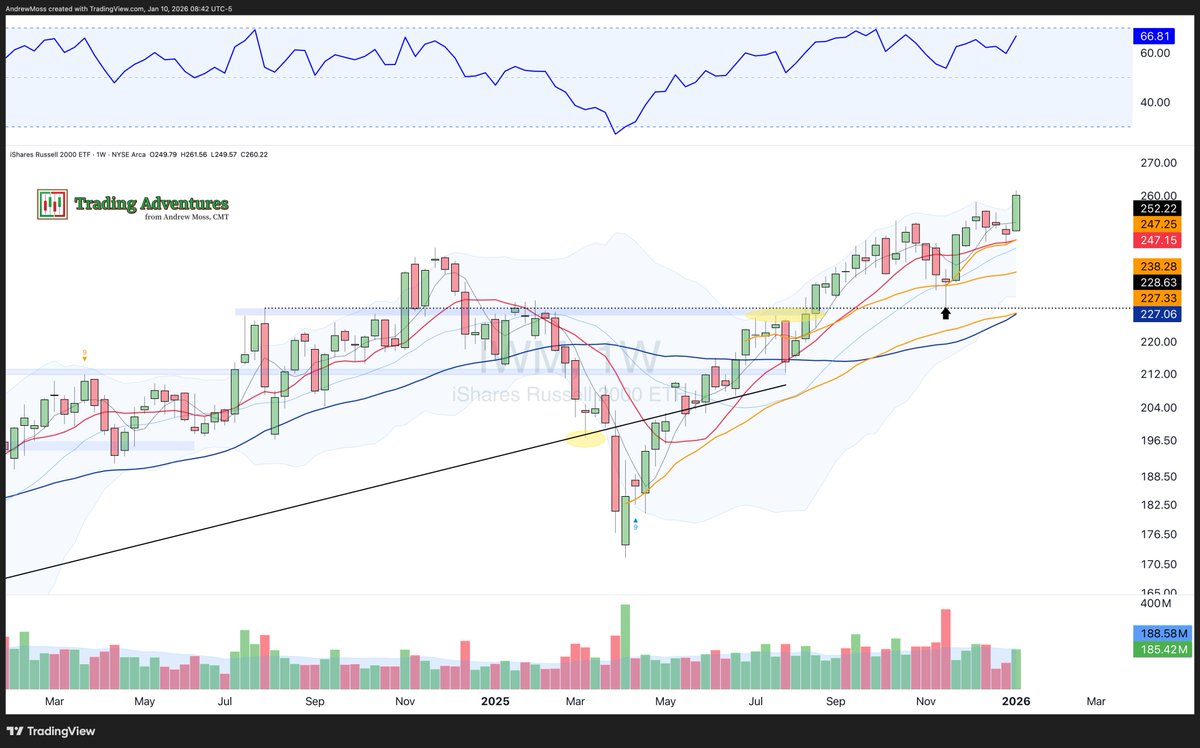
$IWM gets the starting spot this week with a new all-time high weekly close.
It’s been a long road back to the $240s — a level that’s been resistance before.
📊Volume was heavy this week. RSI not yet overbought.
The question now ➡ follow-through or another stall?
The next extension level higher doesn't come in until near ~$295s.
Below, there is potential support near ~$229-$230, the 10-week MA🔴and the AVWAP🟠 from the July test of support pivots and the 40-week MA🔵.

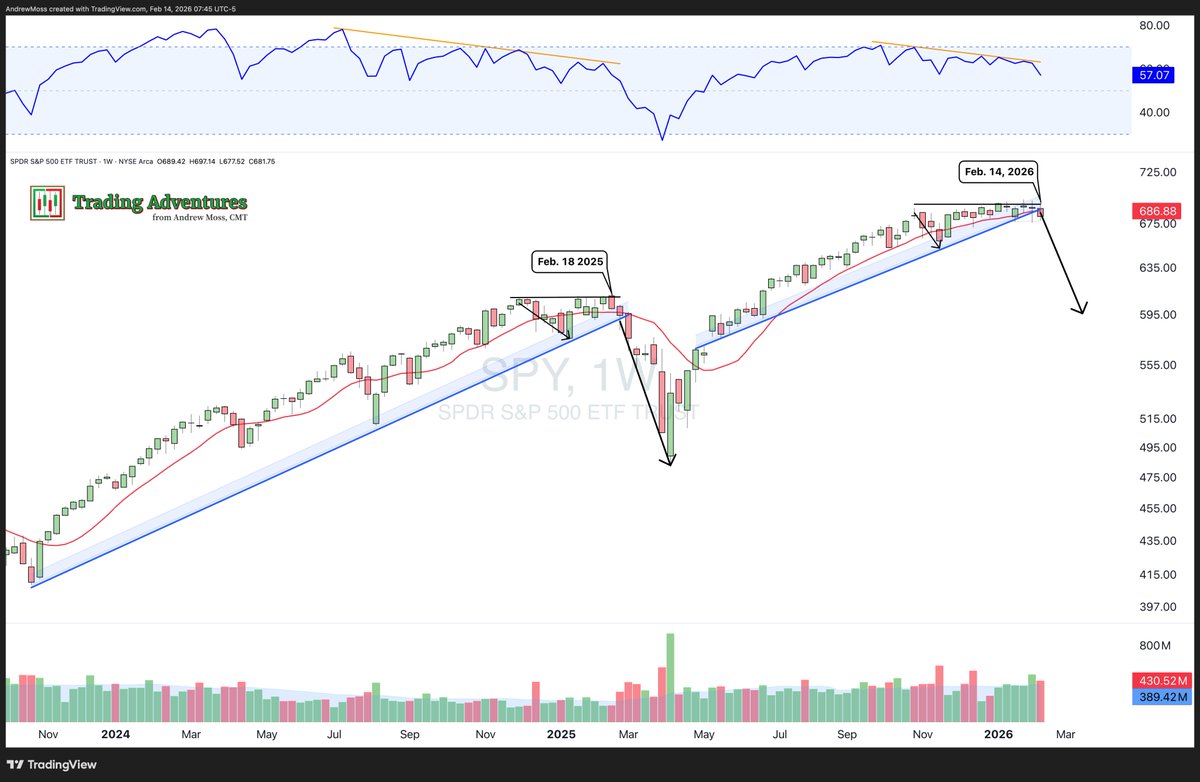
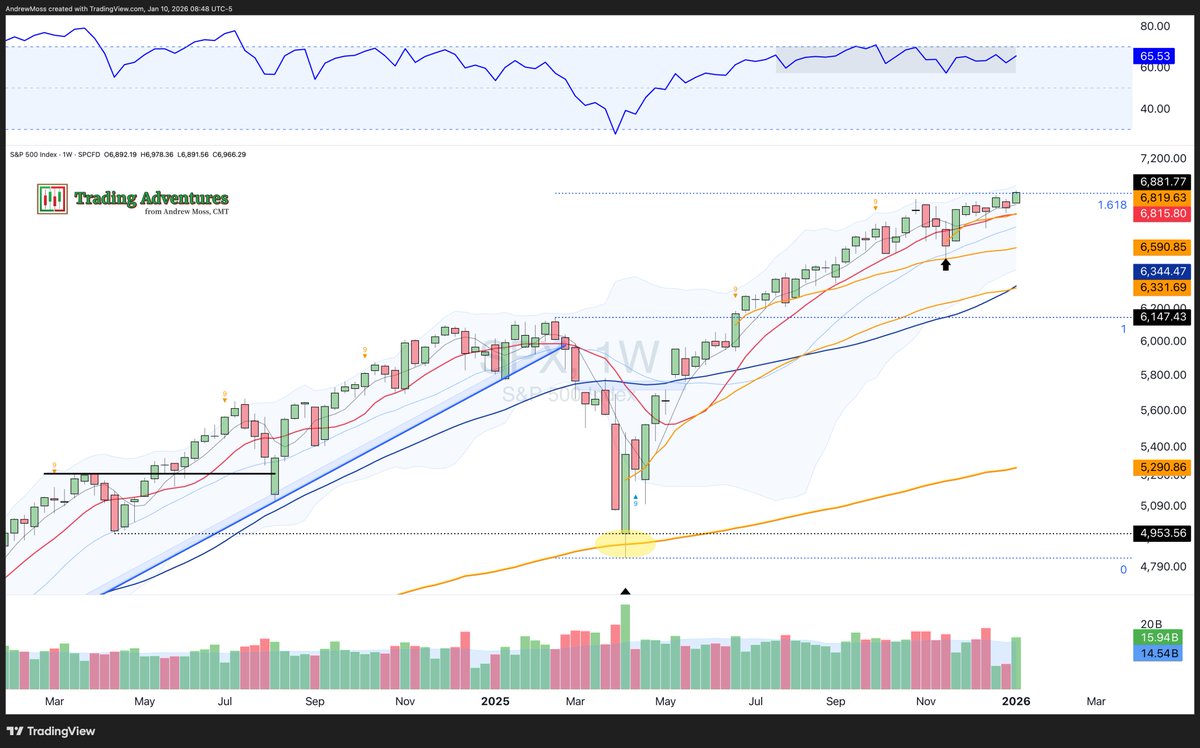
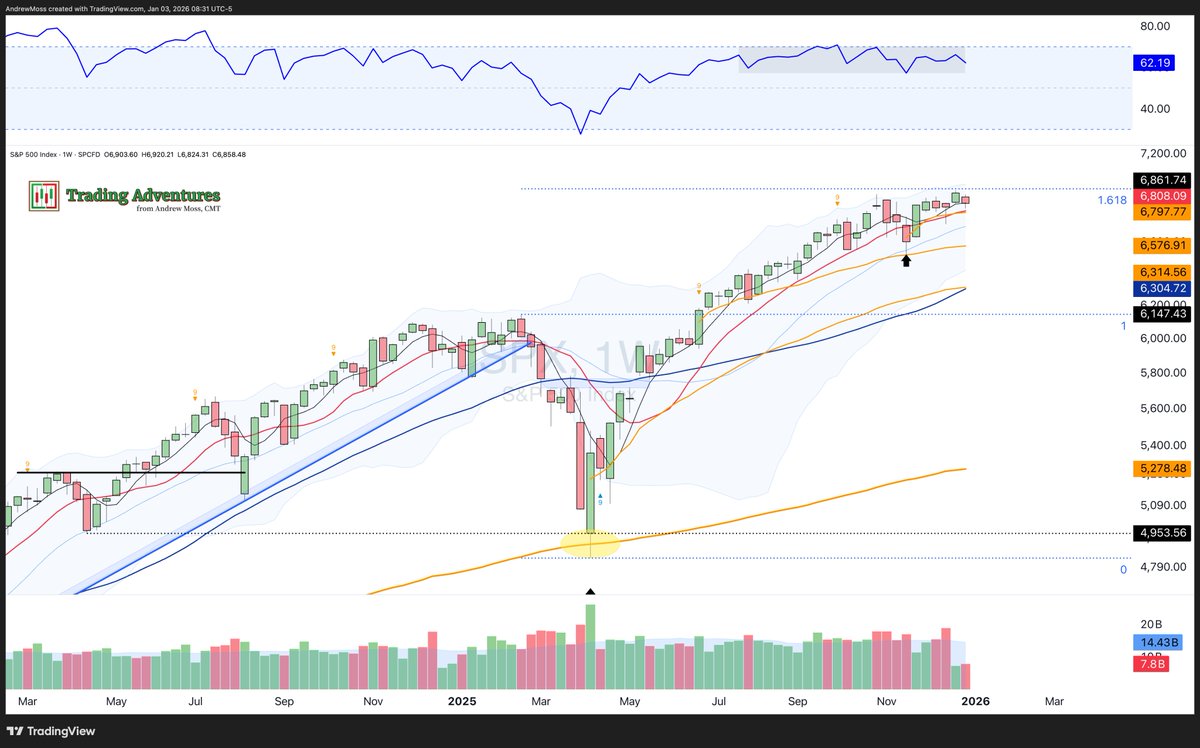
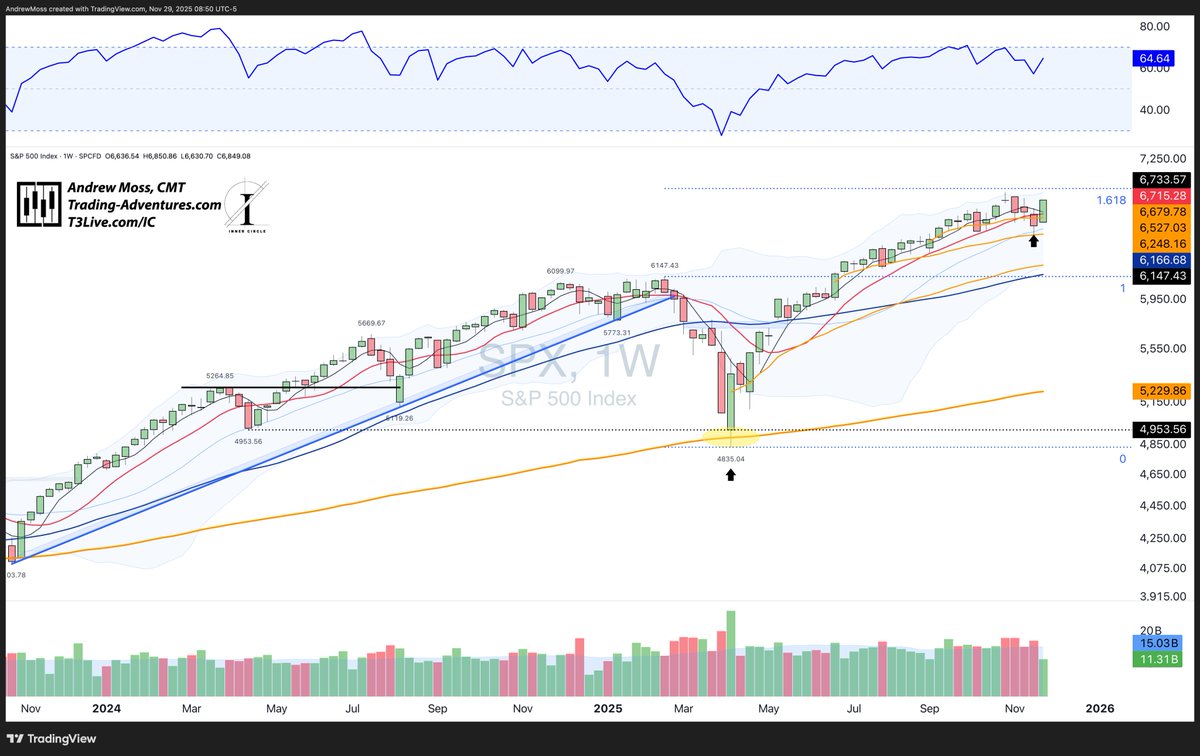
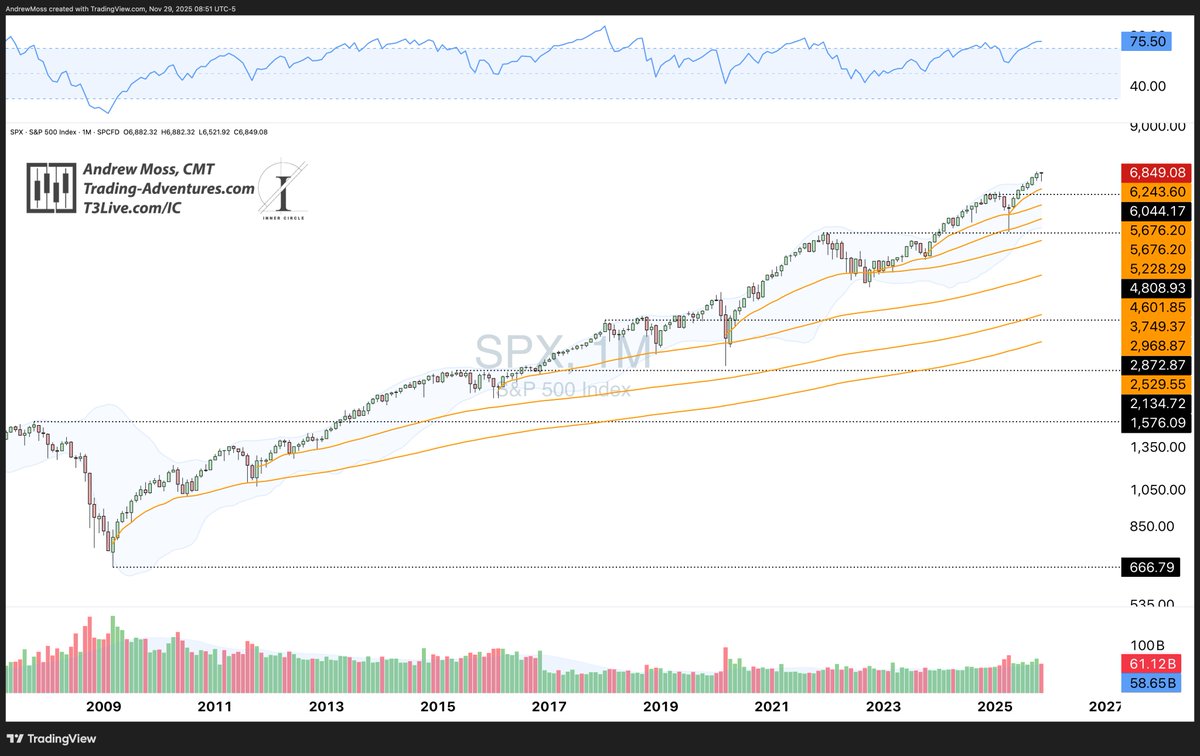
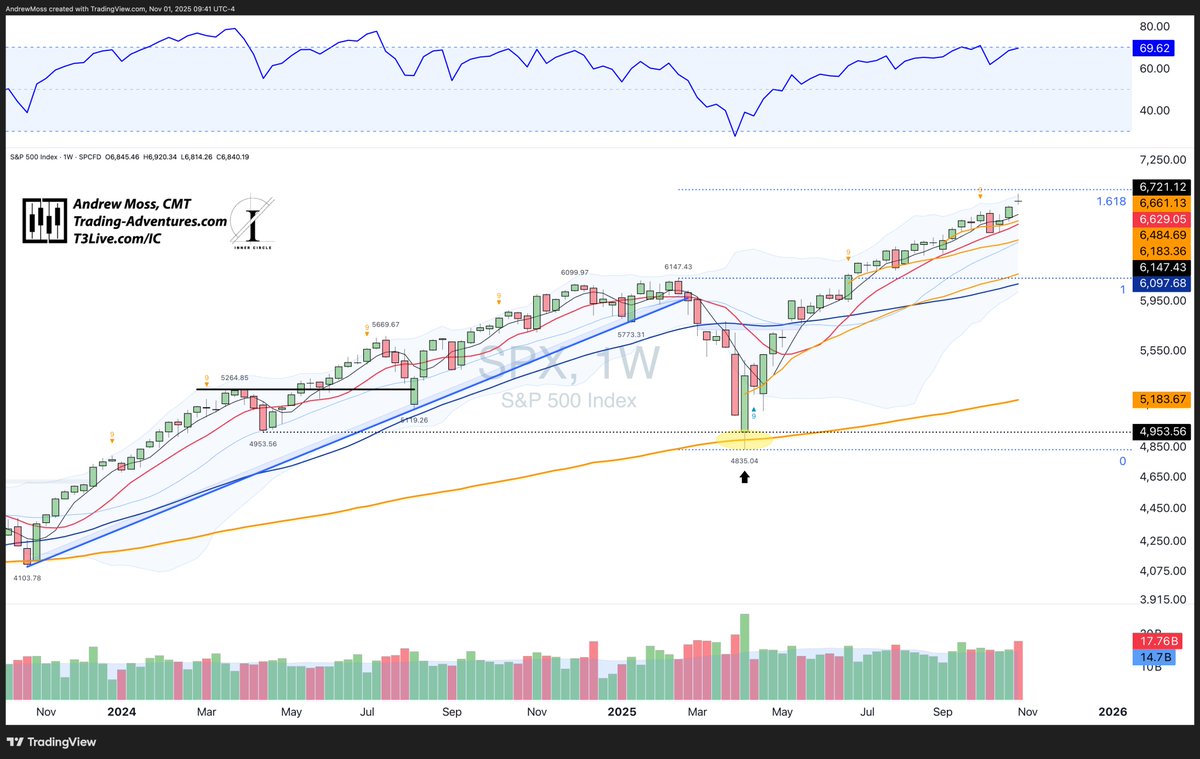
$SPX extended its bounce from the 10-week MA, taking RSI > 70, and moving on high volume.
7000 and the 1.618 extension are getting closer.
7000 and the 1.618 extension are getting closer.

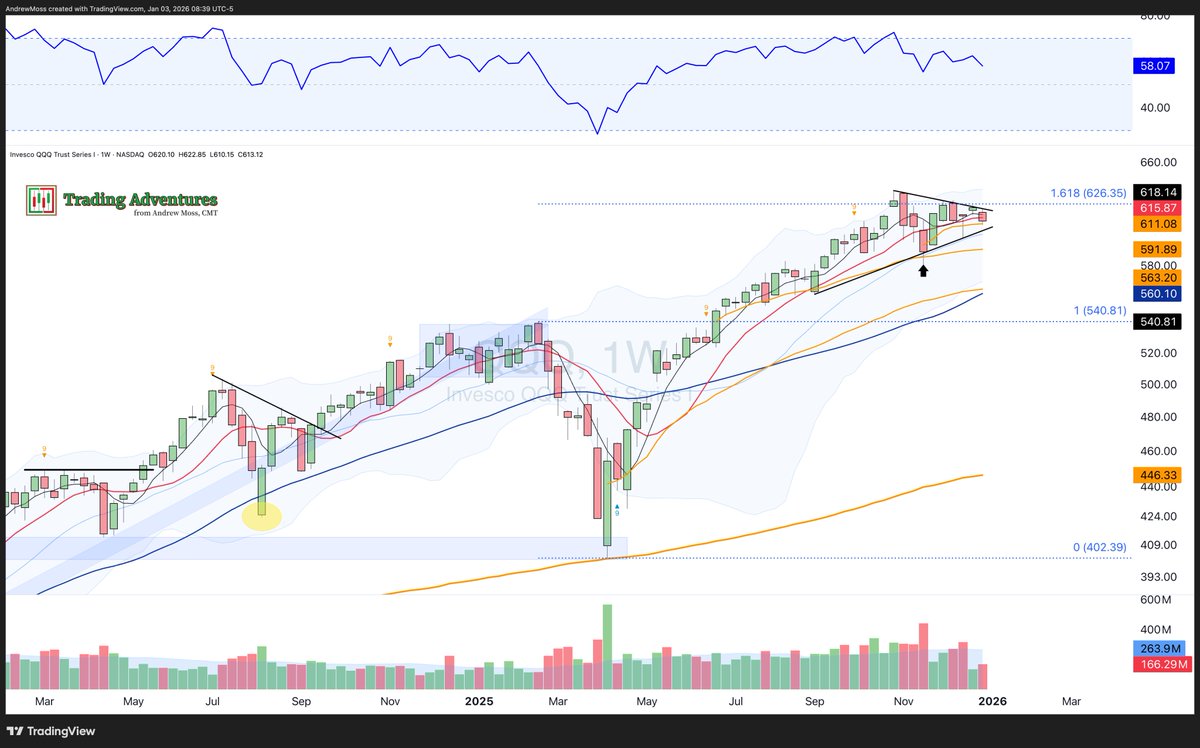
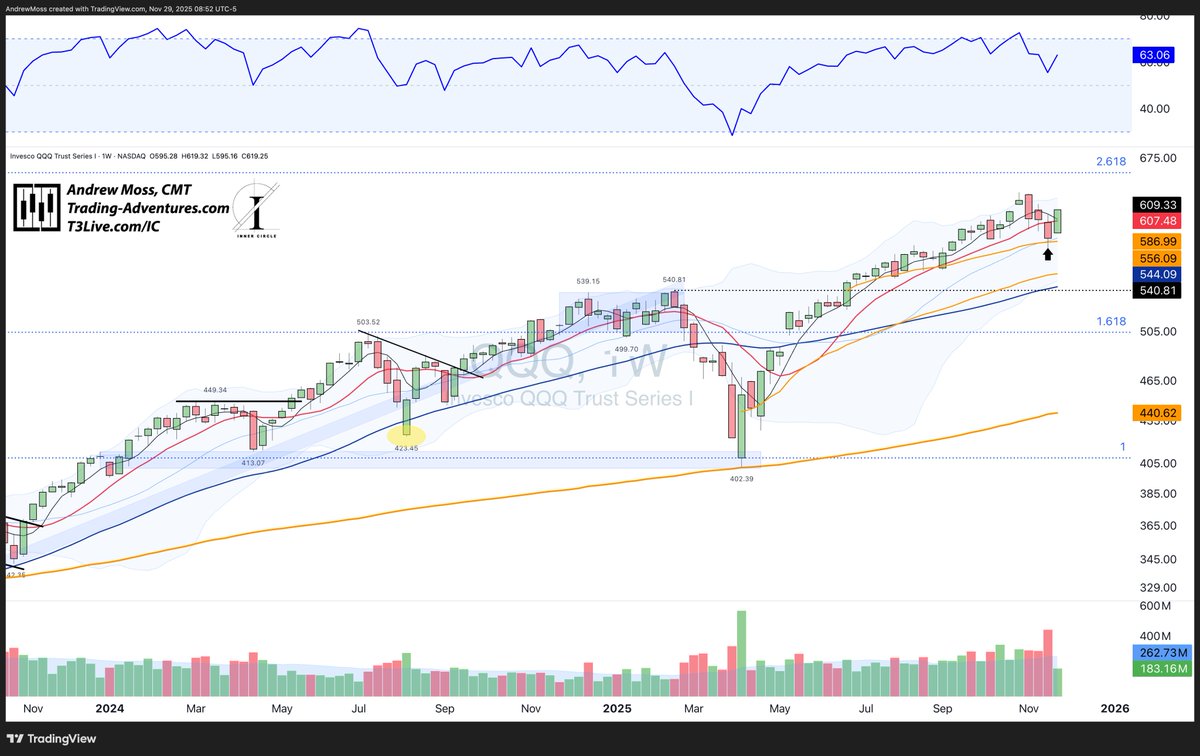
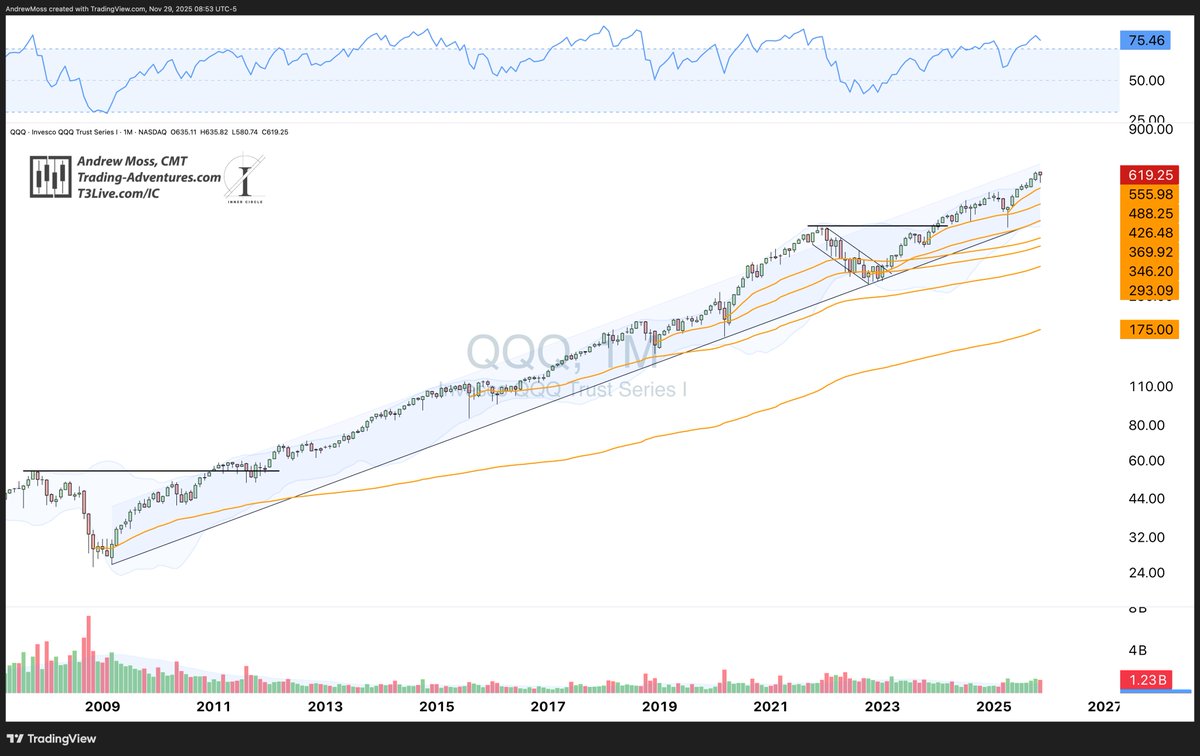
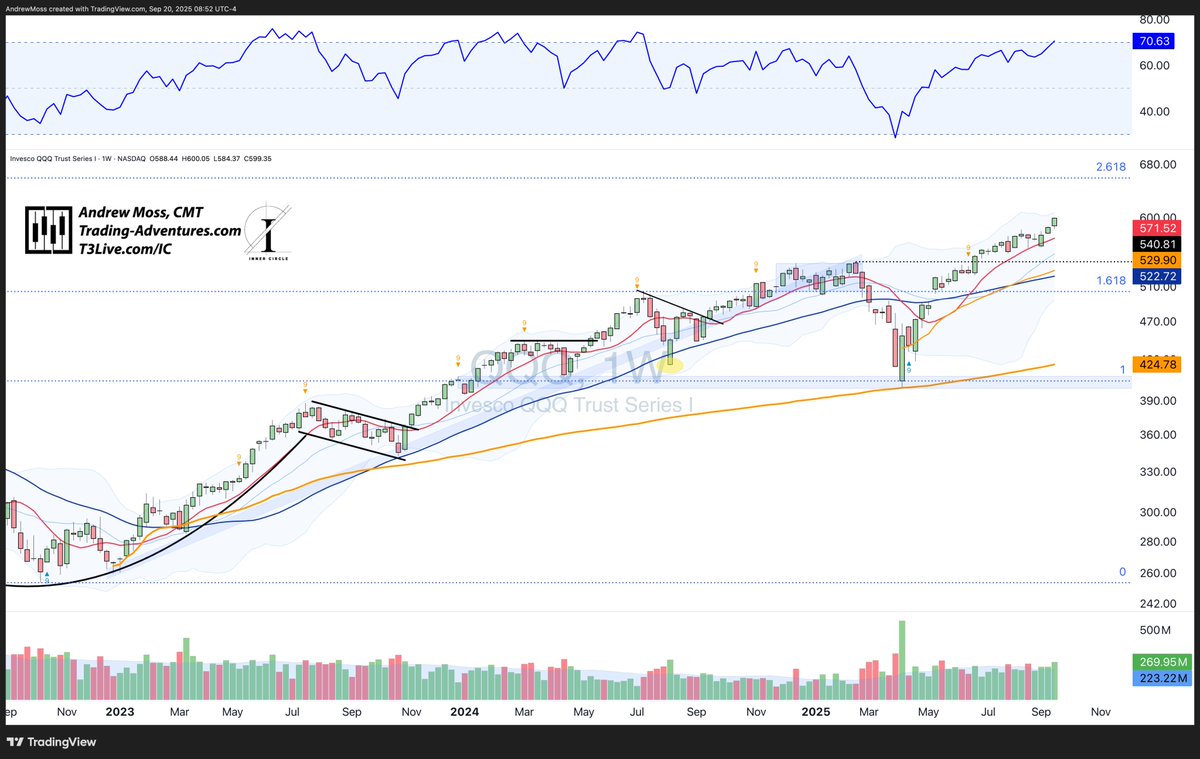
$QQQ with its 3rd week higher as well, nearing the upper Bollinger Band while taking the weekly RSI > 70 and into 'overbought' status.
Volume was also above average.
Volume was also above average.
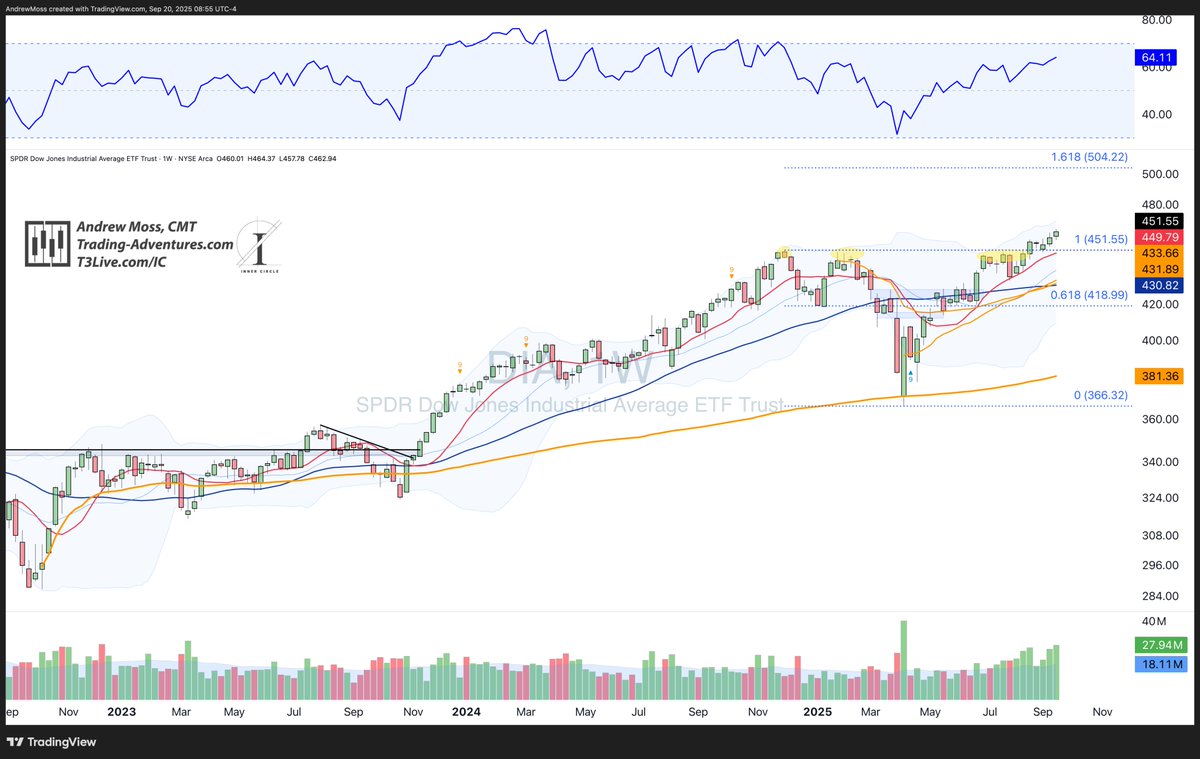
$DIA rounds out the perfect 4/4 week.
RSI at 64 leaves plenty of room for more momentum, and the next extension is $504.22.
Support could be found near $449-$451.
RSI at 64 leaves plenty of room for more momentum, and the next extension is $504.22.
Support could be found near $449-$451.
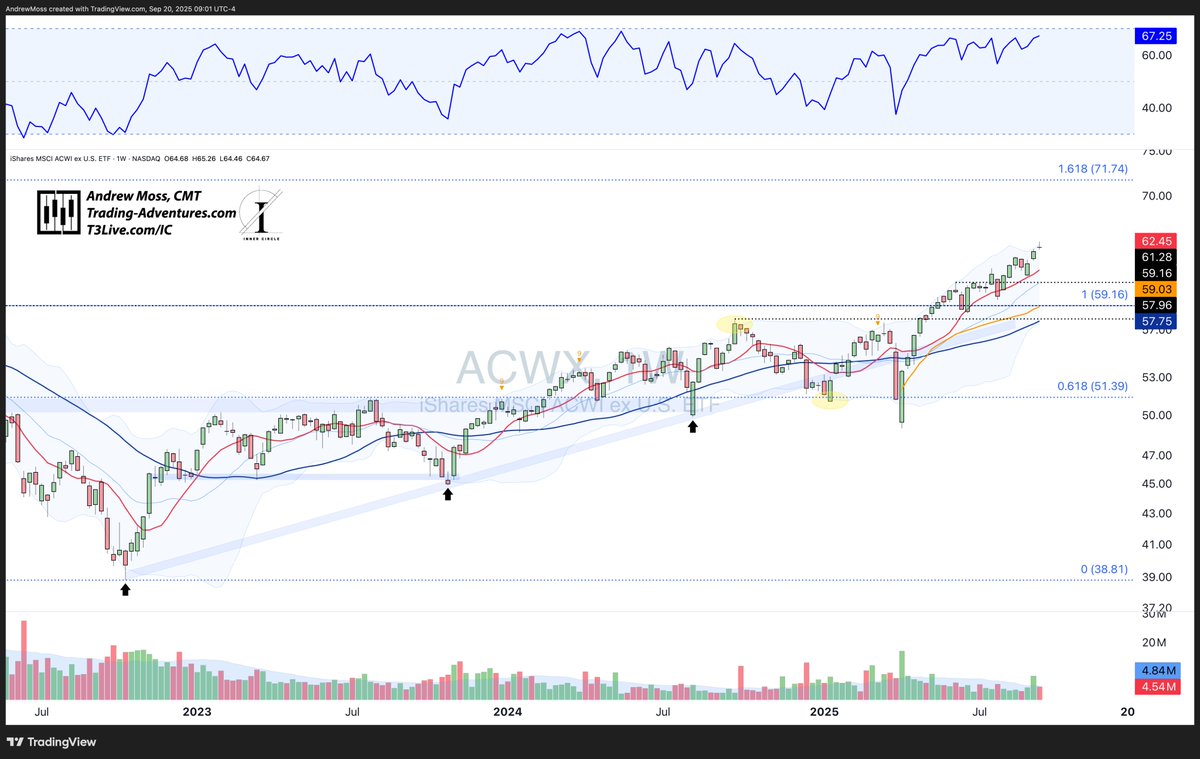
Moving overseas - $ACWX The Rest Of The World was up too, but with a potential topping candle in the form of a shooting star candle at the upper Bollinger Band.
📈That's one sign of extension. OTOH, the 10-week MA isn't that far below, and RSI is still below 70.
🔃This could pull back into the lower $60s from here, or push on towards the next ext. level at $71.74.
📈That's one sign of extension. OTOH, the 10-week MA isn't that far below, and RSI is still below 70.
🔃This could pull back into the lower $60s from here, or push on towards the next ext. level at $71.74.
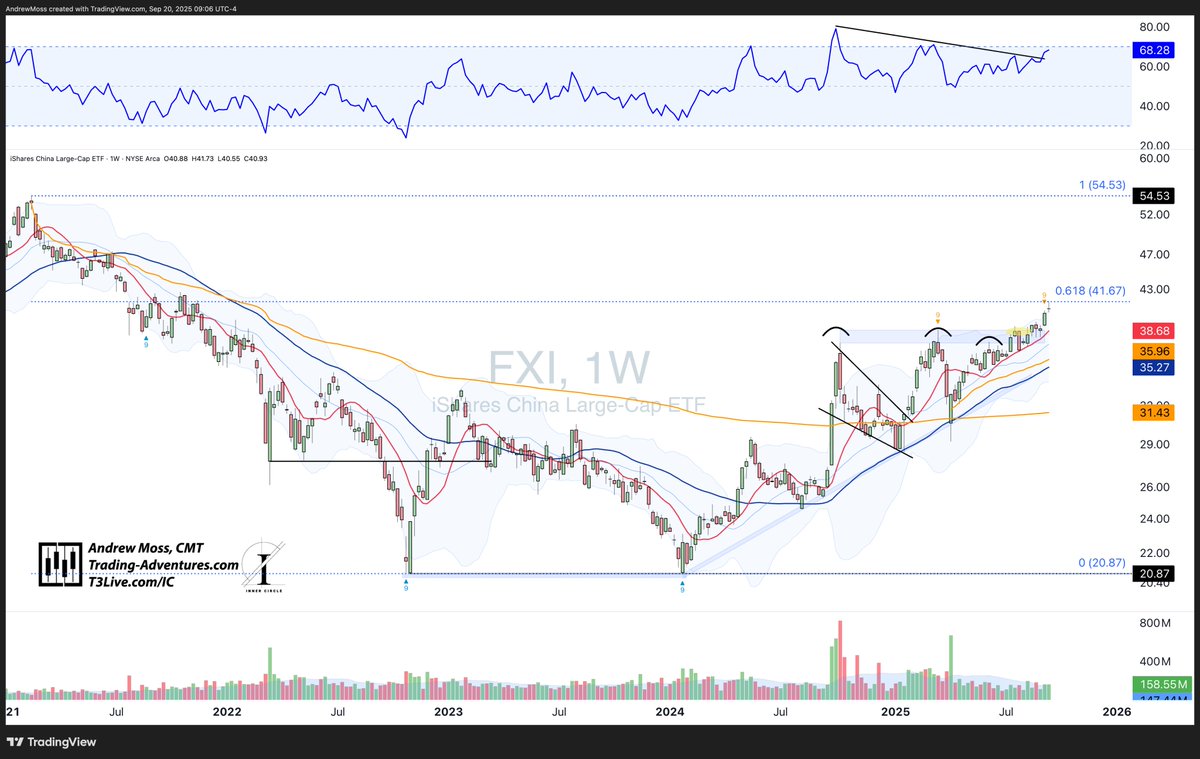
🇨🇳 $FXI China has a similar look, but with the added factor of a retracement level adding some resistance.
RSI followed prices higher, while the DeMark 9 setup has proven to be (at least) a week early.
RSI followed prices higher, while the DeMark 9 setup has proven to be (at least) a week early.
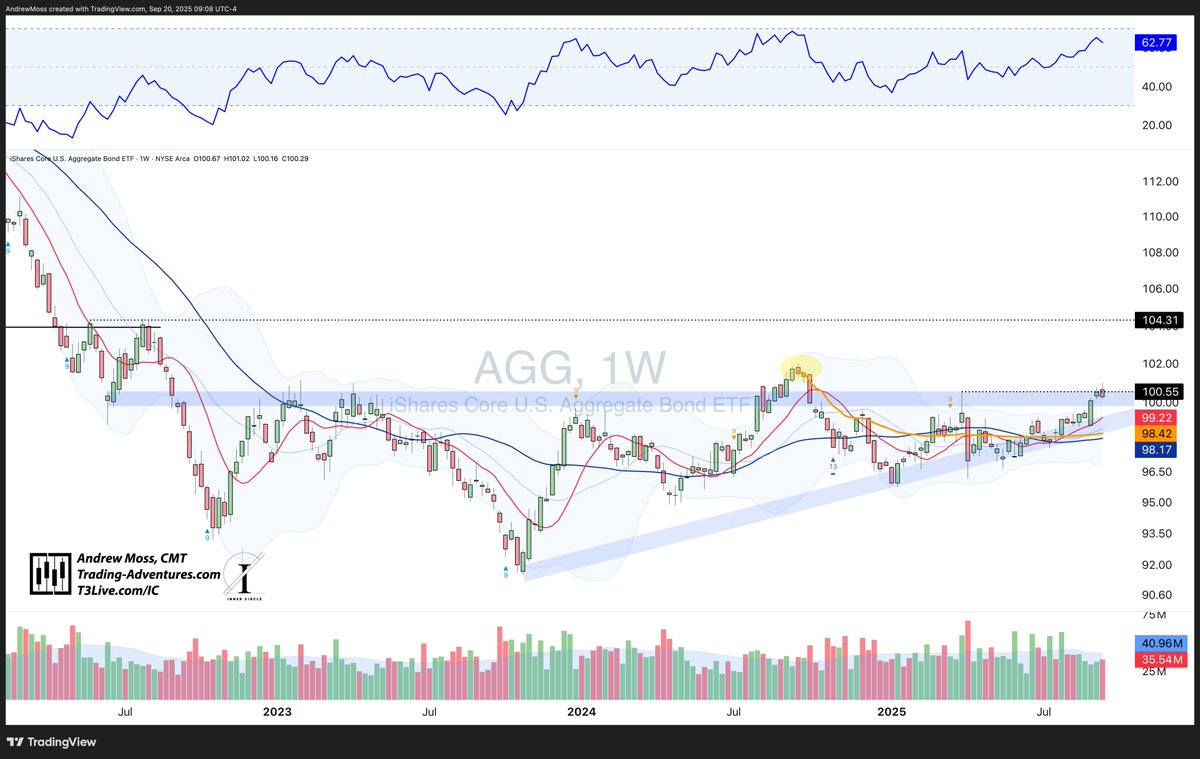
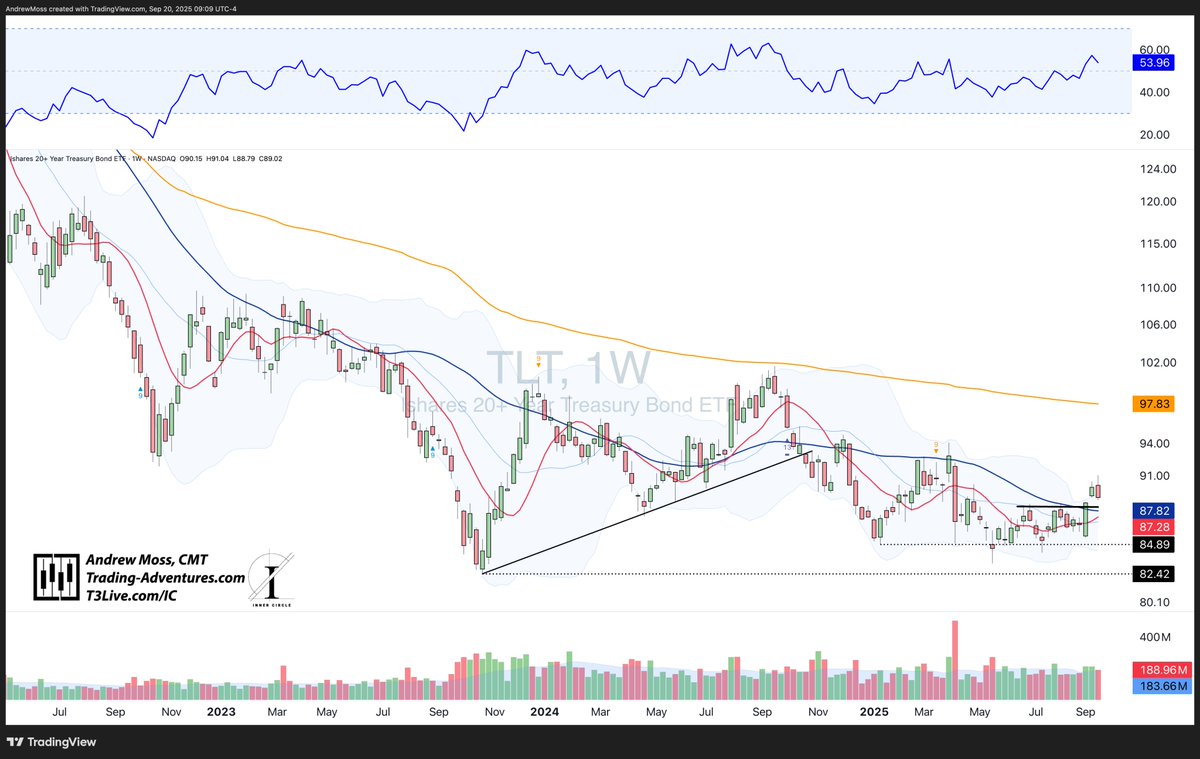
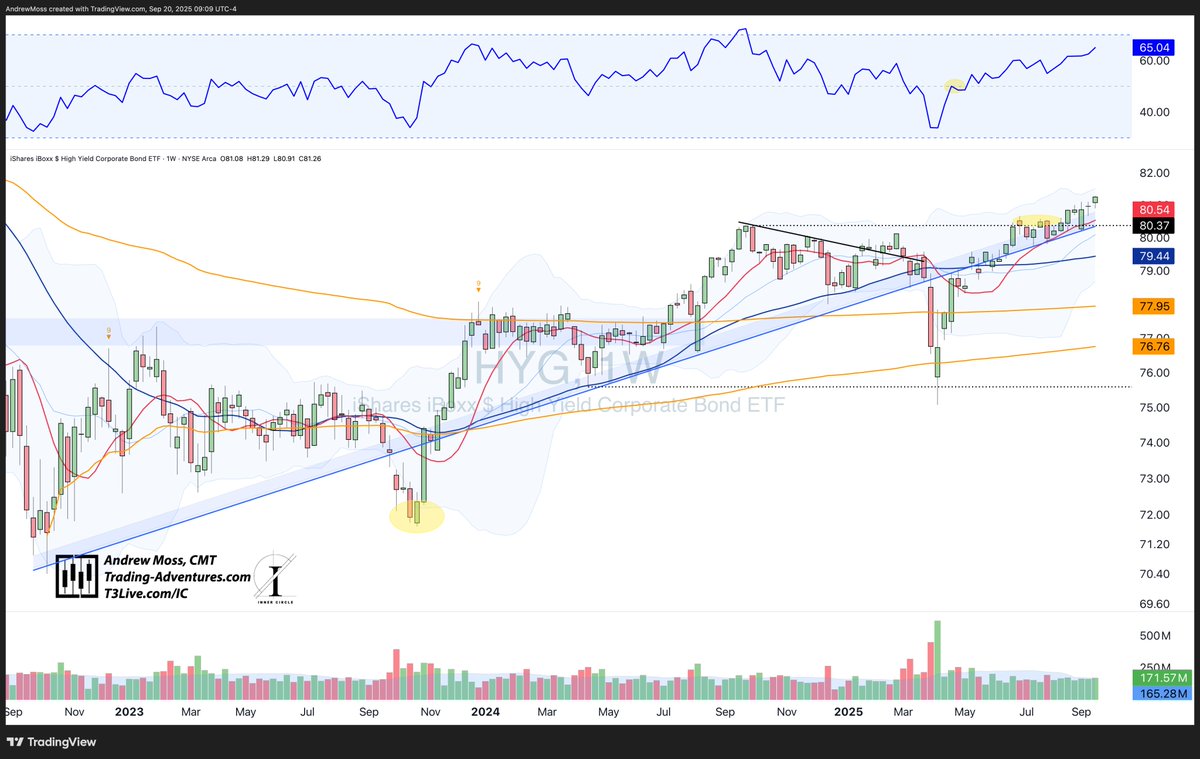
High-quality bonds with a bit of an 'about face' this week.
↩️ $AGG and $TLT reversed last week's breakout action.
But high-yield buyers were still present, taking $HYG smoothly upward along the trend area.
↩️ $AGG and $TLT reversed last week's breakout action.
But high-yield buyers were still present, taking $HYG smoothly upward along the trend area.
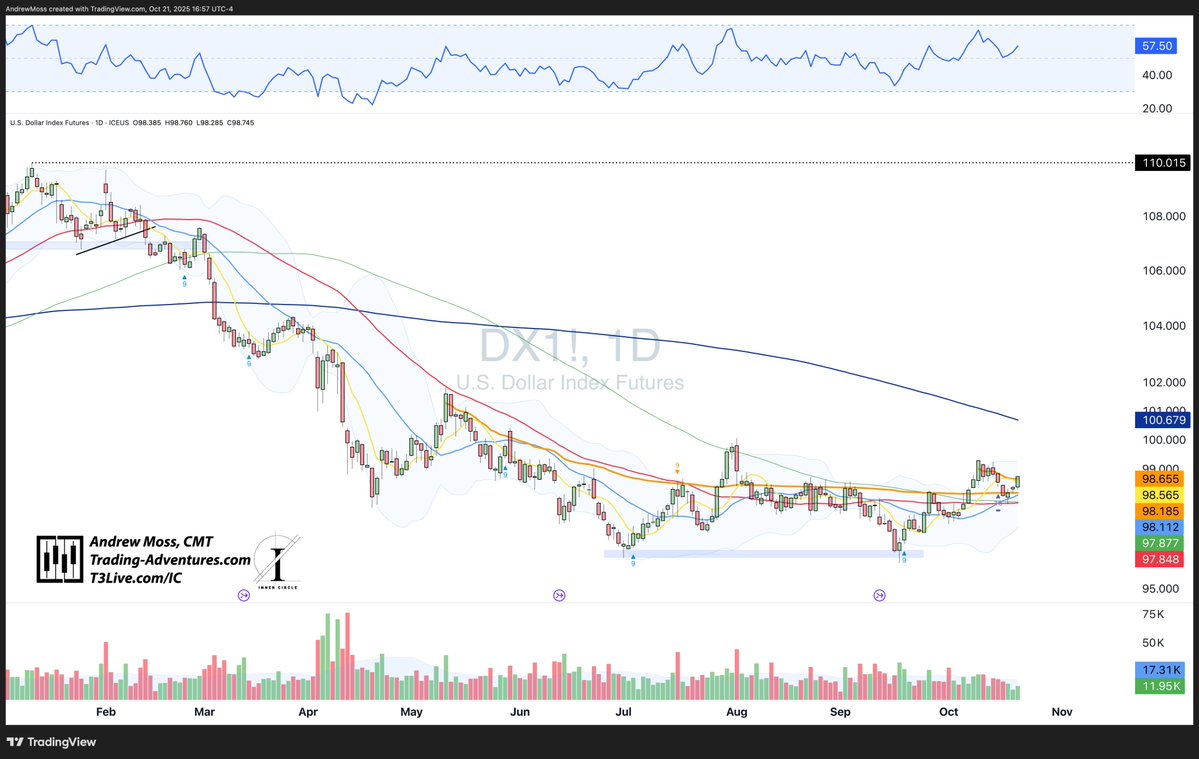
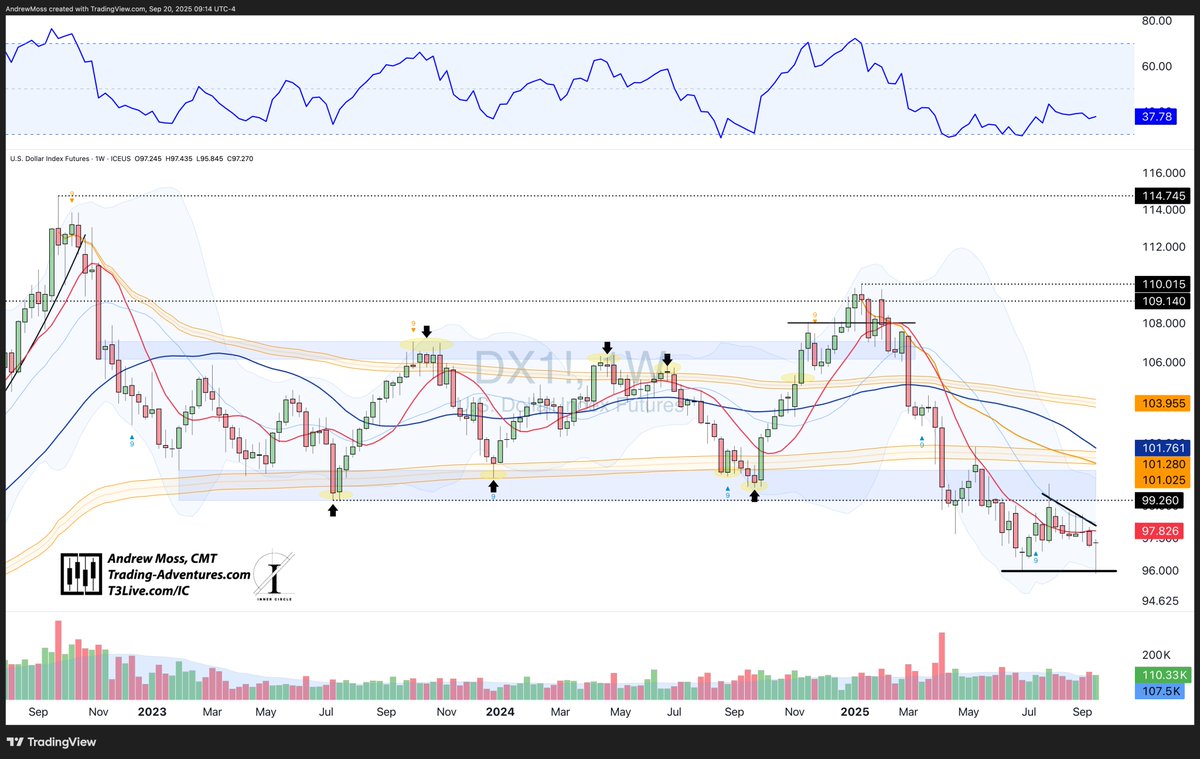
$DXY $DX1! The Dollar showed signs of life with a strong reversal off the pivot, leaving a very long shadow on the bottom of this weekly candle.
There should be plenty of resistance just above, so this is far from a decisive move. We'll see if price action confirms in coming weeks.
There should be plenty of resistance just above, so this is far from a decisive move. We'll see if price action confirms in coming weeks.
• • •
Missing some Tweet in this thread? You can try to
force a refresh