Trader & CMT | Sharing charts, trades & structure at https://t.co/r1aJbu28hf
 $SPX - Too easy, right?
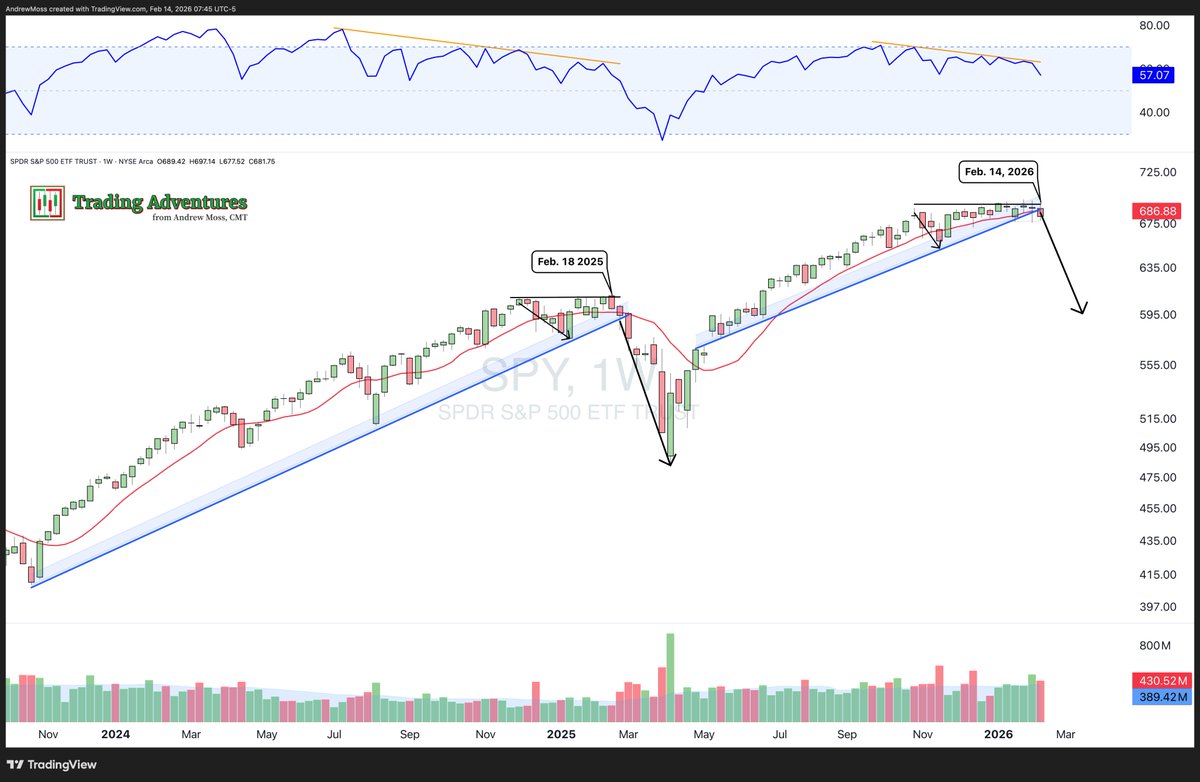
 Starting with the standout: $IWM
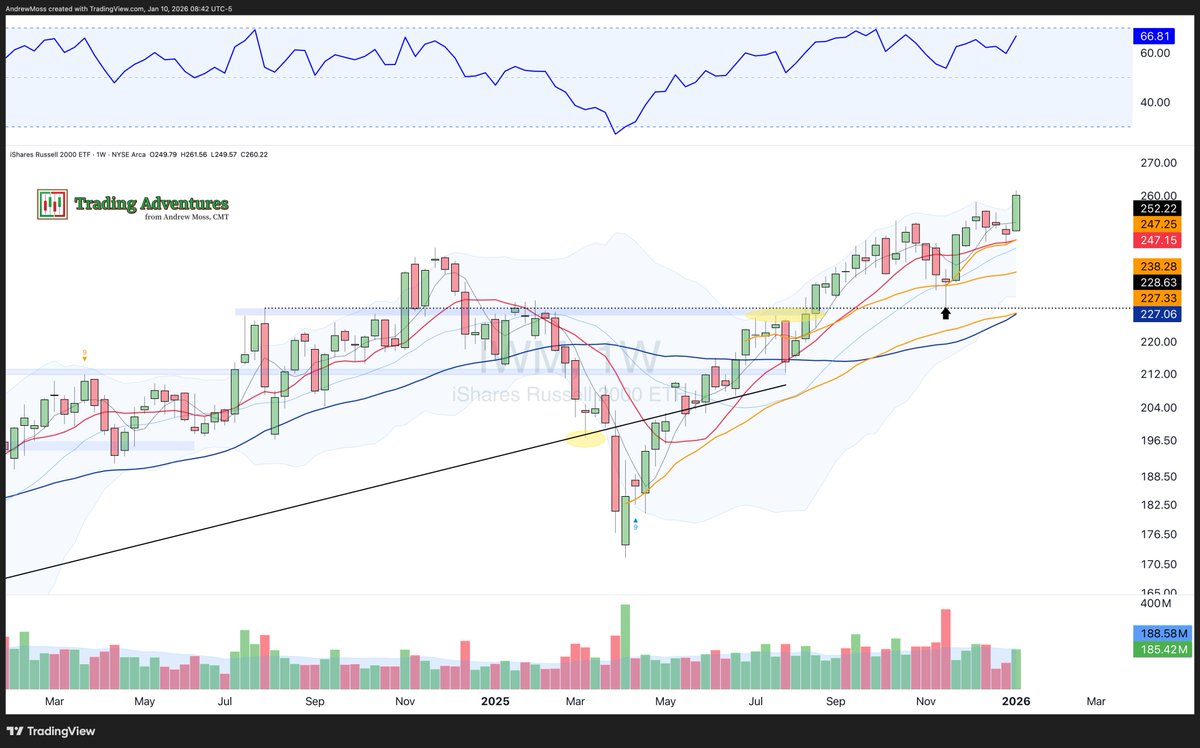
 $SPX
$SPX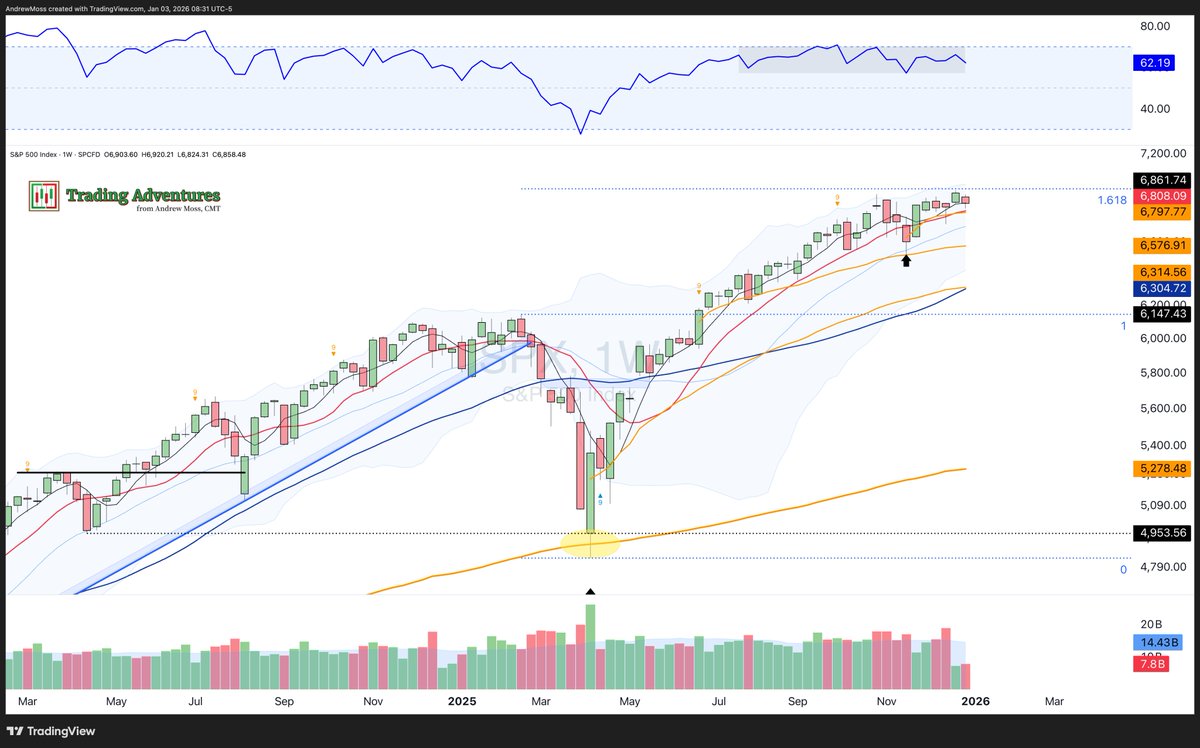
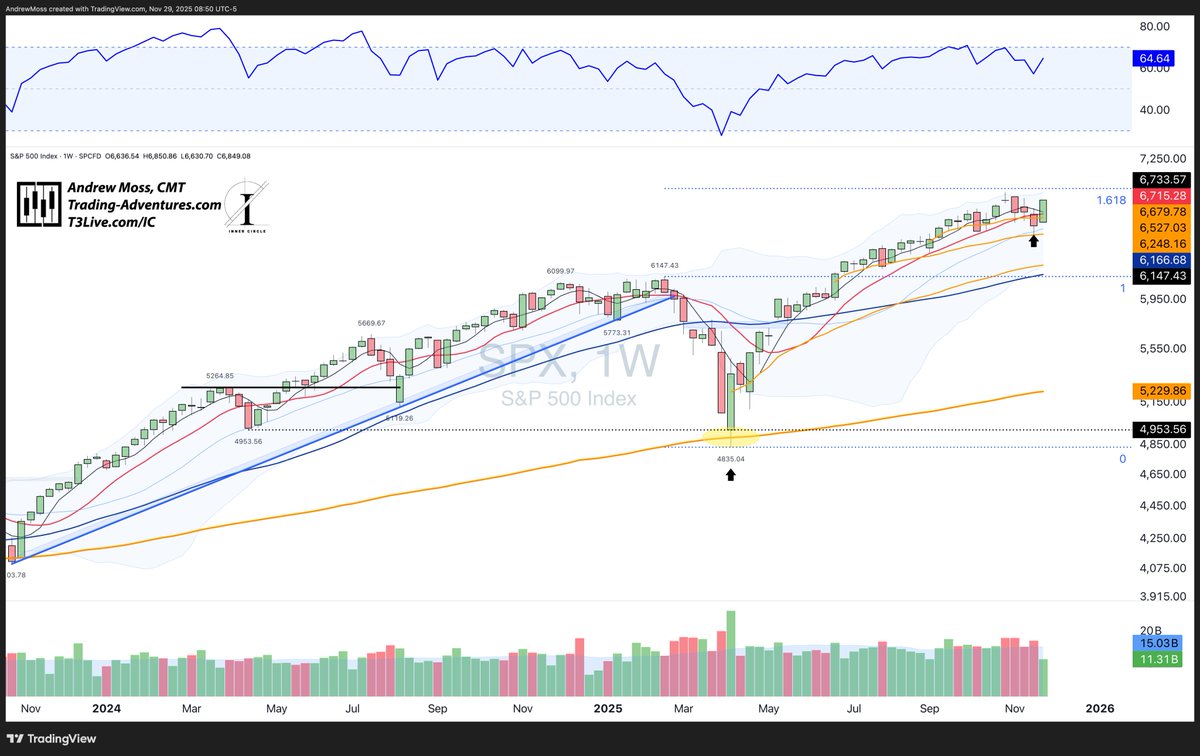
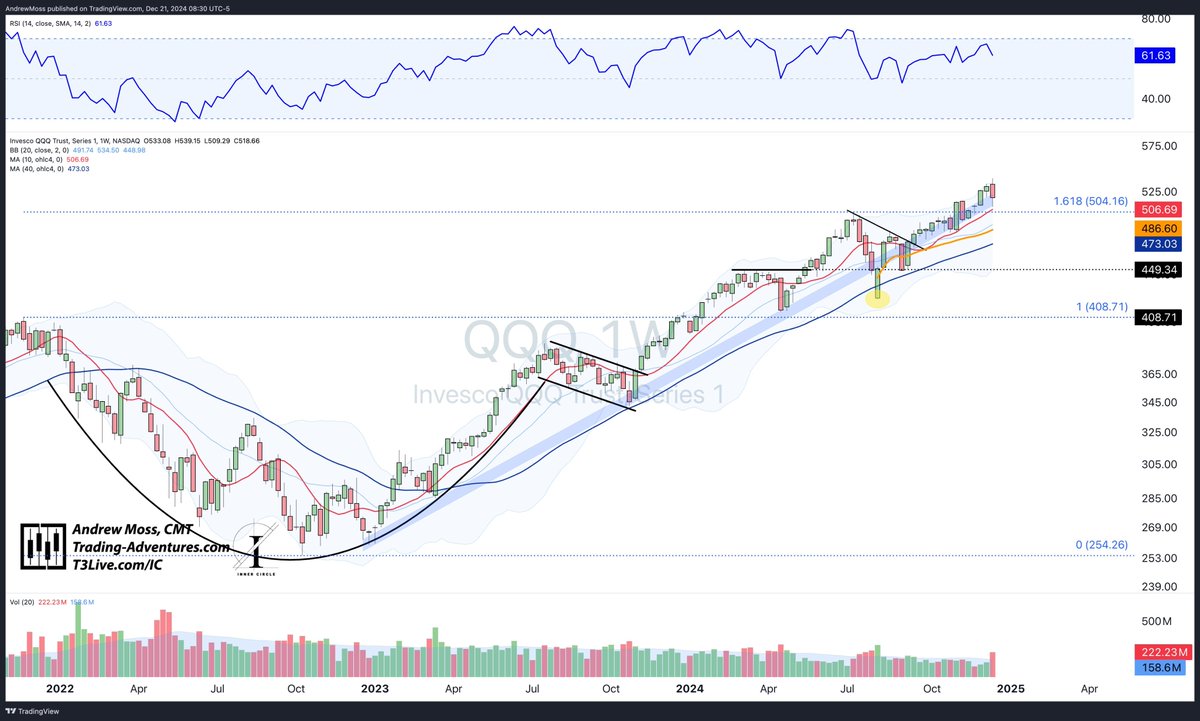
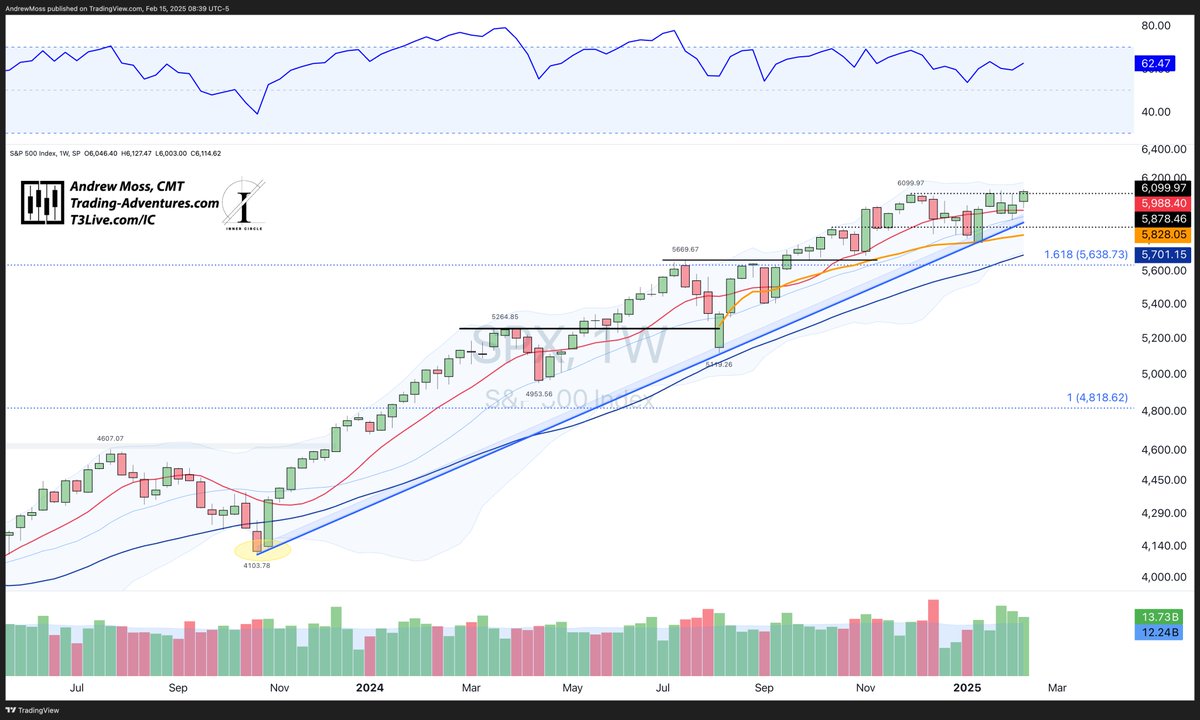
 $SPX finished the week flat—open matched close—printing a weekly doji just under the 1.618 extension.
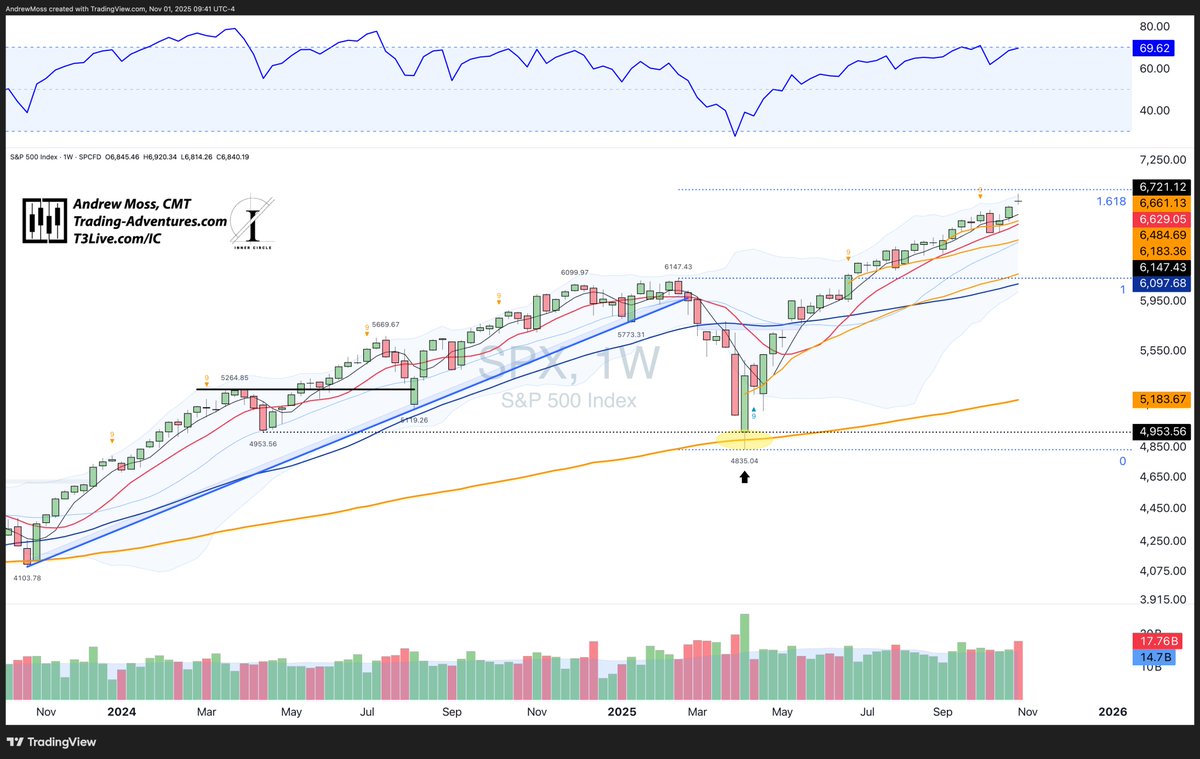
 $DXY up for the 3rd day.
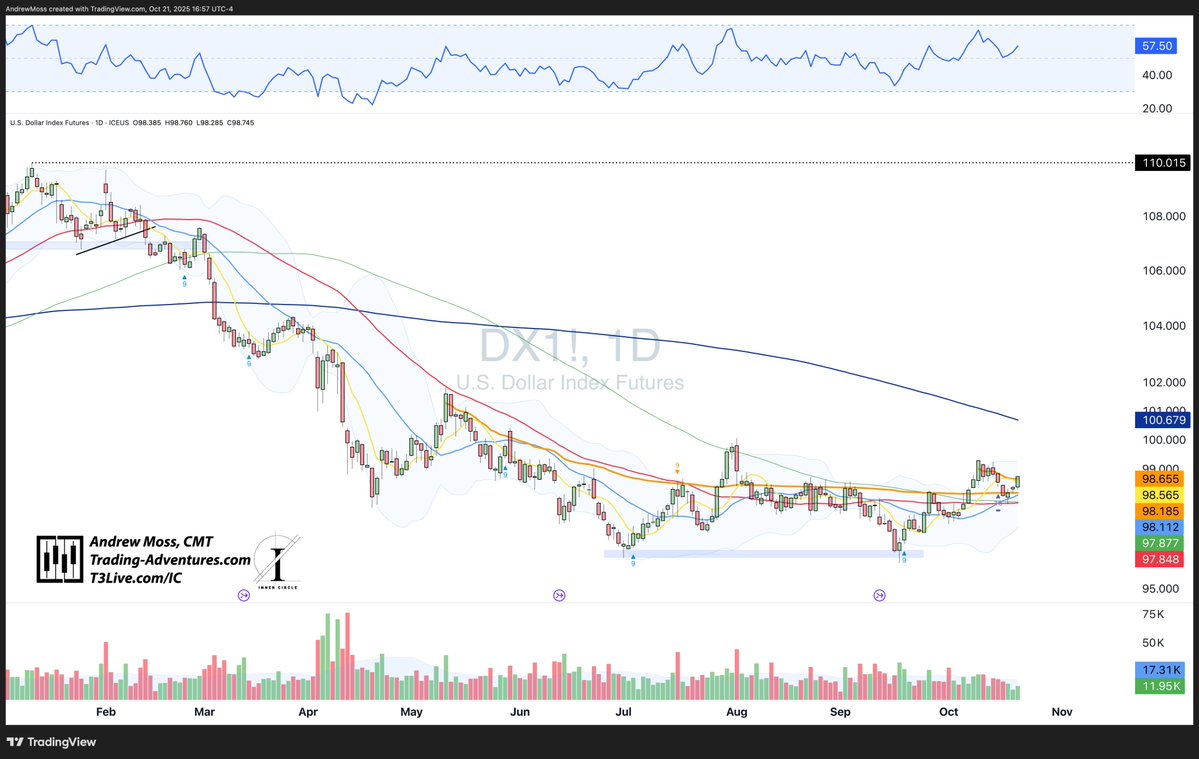
 $SPX - tapped the 10-week MA early, bounced, and closed above both the new 4-week MA and the AVWAP🟠 from its last 10-week test.
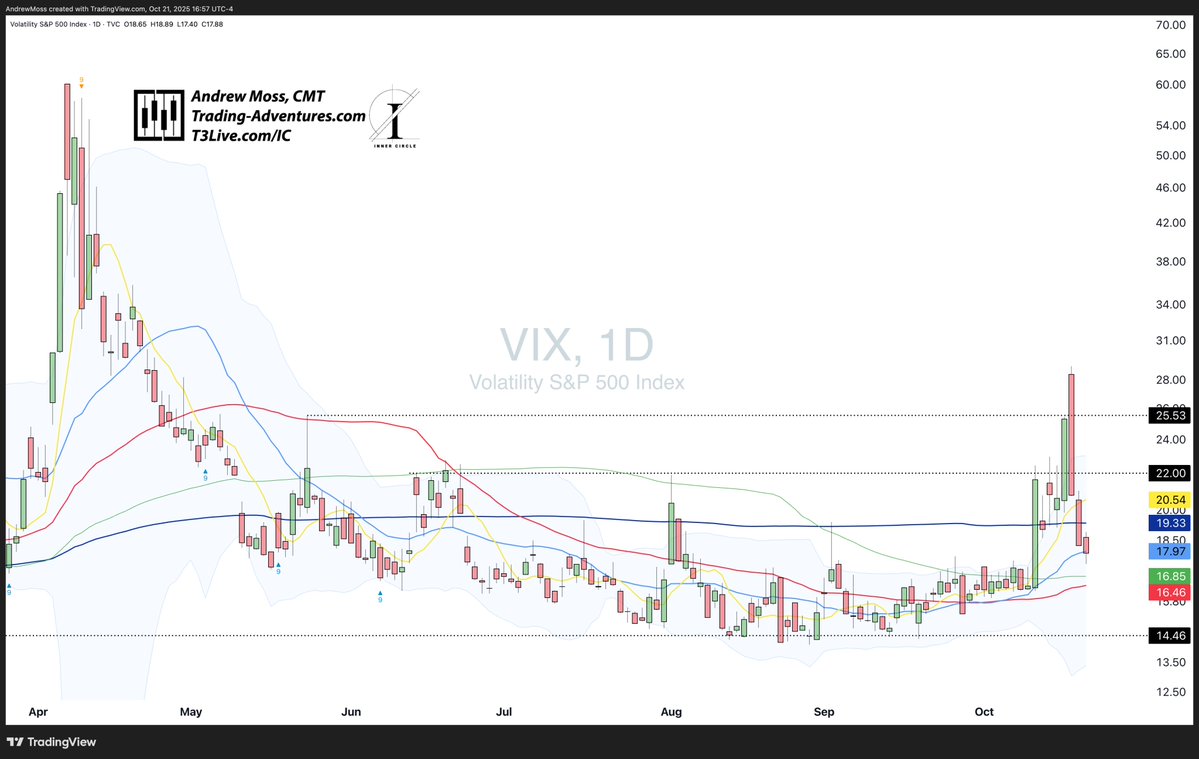
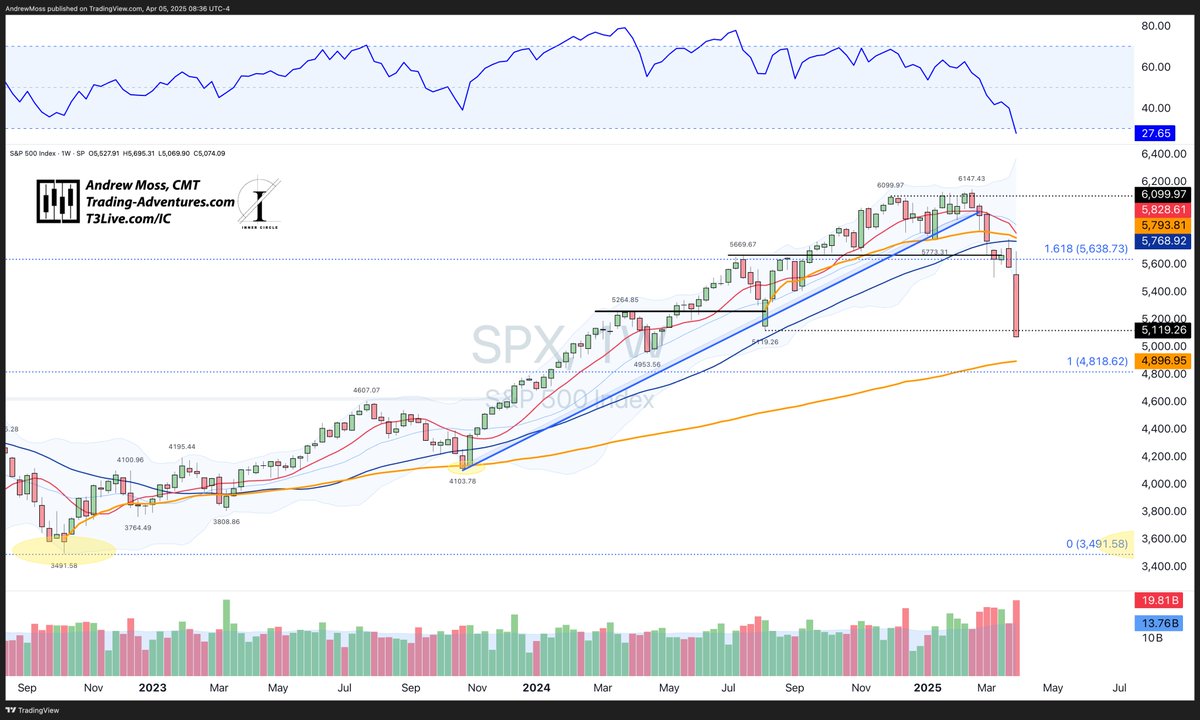
 $SPX with a big outside reversal candle taking it from new highs to down nearly to the 10-week MA -- a level we haven't been close to for about 60 days, and haven't traded below since April.
 $SPX with an inside week near the highs on good volume while bringing RSI back below 70.
 $IWM gets the starting spot this week with a new all-time high weekly close.
 $SPX
$SPX

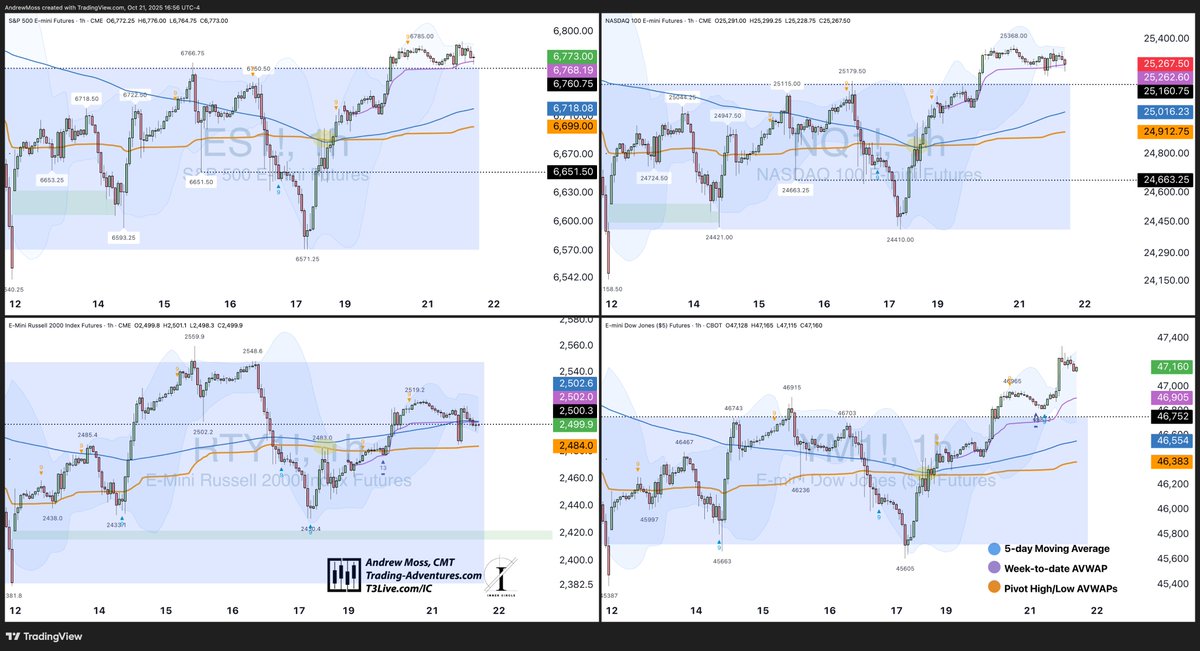
 $SPX starts it off with a small range and indecisive action.
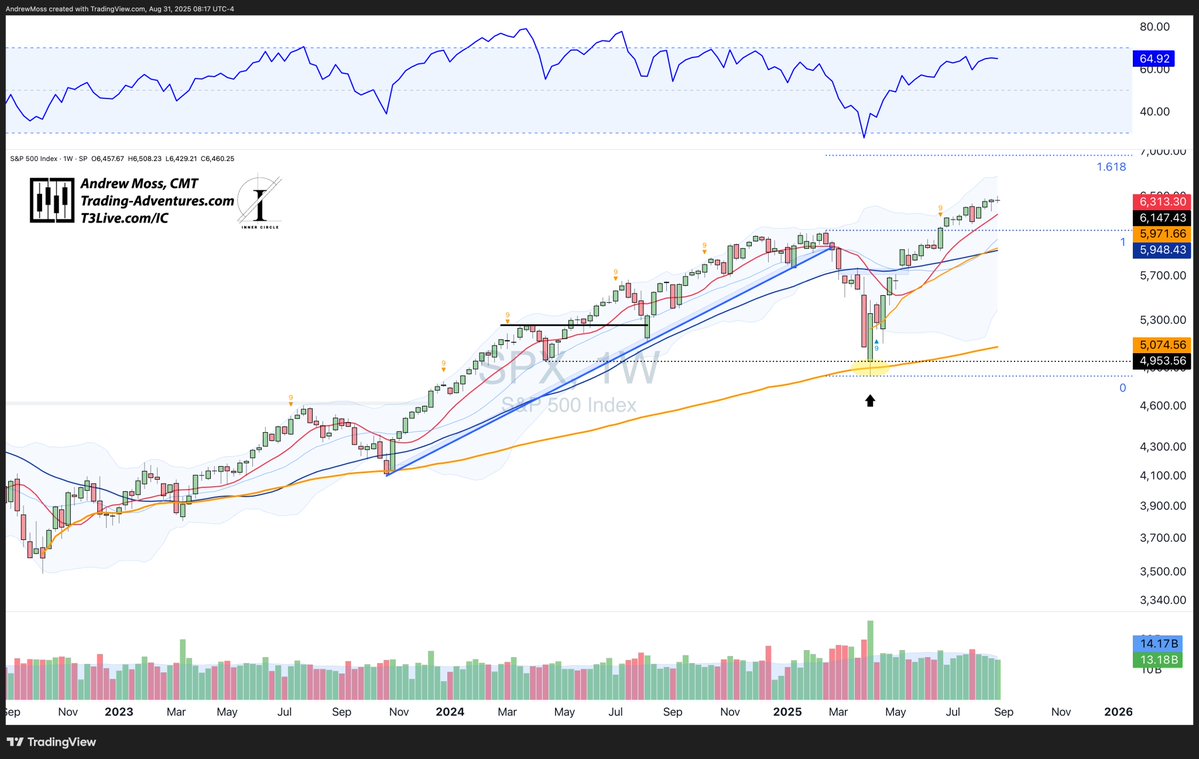
 $DIA gets the starting spot today as it flirts with a new weekly all-time closing high. Missed by half a point.
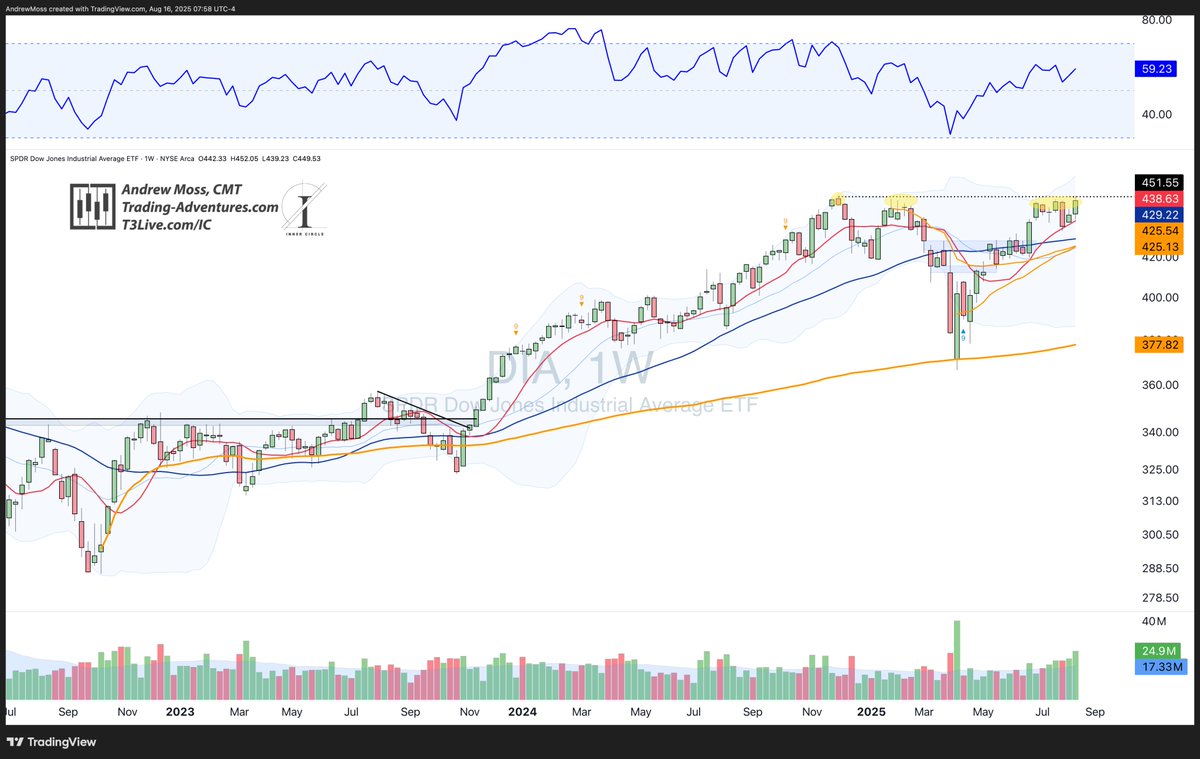
 $QQQ spent another week testing the 40-week MA, but could not move above.
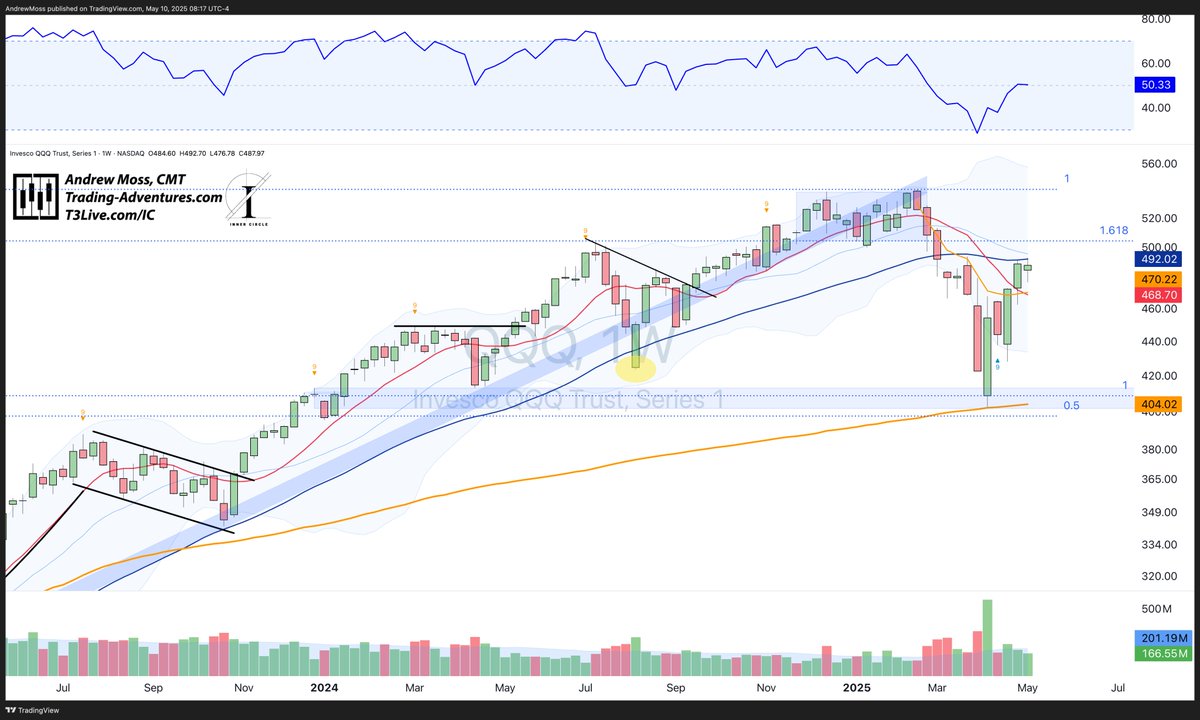
 $QQQ has exceeded the -20% drawdown mark (~$432), closing the week very close to the August pivot low.
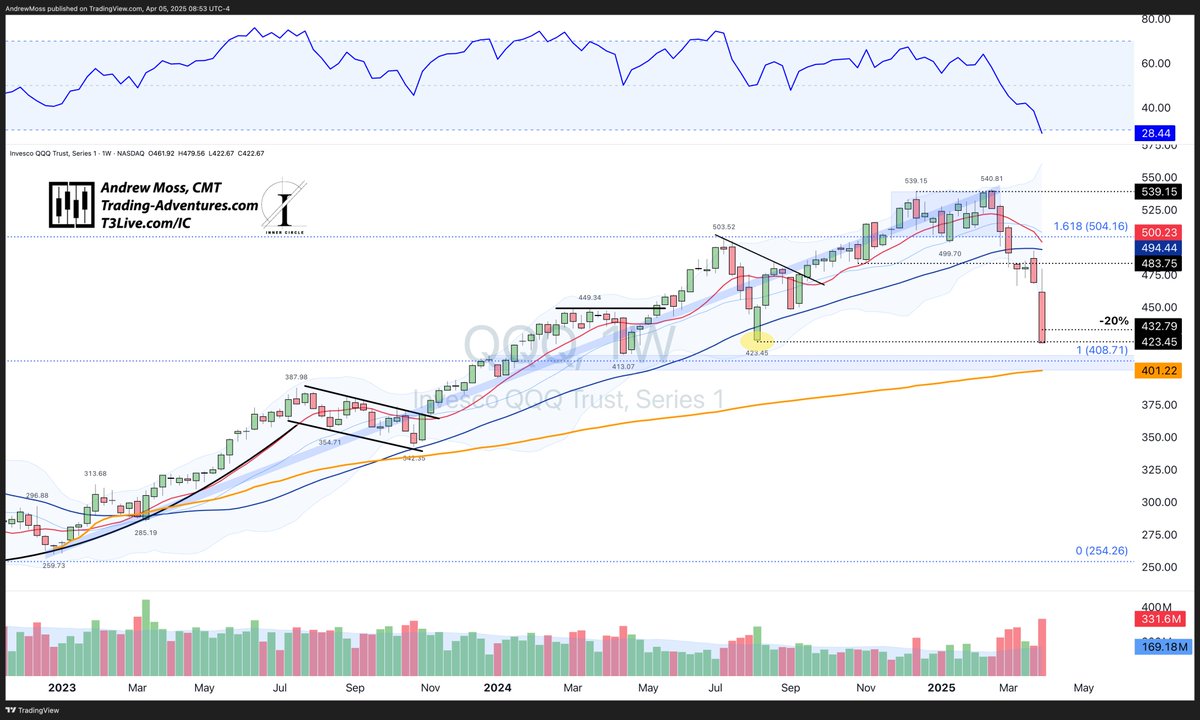
 $QQQ bounced from the 10-week MA up to a new closing high $1 below the pivot high from mid-December.
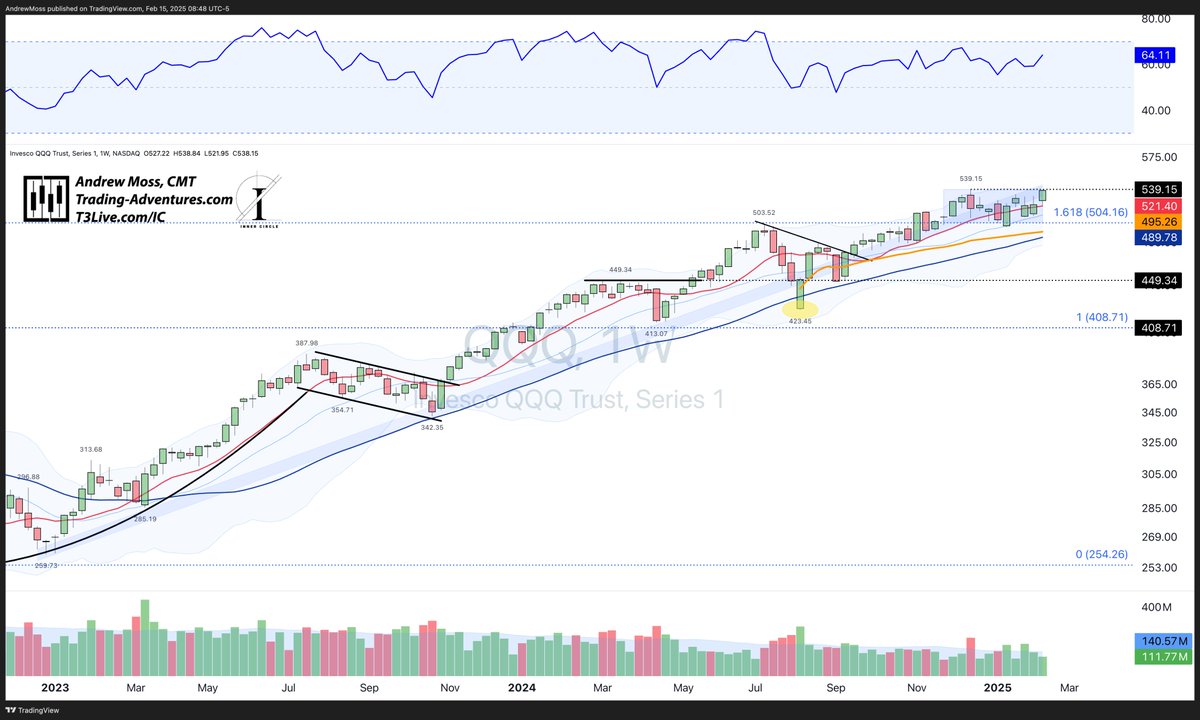
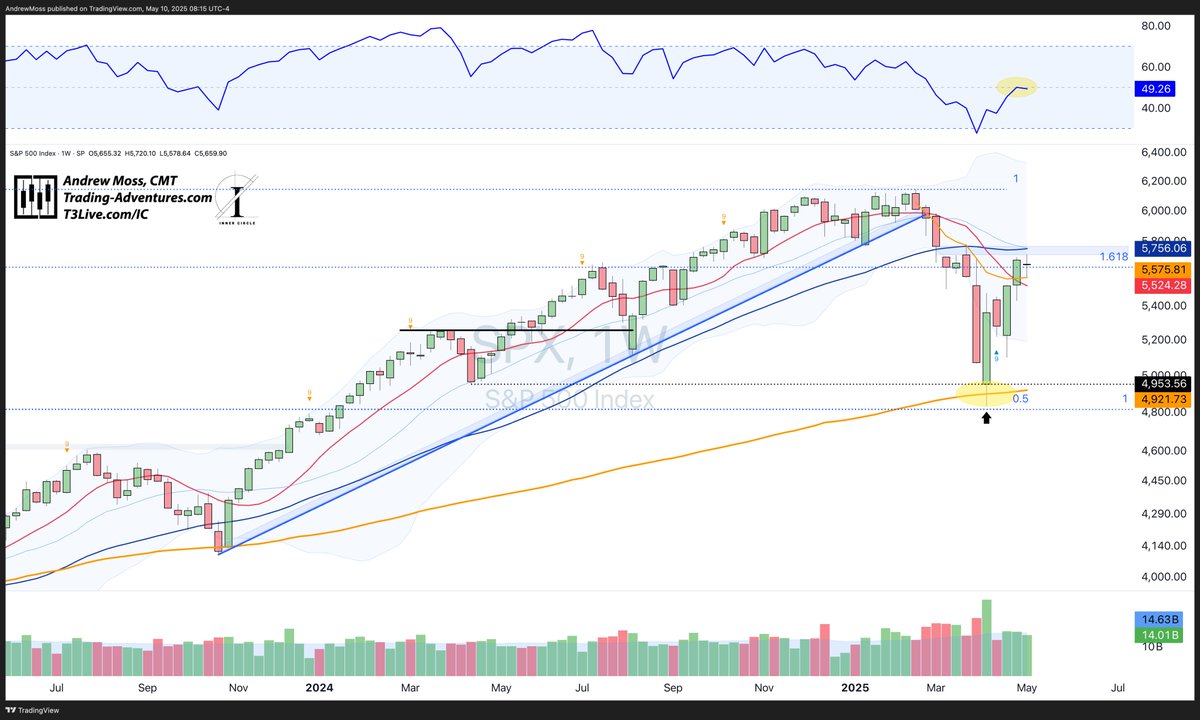
 $SPX with a strong bounce from the Aug. low AVWAP🟠and the trendline.
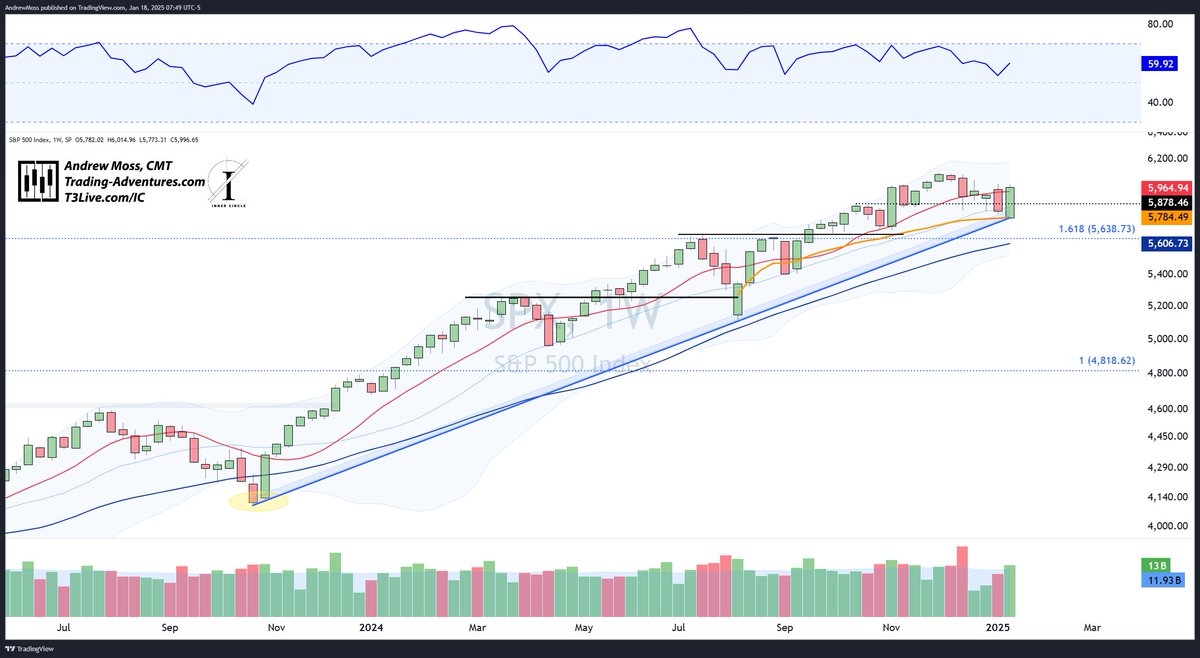
 $SPX moved into the lower half of the Bollinger Bands, nearly touching the August low AVWAP🟠
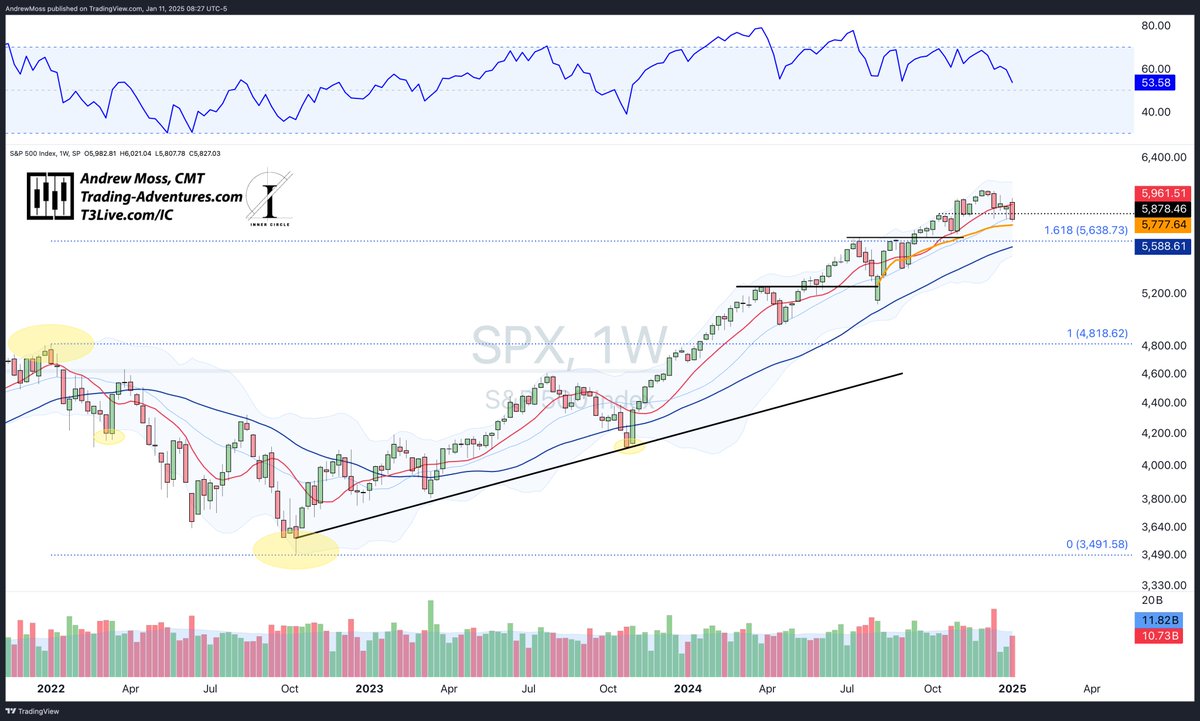
 $SPX has an inside week, resting on the 10-week MA. RSI remains bullish, while the weekly volume was about half the average.
 Now moving to $QQQ