Andrew Moss, CMT Profile picture
Sep 20 9 tweets 4 min read Read on X
Good morning☕️

📈Weekly Charts📉

A big week: Fed cut rates, indices pushed to new highs, small caps reclaimed leadership, and leaders kept pressing higher.

Let’s take a look at the charts that matter most 👇 Image

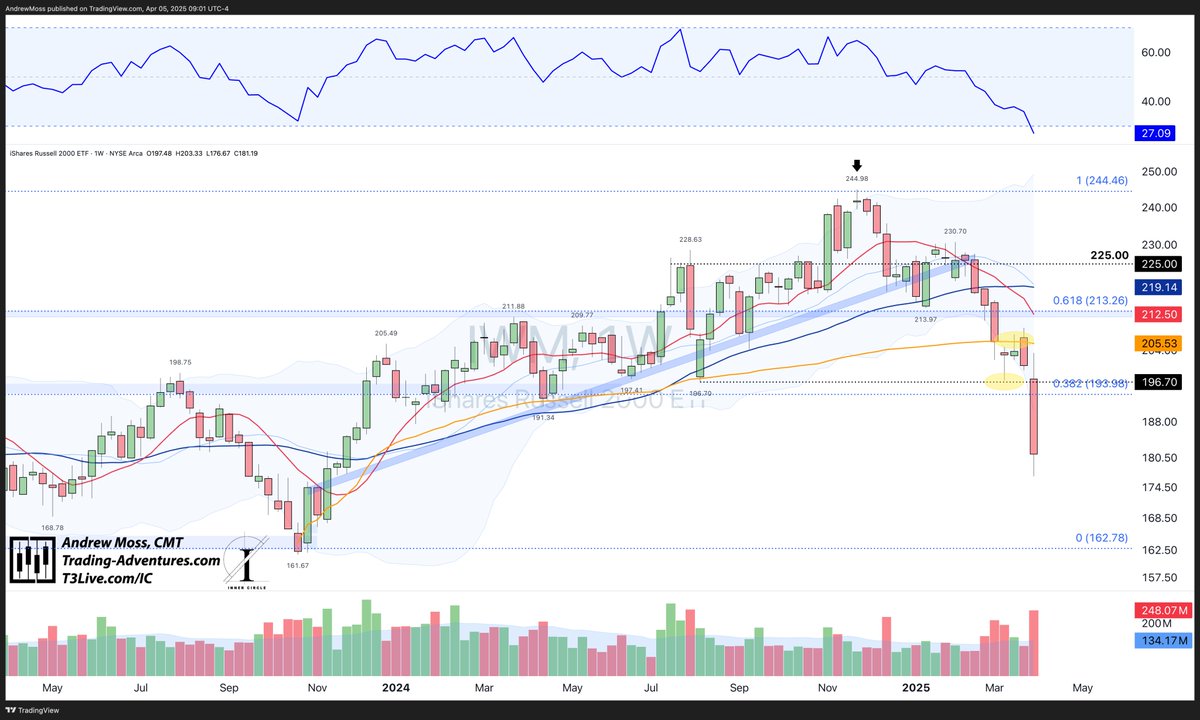
$IWM gets the starting spot this week with a new all-time high weekly close.

It’s been a long road back to the $240s — a level that’s been resistance before.

📊Volume was heavy this week. RSI not yet overbought.

The question now ➡ follow-through or another stall?

The next extension level higher doesn't come in until near ~$295s.

Below, there is potential support near ~$229-$230, the 10-week MA🔴and the AVWAP🟠 from the July test of support pivots and the 40-week MA🔵.Image
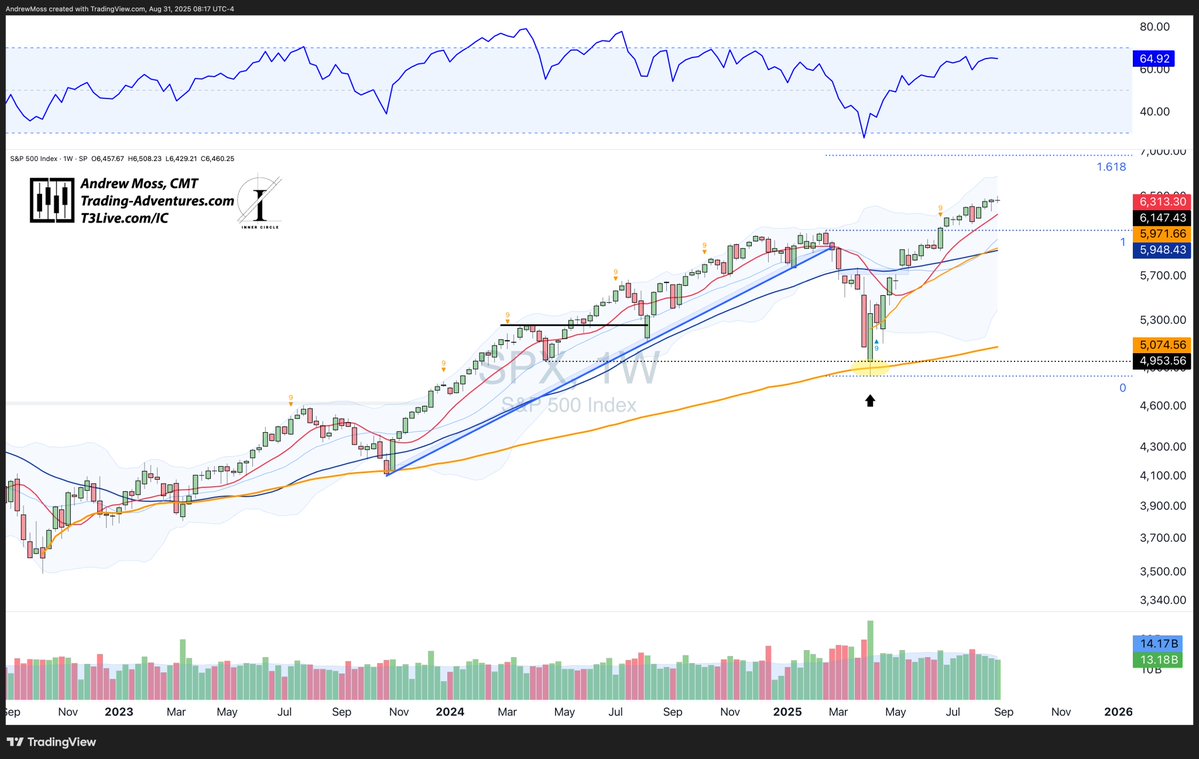
$SPX extended its bounce from the 10-week MA, taking RSI > 70, and moving on high volume.

7000 and the 1.618 extension are getting closer. Image
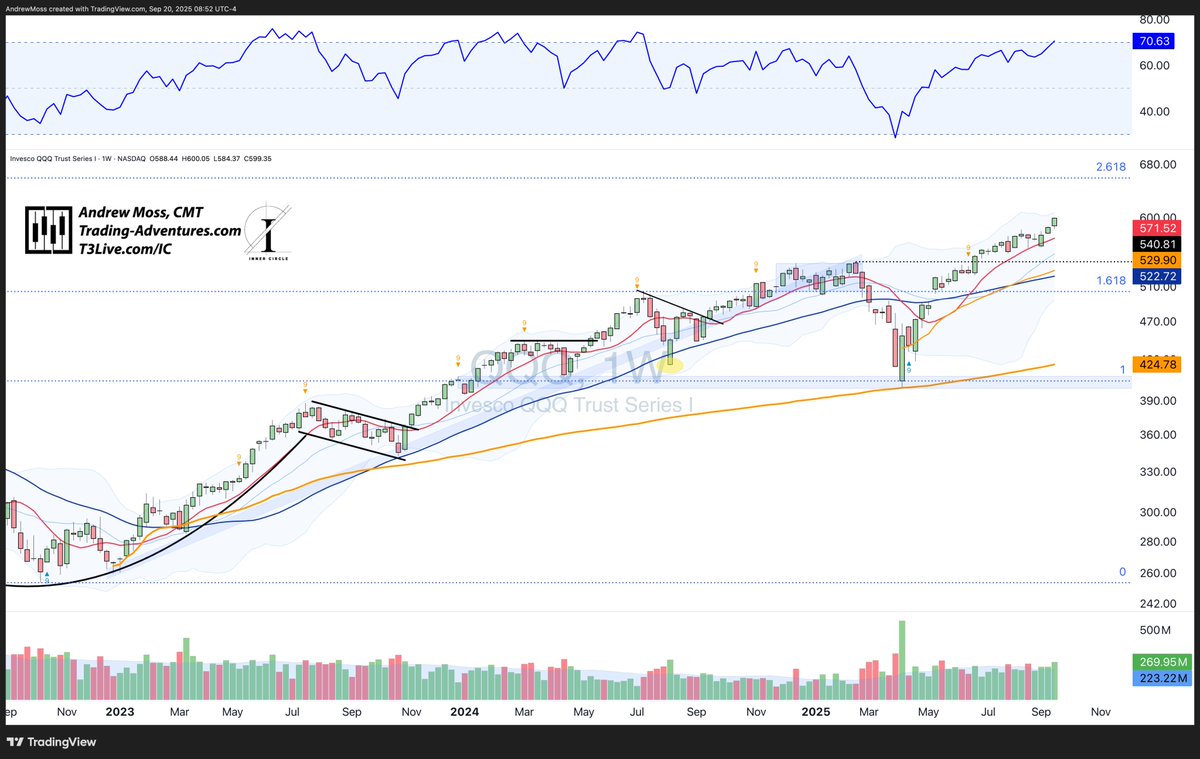
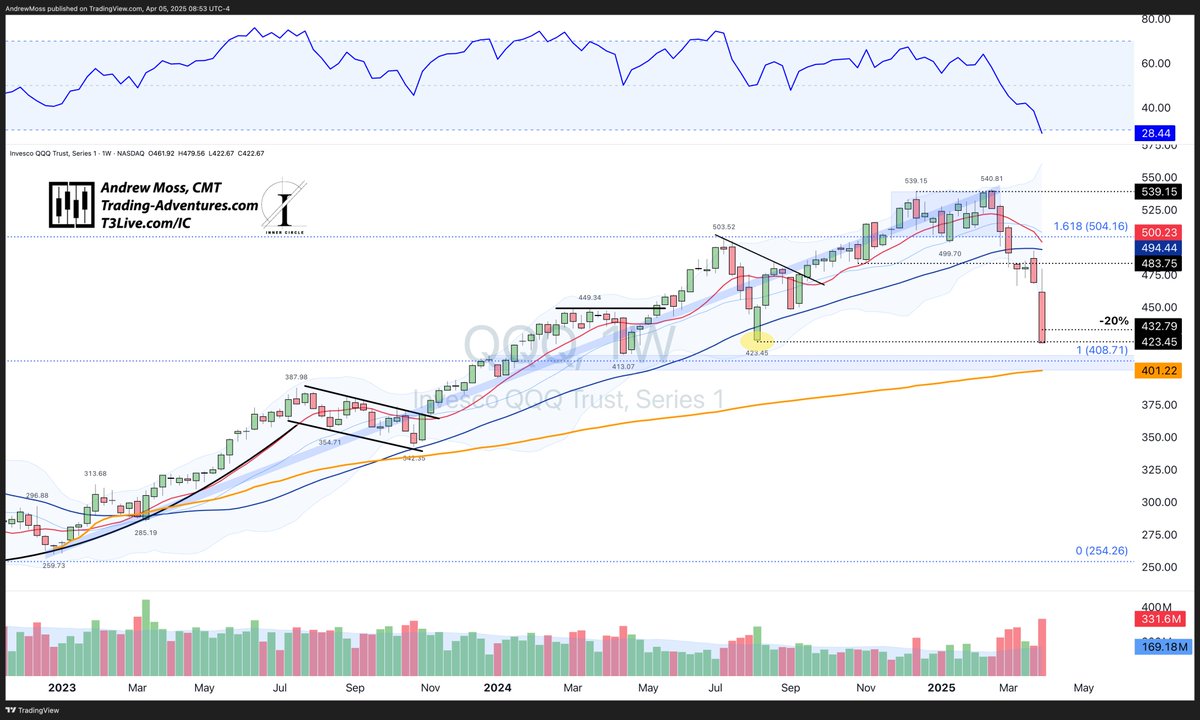
$QQQ with its 3rd week higher as well, nearing the upper Bollinger Band while taking the weekly RSI > 70 and into 'overbought' status.

Volume was also above average. Image
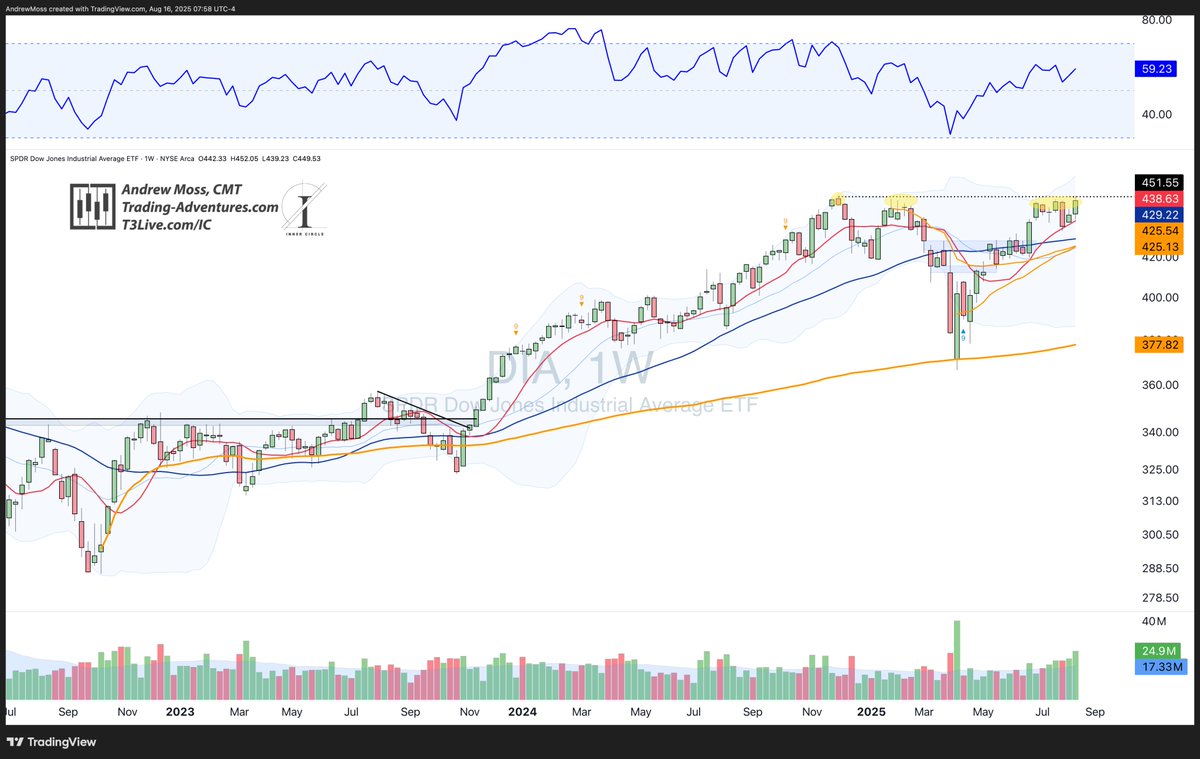
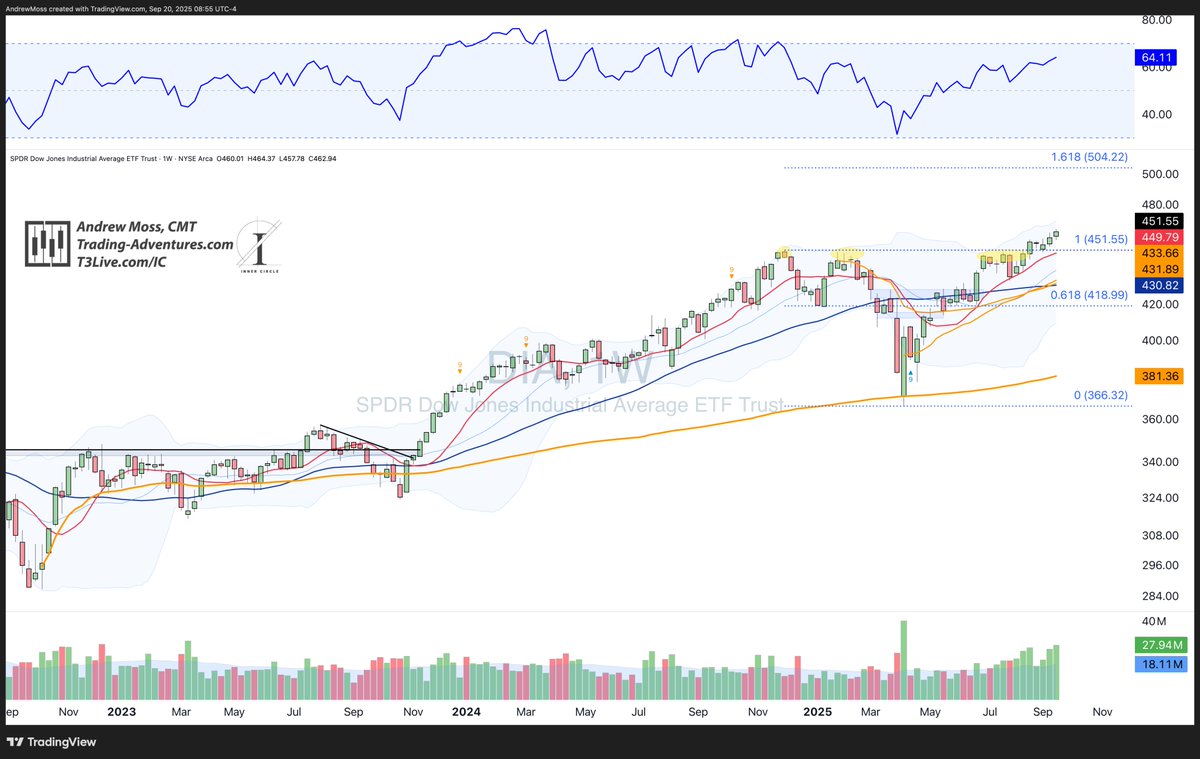
$DIA rounds out the perfect 4/4 week.

RSI at 64 leaves plenty of room for more momentum, and the next extension is $504.22.

Support could be found near $449-$451. Image
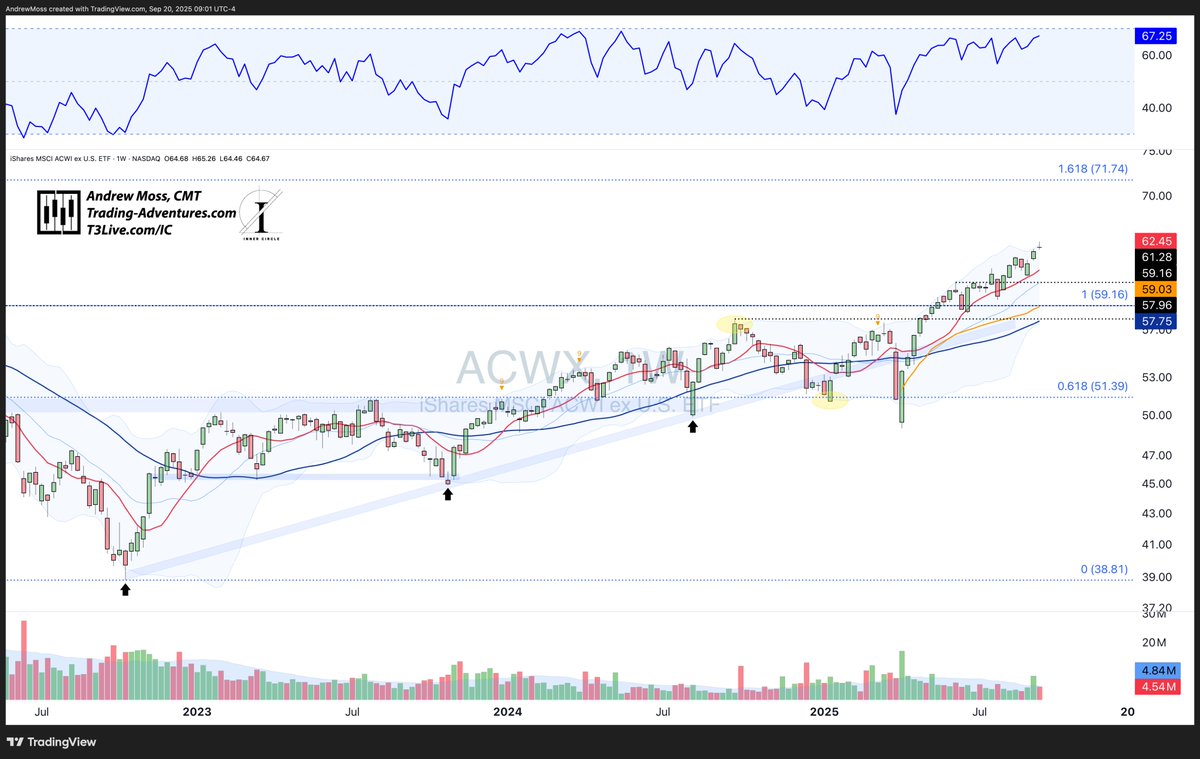
Moving overseas - $ACWX The Rest Of The World was up too, but with a potential topping candle in the form of a shooting star candle at the upper Bollinger Band.

📈That's one sign of extension. OTOH, the 10-week MA isn't that far below, and RSI is still below 70.

🔃This could pull back into the lower $60s from here, or push on towards the next ext. level at $71.74.Image
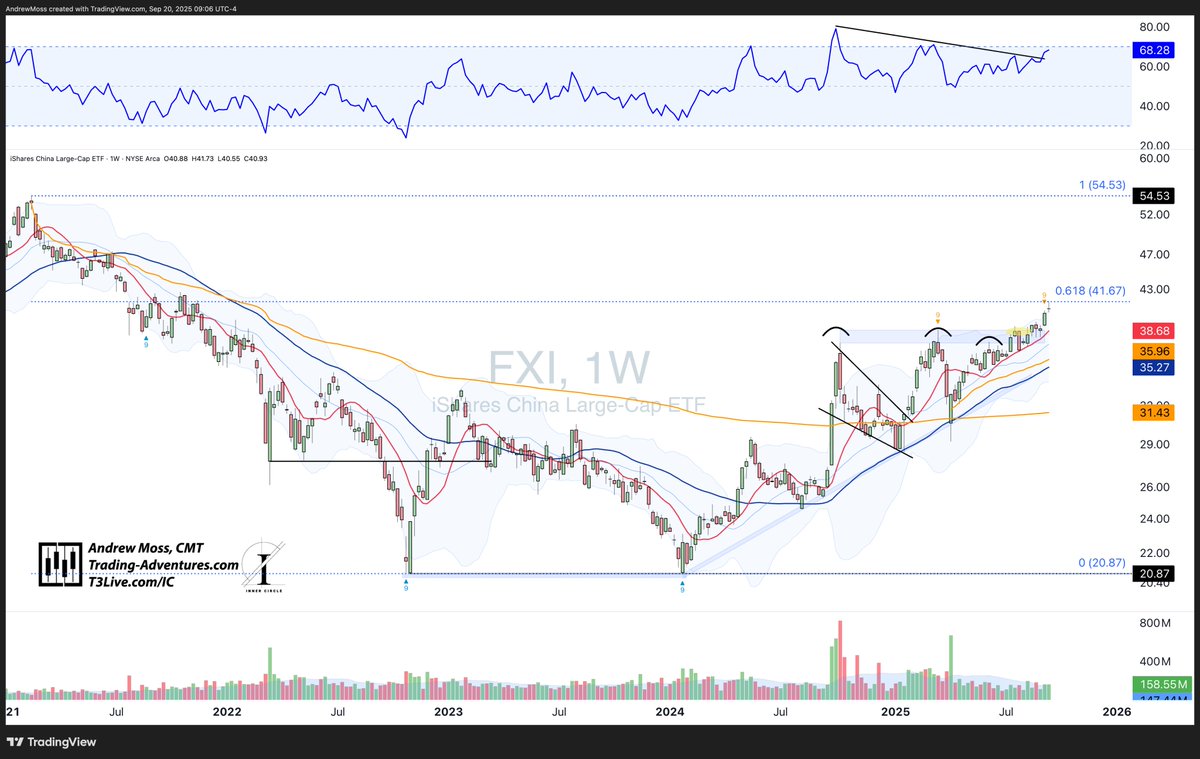
🇨🇳 $FXI China has a similar look, but with the added factor of a retracement level adding some resistance.

RSI followed prices higher, while the DeMark 9 setup has proven to be (at least) a week early. Image
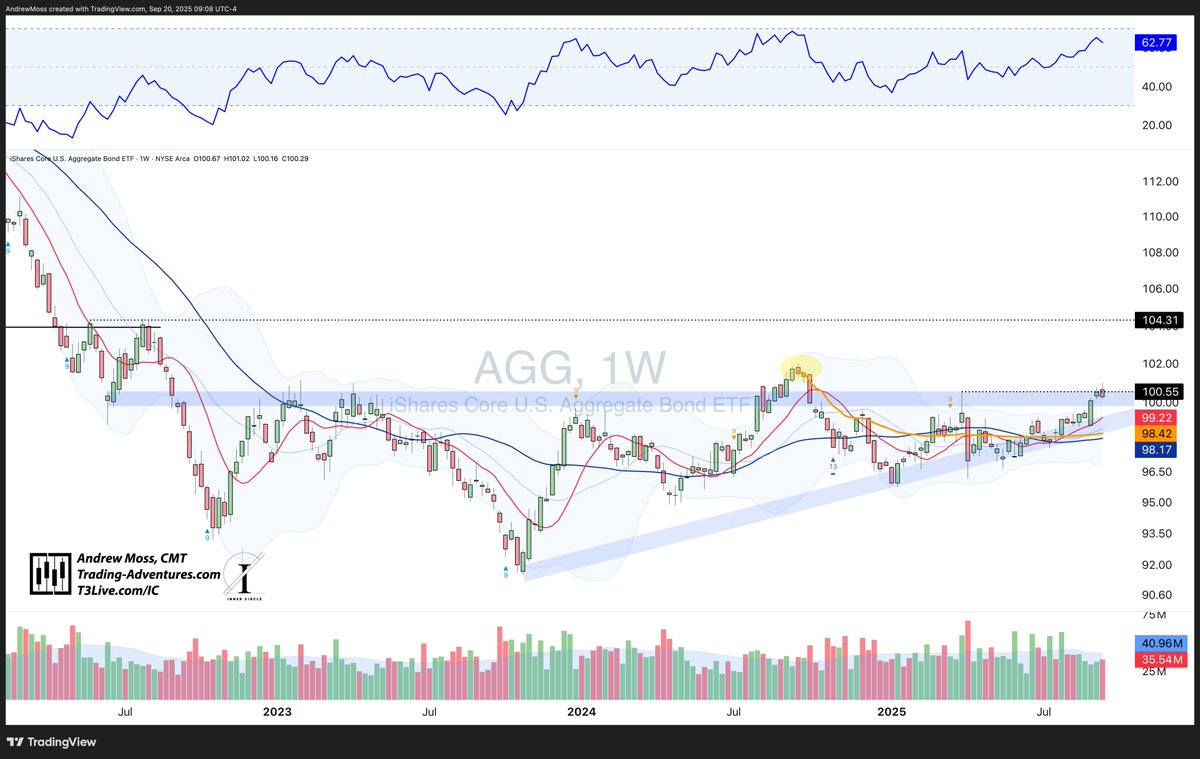
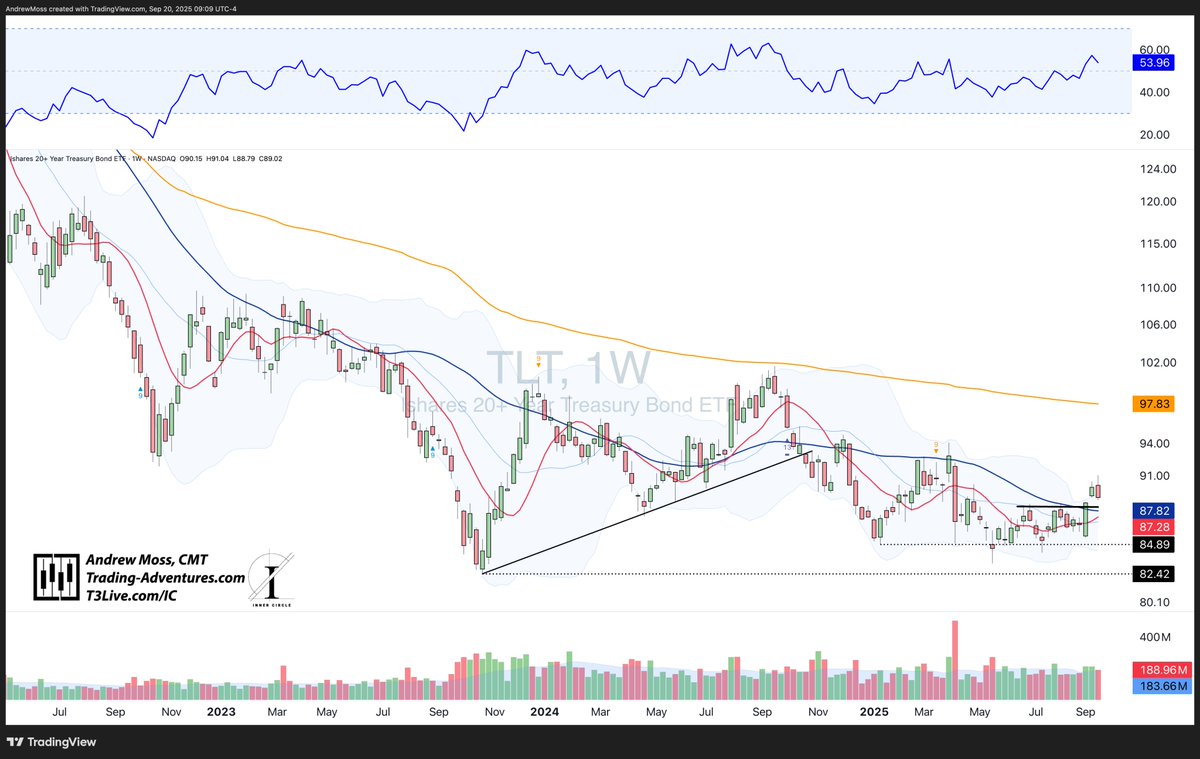
High-quality bonds with a bit of an 'about face' this week.

↩️ $AGG and $TLT reversed last week's breakout action.

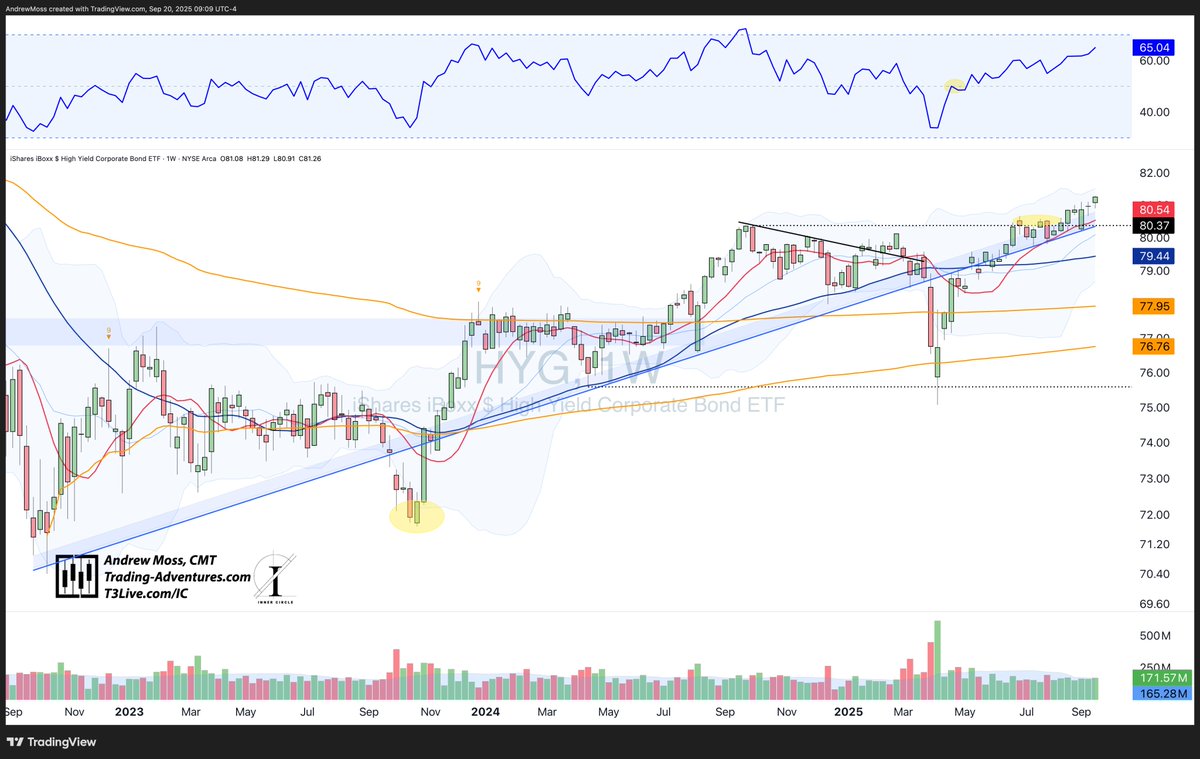
But high-yield buyers were still present, taking $HYG smoothly upward along the trend area. Image
Image
Image
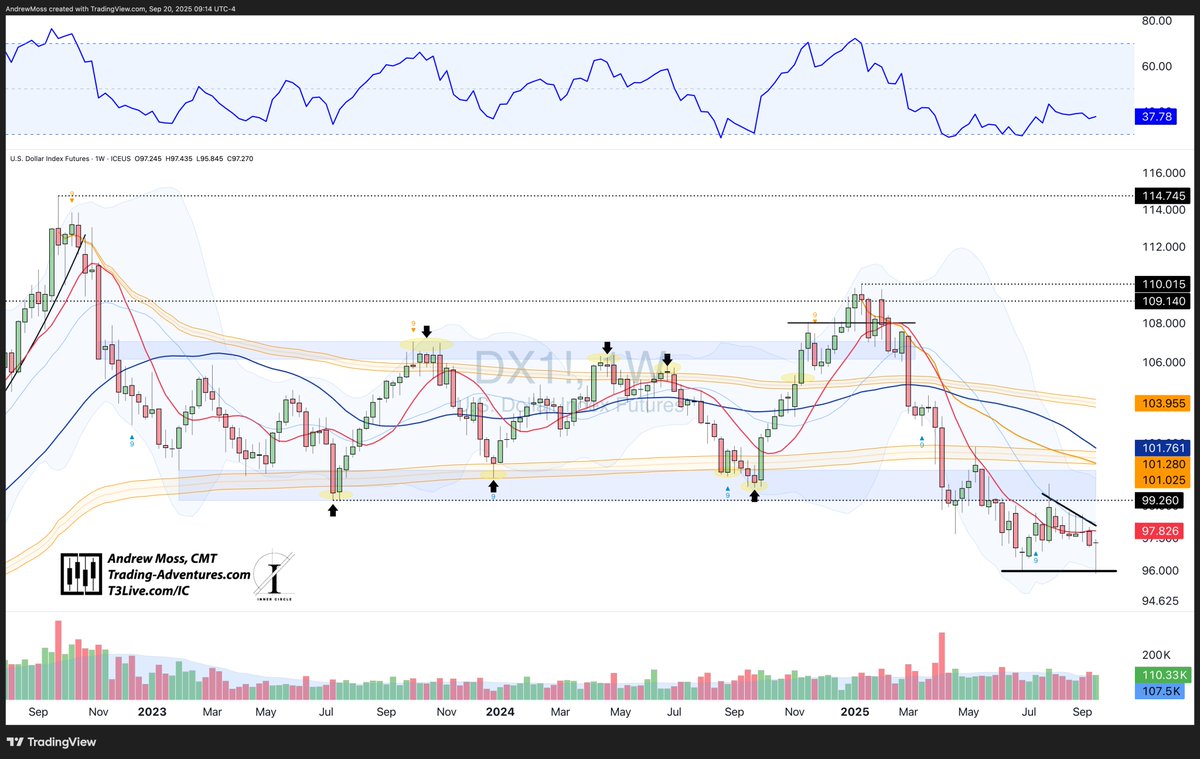
$DXY $DX1! The Dollar showed signs of life with a strong reversal off the pivot, leaving a very long shadow on the bottom of this weekly candle.

There should be plenty of resistance just above, so this is far from a decisive move. We'll see if price action confirms in coming weeks.Image

• • •

Missing some Tweet in this thread? You can try to force a refresh
 

Keep Current with Andrew Moss, CMT

Andrew Moss, CMT Profile picture

Stay in touch and get notified when new unrolls are available from this author!

Read all threads

This Thread may be Removed Anytime!

PDF

Twitter may remove this content at anytime! Save it as PDF for later use!

Try unrolling a thread yourself!

how to unroll video
  1. Follow @ThreadReaderApp to mention us!

  2. From a Twitter thread mention us with a keyword "unroll"
@threadreaderapp unroll

Practice here first or read more on our help page!

More from @Andy__Moss

Sep 13
Good morning☕️

📈Weekly Charts📉are back! With Strength💪across the board.

✔️New highs. Broad participation. Even bonds are breaking out.
❔While some seasonality concerns linger, the weight of the evidence remains bullish — for now.

Let’s zoom out and break it down.👇 Image
$SPX

📈Another new weekly closing high, up ~3.5% from last week’s low.
📊Volume? Above average.
😎RSI? Rising, but not overbought (68.22).

💪Momentum and structure both remain strong. Image
$QQQ

✅ New all-time closing high
📈 Up ~4.75% from last week’s dip below the 10-week MA
🔊 Volume firm, RSI climbing but still reasonable
📏 Bollinger Bands still tightening — watch for expansion

Big tech leading again, with clean trend continuation. Image
Read 32 tweets
Aug 31
Ever zoomed out to just look at the $SPX S&P 500 sectors on a monthly chart?

If not, you should. The long-term trends speak volumes—if you’re tuned in.

Here’s what I’m seeing across the board this month 📈
You don’t need much to spot the trend.
No moving averages. Very limited commentary.

Just clean monthly charts that show where things stand.

$XLB Image
$XLC Image
Read 14 tweets
Aug 31
Good morning☕️

📈Weekly Charts📉 are here. Let's take a step back, consider the broader perspective, and get a feel for where markets might head next.

📌 Indexes, sectors, key levels
📌 Macro check-in
📌 Breadth

💯Clarity > prediction. Let’s dive in… Image
$SPX starts it off with a small range and indecisive action.

After hitting a new high, it came back down to close slightly lower for the week, signaling potential for reversal.

Confirmation of that would pair well with the weak September history, likely leading to a pullback.Image
$QQQ with an inside week, still well above the 10-week MA, with healthy volume and RSI. Image
Read 28 tweets
Aug 16
Good morning! ☕️

📈Weekly Charts📉

We've got some new highs, fresh rotations, and plenty of signals to track.

A lot to unpack this week.

Grab a coffee ☕ and let’s dive in🚀 Image
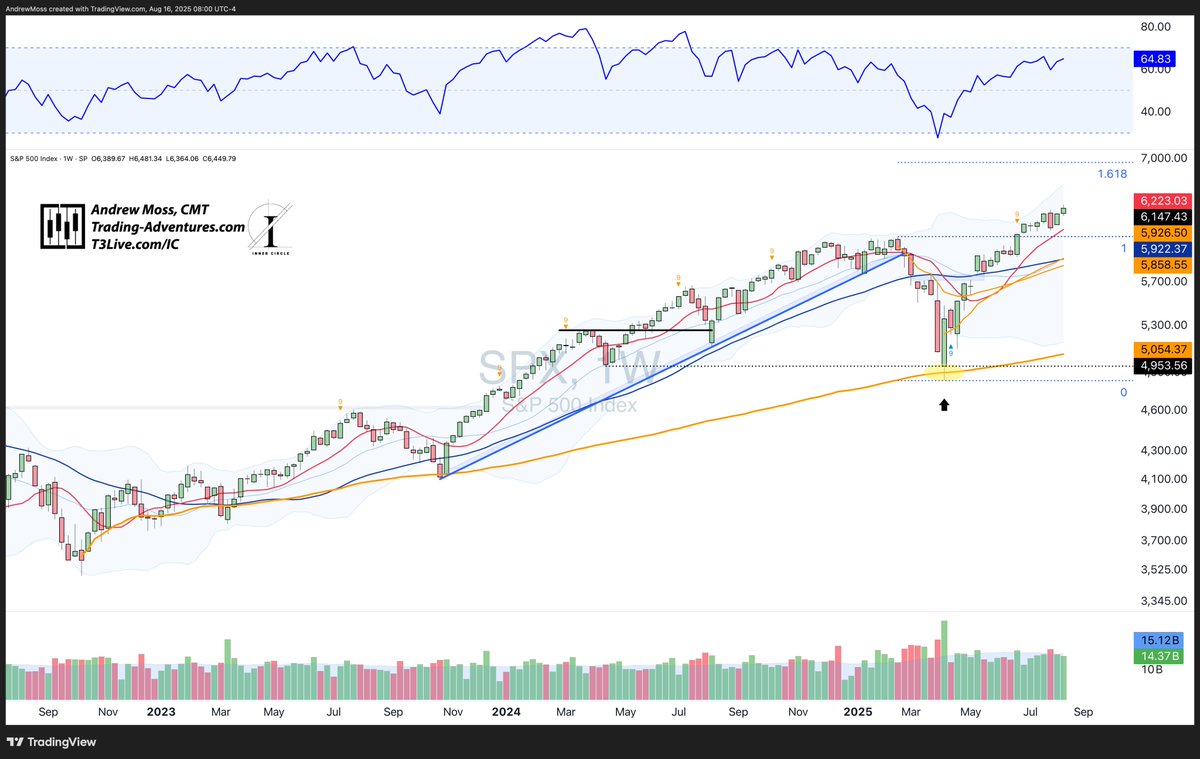
$DIA gets the starting spot today as it flirts with a new weekly all-time closing high. Missed by half a point.

The more times a level is tested, the more likely it is to give way. 📈 Image
$SPX did log a new high, resuming its steady, bullish climb. Image
Read 36 tweets
May 10
Good morning☕️

📈Weekly Charts📉 Here we go!

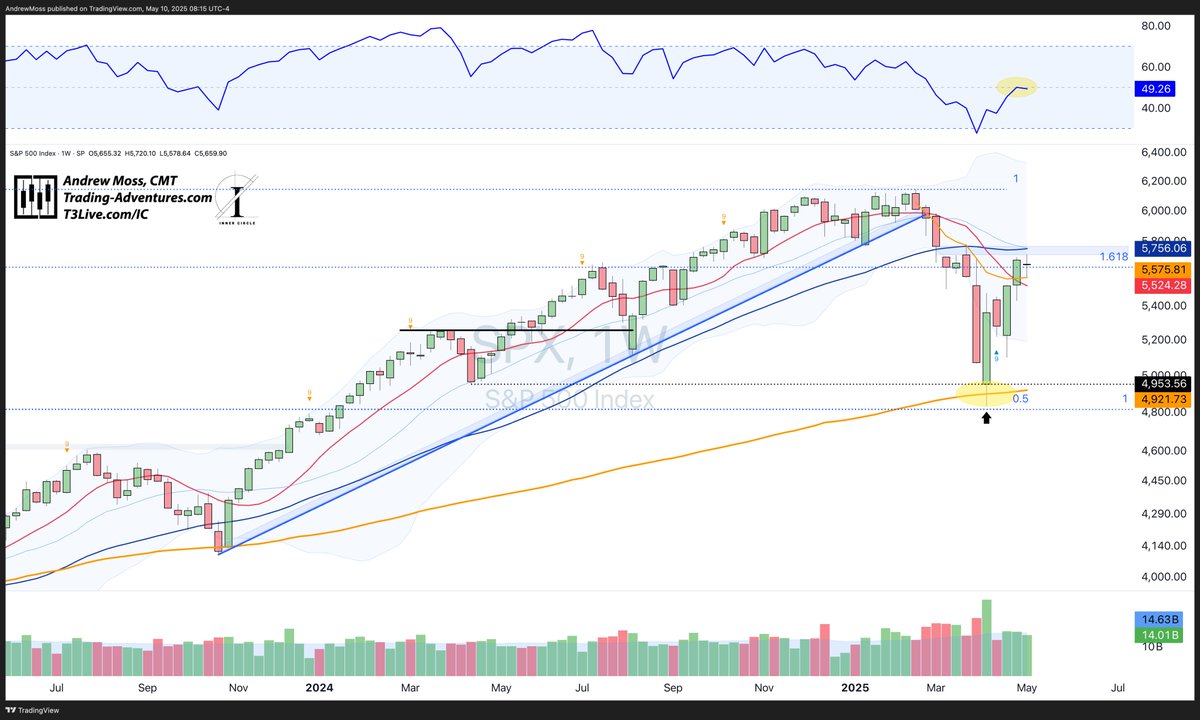
$SPX faced indecision this week, printing a spinning top candle -- meaning, the open and close were almost the same, and both landed right in the middle of the week's range.

🔵5756 is the 40-week MA above
🟠5575 is the AVWAP below

RSI is in the center, and volume was averageImage
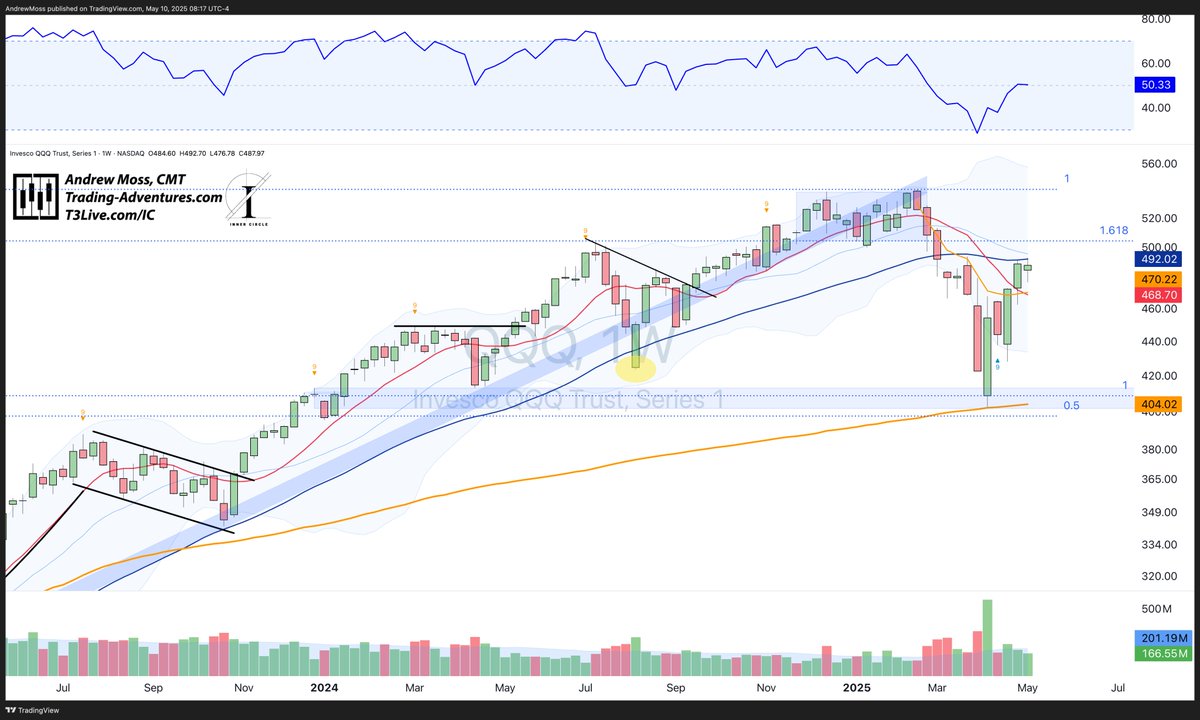
$QQQ spent another week testing the 40-week MA, but could not move above. Image
Both $SPX and $QQQ are still classified as 'a reactionary bounce in a flat to down trending market.'

The Bollinger Bands are pointing lower while price is still in the lower half of those bands, and below a flat 40-week MA with RSI exactly in the middle.
Read 23 tweets
Apr 5
Good morning☕️

Welcome to the📈Weekly Charts📉thread. Grab a coffee (or two) and let's have a look at the destruction. 🔴

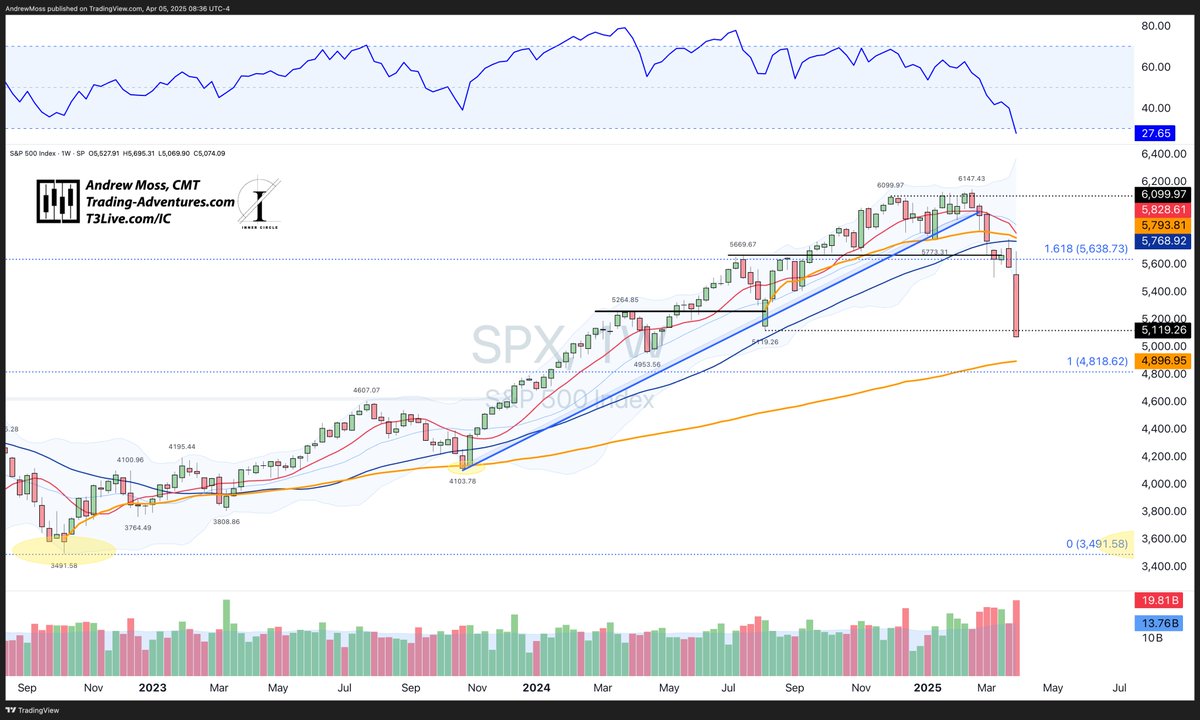
Stocks took another Tariff Tumble this week w/ $SPX falling nearly🔻-10% from last week's close.

Prices ended the week below the August 5 pivot low with the selling coming on heavy volume.

Weekly RSI is < 30, a condition not seen since the COVID crash when this index dropped ~35%. It is currently down about half that much, or -17% from the high weekly close.

The next potential support levels on this chart come with pivots near 4818 and 4953, with an AVWAP🟠 from the Oct. '22 low at 4896.Image
$QQQ has exceeded the -20% drawdown mark (~$432), closing the week very close to the August pivot low.

RSI is < 30, and volume was almost double the average.

Potential support is roughly near $400-$410 in a series of pivots and the AVWAP🟠from the start of the uptrend. Image
$IWM after 3 weeks of struggle with the Oct. low AVWAP, small caps gave up the fight and fell into the $170s before getting a slight bounce.

RSI = oversold. Volume was very high. Image
Read 21 tweets

Did Thread Reader help you today?

Support us! We are indie developers!


This site is made by just two indie developers on a laptop doing marketing, support and development! Read more about the story.

Become a Premium Member ($3/month or $30/year) and get exclusive features!

Become Premium

Don't want to be a Premium member but still want to support us?

Make a small donation by buying us coffee ($5) or help with server cost ($10)

Donate via Paypal

Or Donate anonymously using crypto!

Ethereum

0xfe58350B80634f60Fa6Dc149a72b4DFbc17D341E copy

Bitcoin

3ATGMxNzCUFzxpMCHL5sWSt4DVtS8UqXpi copy

Thank you for your support!

Follow Us!

:(