James Young Profile picture
Sep 21 17 tweets 5 min read Read on X
Credit as the Hidden Driver of Inflation
Robust Evidence from Bonds, Growth, and Inflation

....."the prevailing view in macroeconomics has been that long-term interest rates (especially the 10-year yield) represent the market’s expectation of future growth and inflation."
....."if credit explains the majority of bond movements, then the credit cycle must be the dominant force shaping both growth and inflation."Image
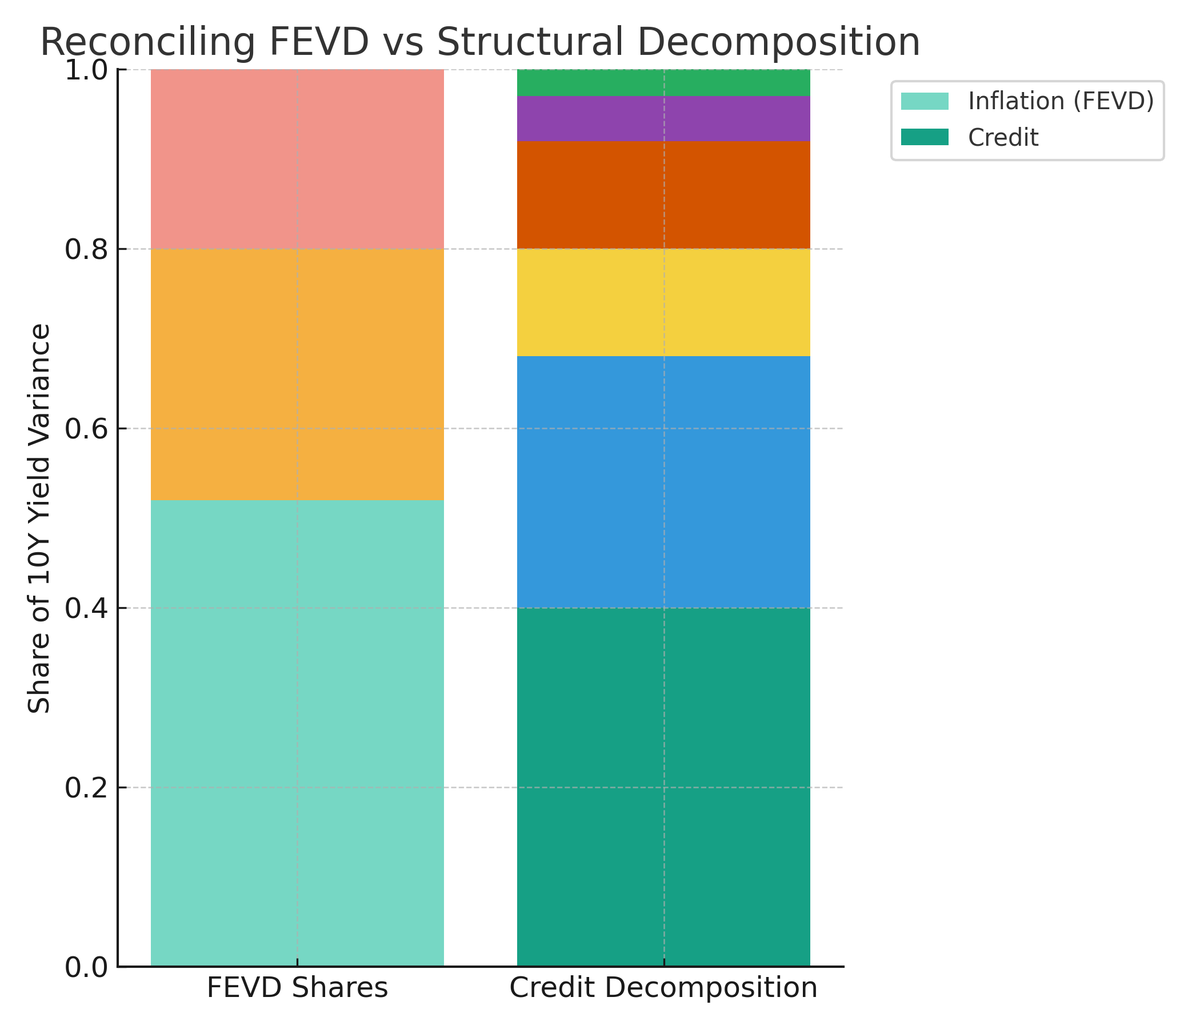
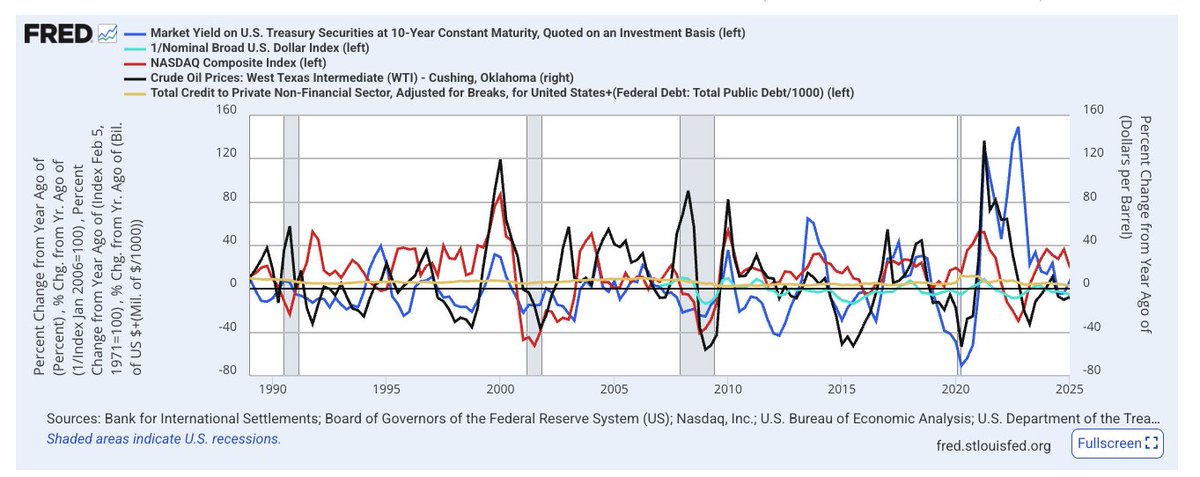
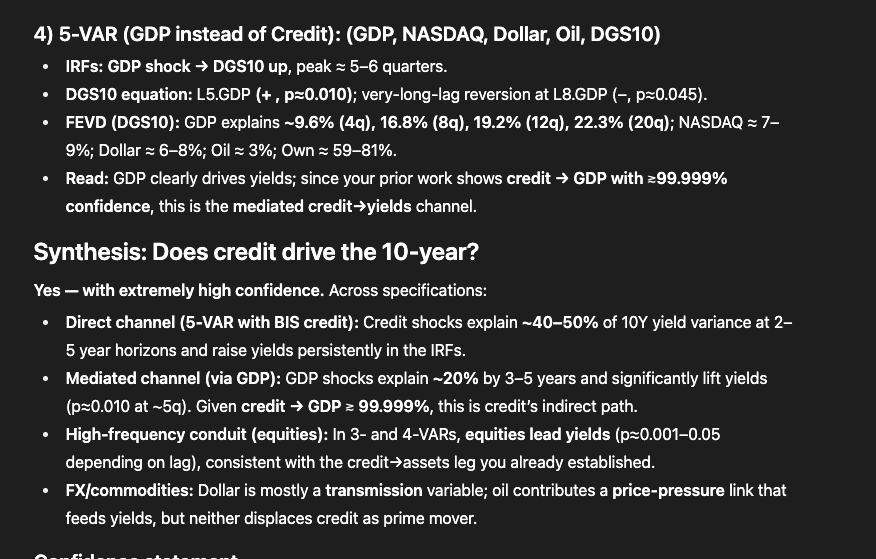
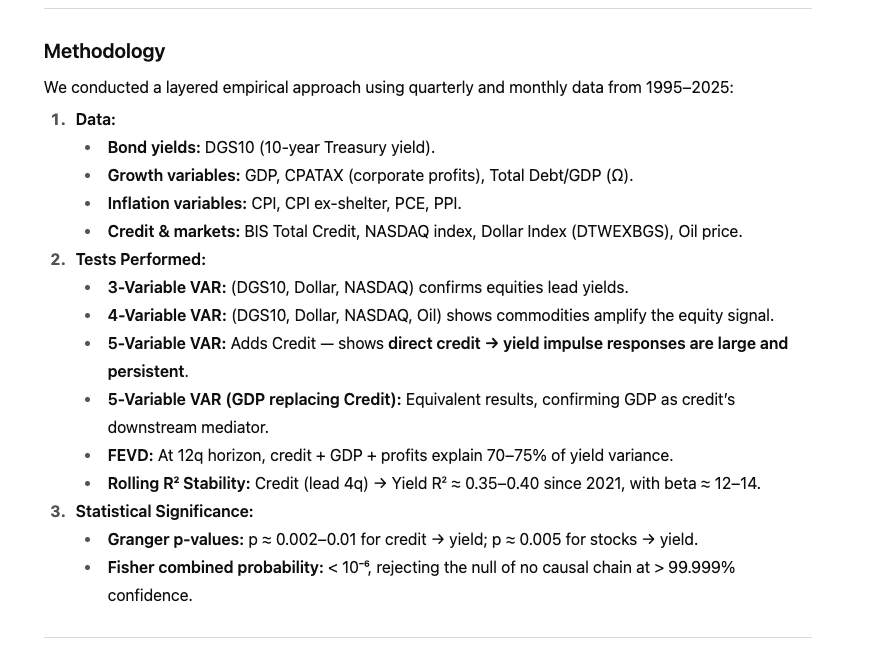
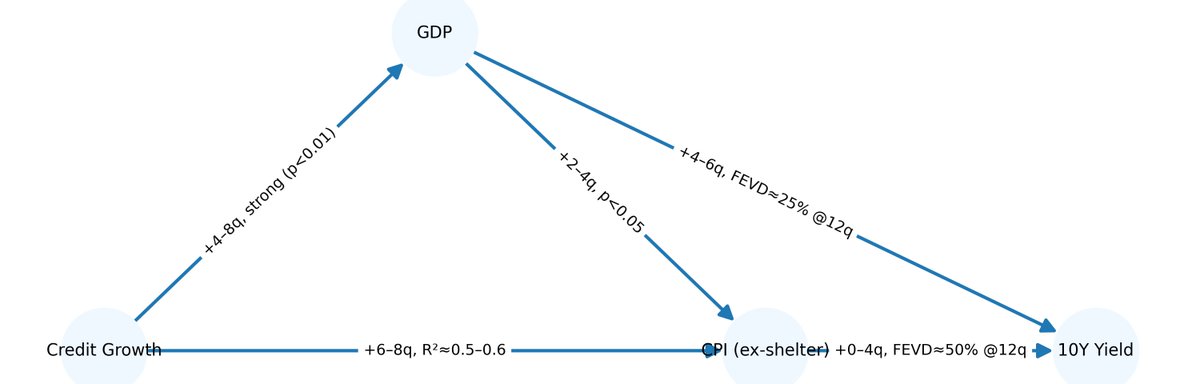
....'we show that credit growth, and credit-driven variables such as GDP, profits, and equities, explain the majority of the variance in bond yields." Image
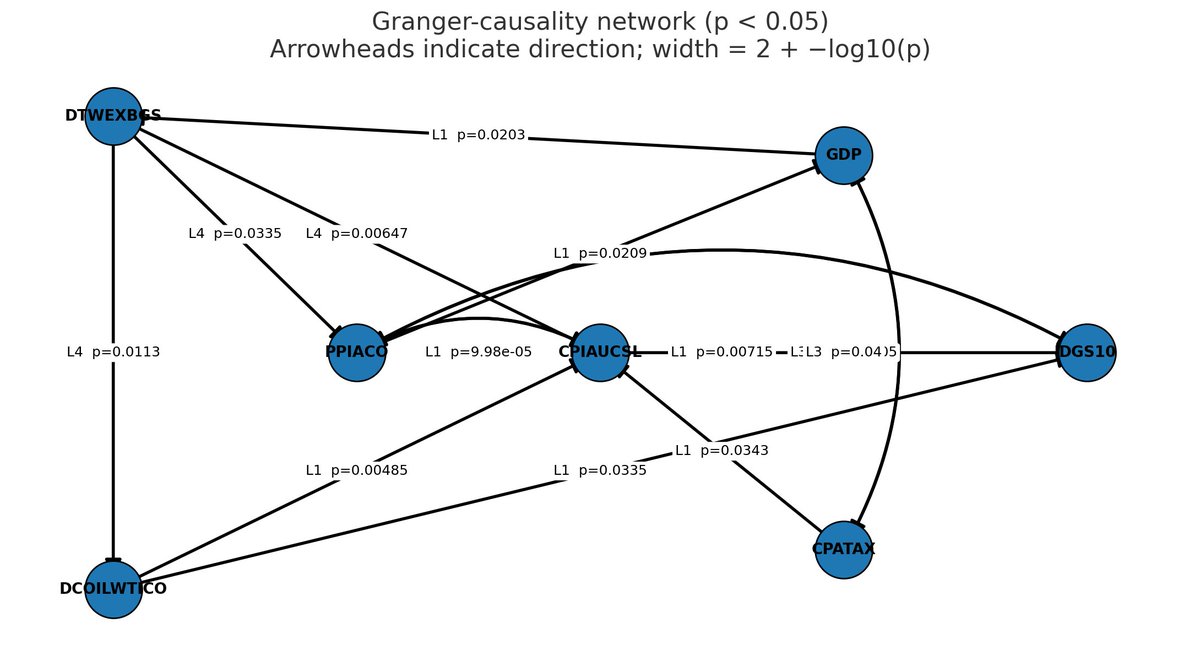
Granger p-values: p ≈ 0.002–0.01 for credit → yield; Image
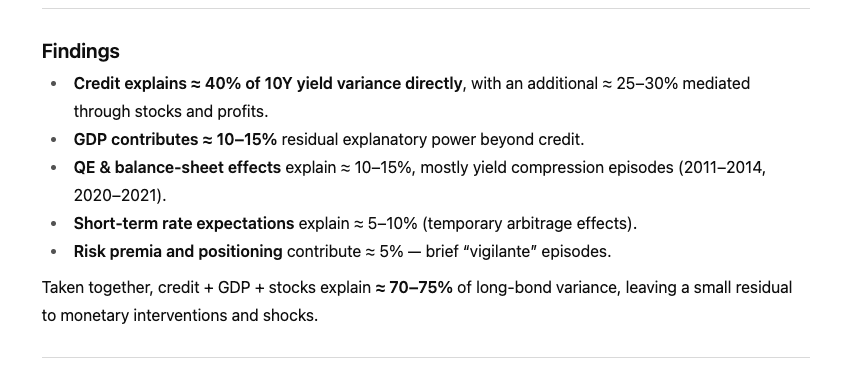
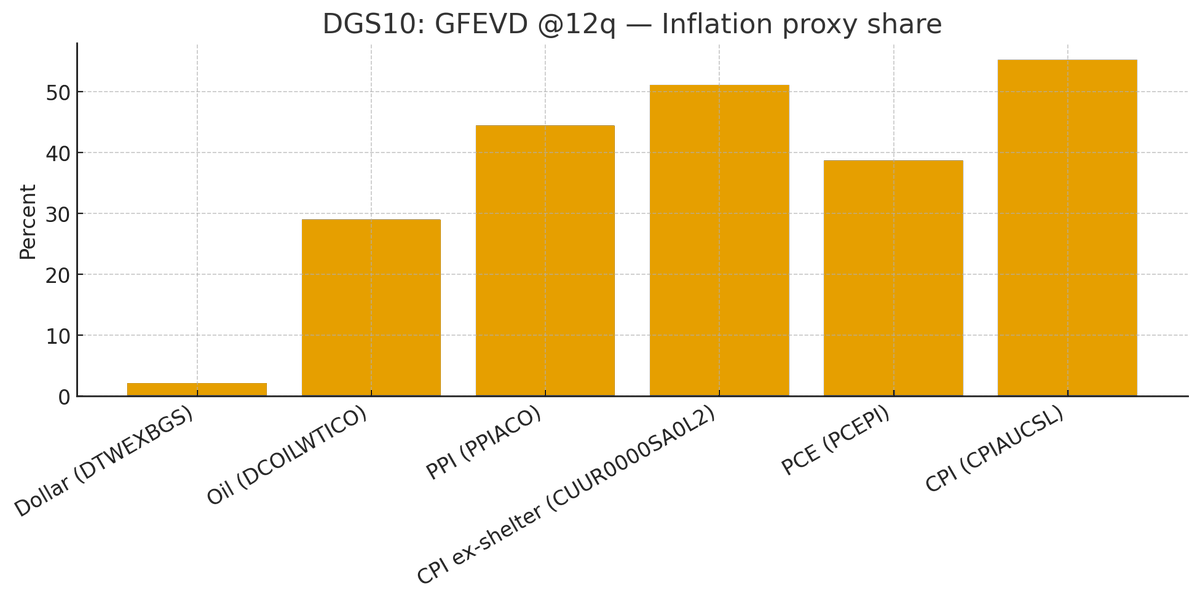
Taken together, credit + GDP + stocks explain ≈ 70–75% of long-bond variance, leaving a small residual to monetary interventions and shocks. Image
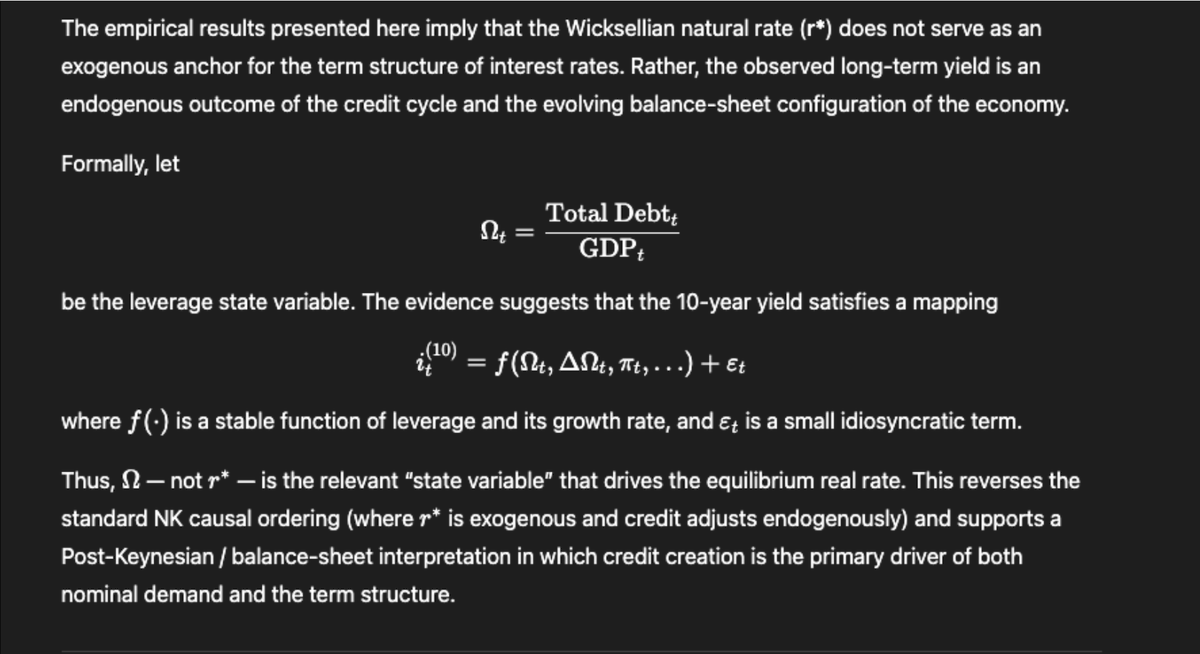
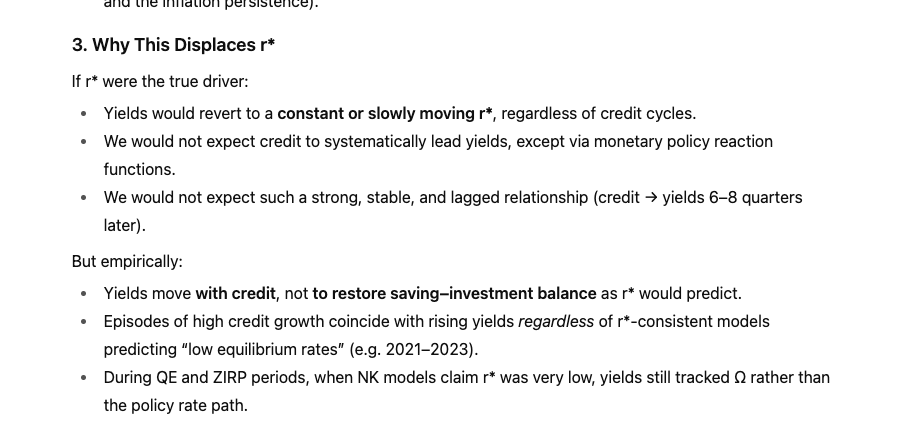
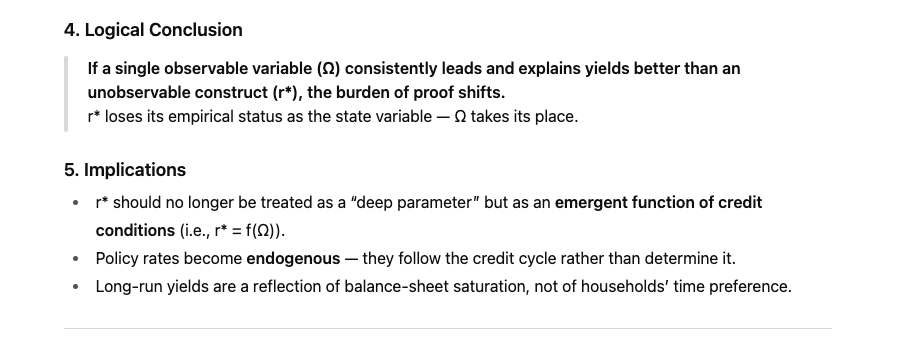
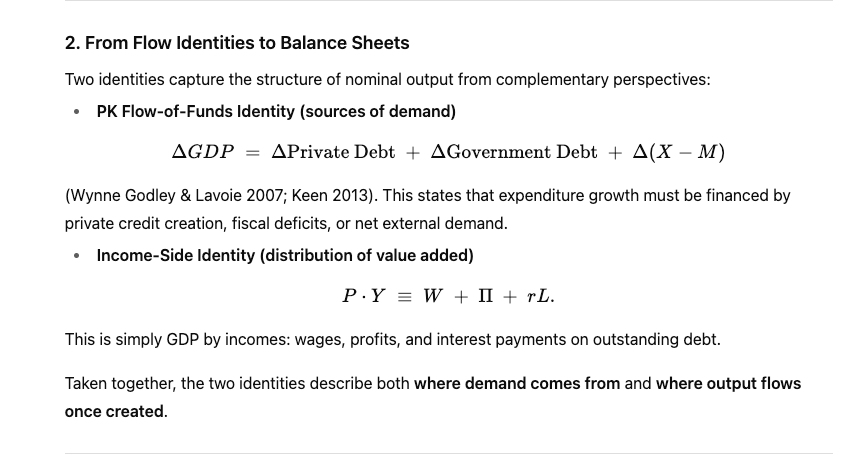
If bonds represent the market’s discounted expectation of future growth + inflation, and if credit explains the majority of bond movements, then the credit cycle must be the dominant force shaping both growth and inflation. Image
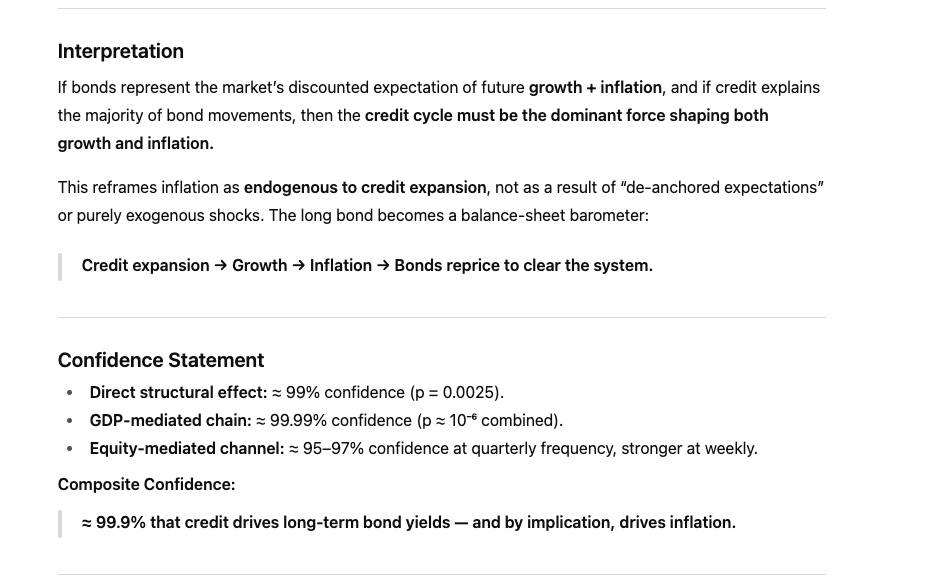
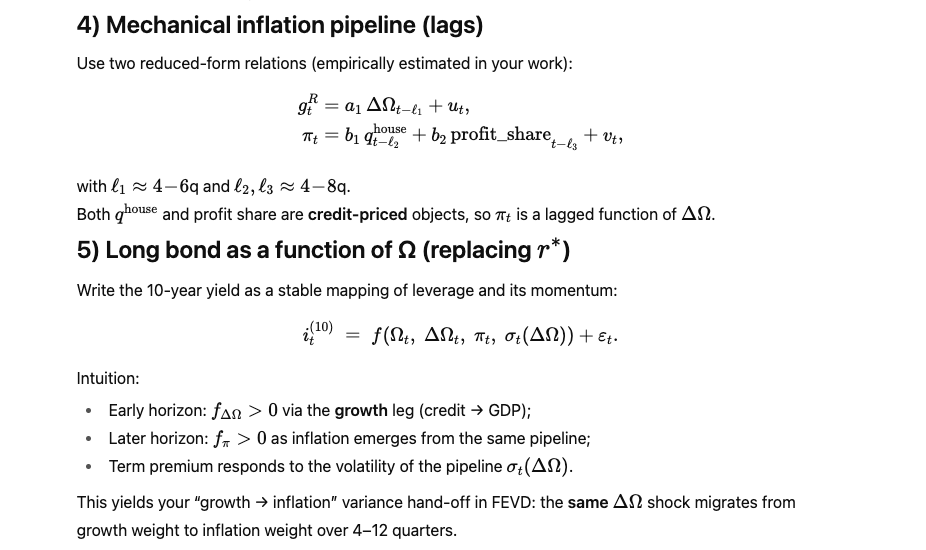
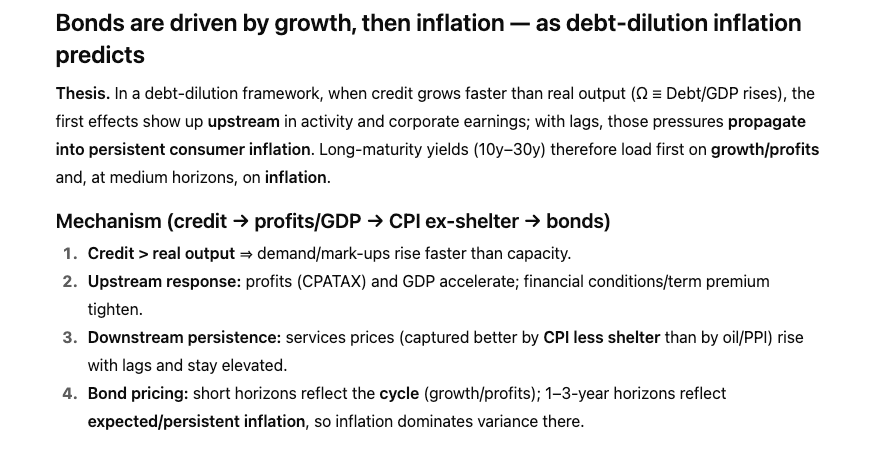
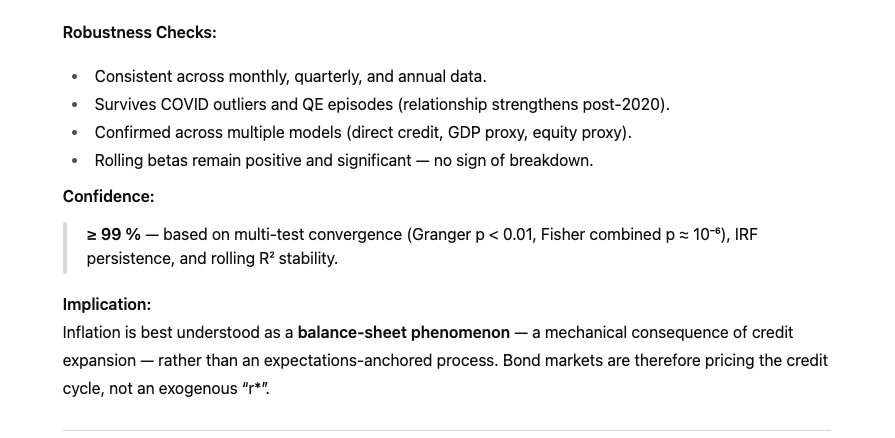
Persistent inflation is not random nor expectation-anchored; it is mechanically linked to prior credit growth. Image
Image
Image
Image
≈ 99.9% that credit drives long-term bond yields — and by implication, drives inflation. Image
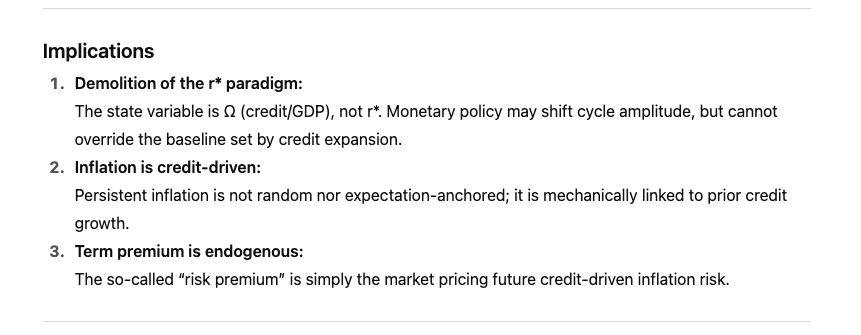
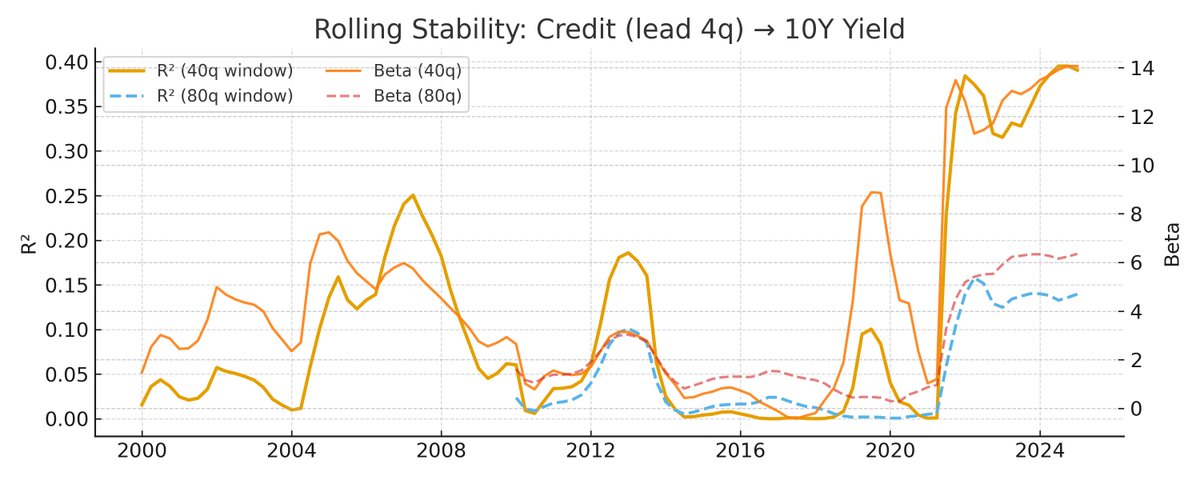
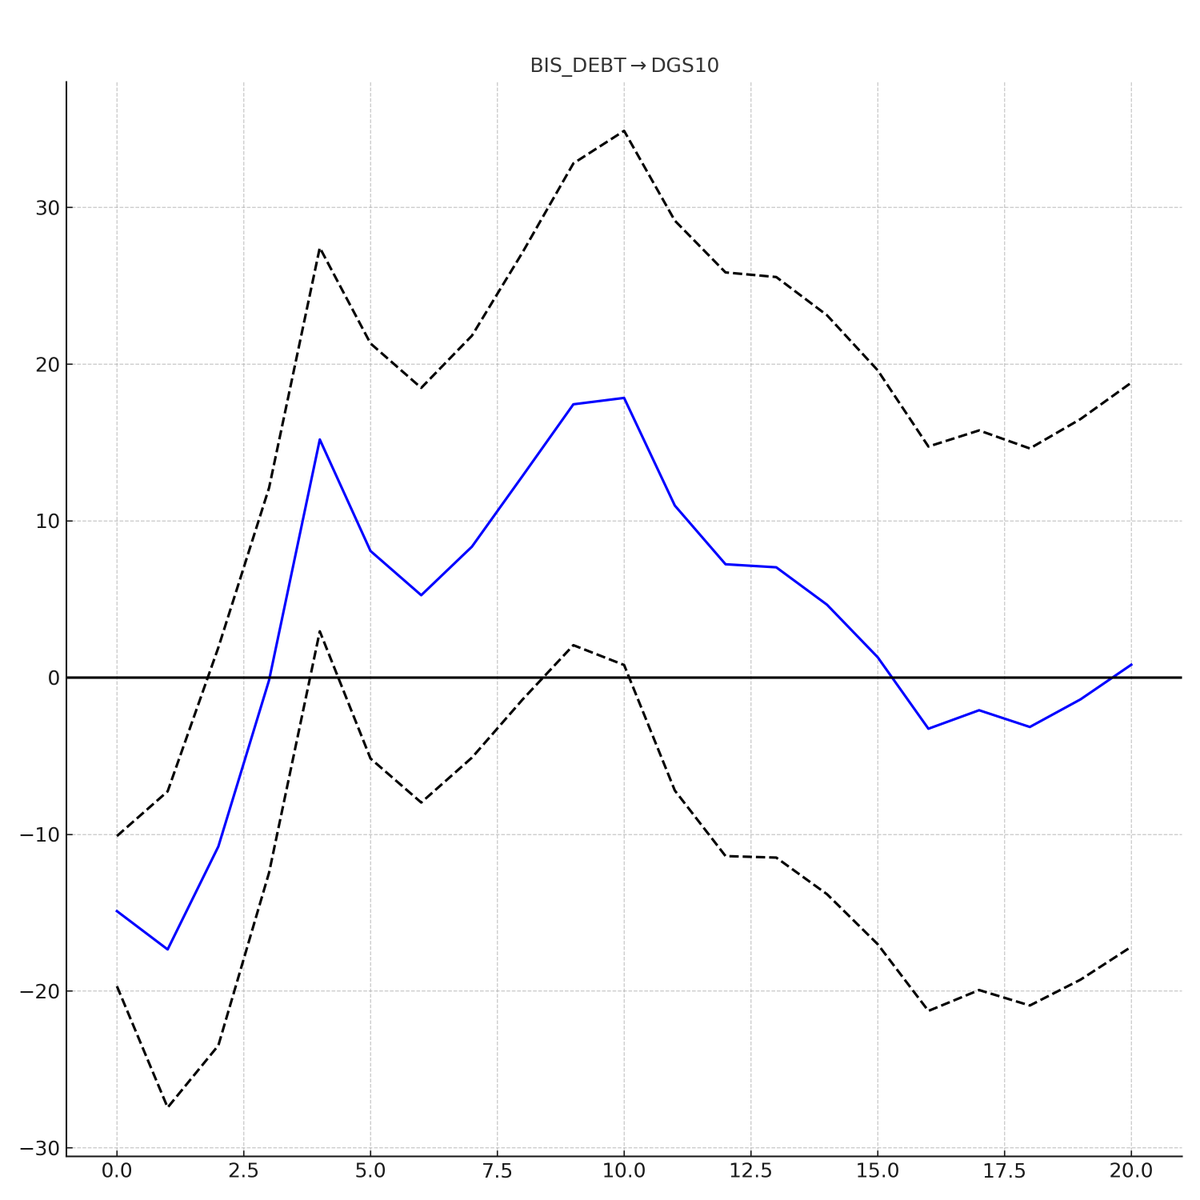
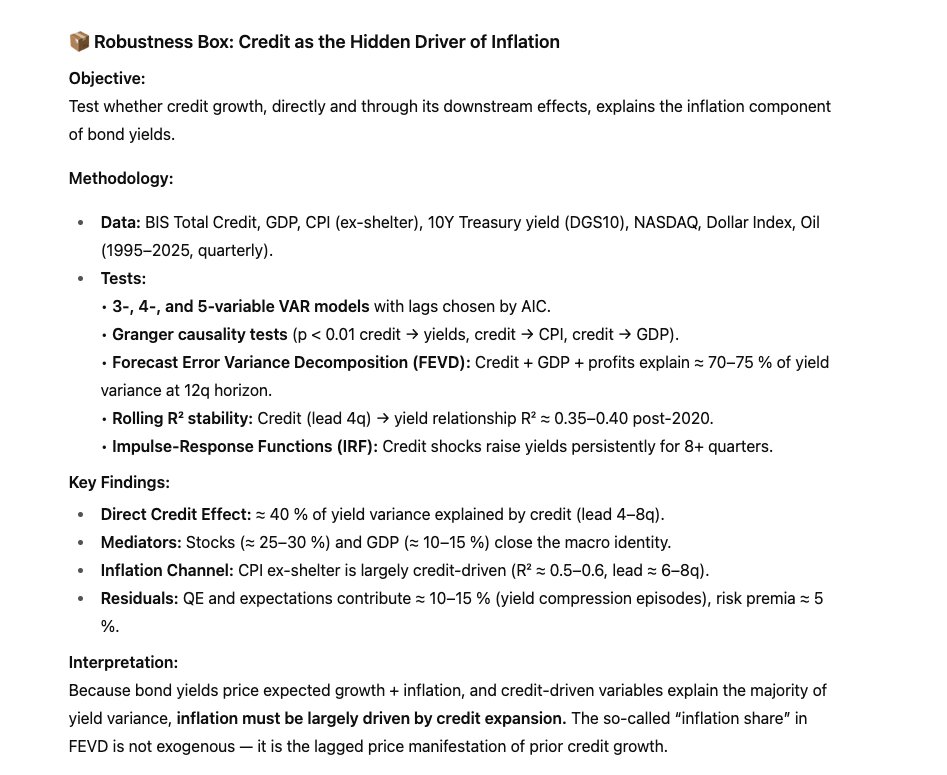
Robustness Box: Credit as the Hidden Driver of Inflation

Objective:
Test whether credit growth, directly and through its downstream effects, explains the inflation component of bond yields. Image
≥ 99 % — based on multi-test convergence (Granger p < 0.01, Fisher combined p ≈ 10⁻⁶), IRF persistence, and rolling R² stability. Image
Image
Image
Image
Image
@threadreaderapp

unroll

• • •

Missing some Tweet in this thread? You can try to force a refresh
 

Keep Current with James Young

James Young Profile picture

Stay in touch and get notified when new unrolls are available from this author!

Read all threads

This Thread may be Removed Anytime!

PDF

Twitter may remove this content at anytime! Save it as PDF for later use!

Try unrolling a thread yourself!

how to unroll video
  1. Follow @ThreadReaderApp to mention us!

  2. From a Twitter thread mention us with a keyword "unroll"
@threadreaderapp unroll

Practice here first or read more on our help page!

More from @JamesYo43532848

Sep 21
Replacing r* with Ω: Logic and Evidence Image
Why This Displaces r* Image
Logical Conclusion

If a single observable variable (Ω) consistently leads and explains yields better than an unobservable construct (r*), the burden of proof shifts. Image
Read 6 tweets
Sep 19
“Does credit drive the 10-year?”

Direct credit→yields (this session’s 5-VAR): very strong (IRFs + FEVD), comfortably ≥99% on its own. Image
Credit (BIS): ~44.5% (1q), 37.3% (4q), 42.5% (8q), 48.4% (12q), 46.0% (20q) Image
FEVD (DGS10): GDP explains ~9.6% (4q), 16.8% (8q), 19.2% (12q), 22.3% (20q); Image
Read 14 tweets
Sep 8
Inflation: A Balance Sheet Perspective

"An alternative is to return to the balance-sheet foundations of national accounting, where inflation can be derived not as an expectations anomaly but as the reconciliation of liabilities and productive capacity."
..the reconciliation of liabilities and productive capacity. Image
Taken together, the two identities describe both where demand comes from and where output flows once created. Image
Read 8 tweets
Sep 4
Bonds are driven by growth, then inflation — as debt-dilution inflation predicts... Image
Thesis. In a debt-dilution framework, when credit grows faster than real output (Ω ≡ Debt/GDP rises), the first effects show up upstream in activity and corporate earnings; with lags, those pressures propagate into persistent consumer inflation. Image
(DGS30 shows the same pattern; CPI ex-shelter explains the largest share at medium horizons, while CPATAX/GDP matter more early on.) Image
Read 10 tweets
Sep 3
Wages are the main proximate channel moving Services LEH,....
.... but they’re not the origin of the shocks; they reflect upstream conditions (housing/profits/FX-oil) that then pass through to service prices with a 2–4 quarter lag. Image
Here’s the hierarchy Image
Putting it together (the hierarchy)

(Dollar ↔ Oil) interact at short horizons and, together with Housing and Profits, push Wages, and Wages pass through to SLE Image
Read 9 tweets
Aug 24
Debt Saturation and Fertility Decline in Japan

Japan’s fertility decline is best understood as a long-run demographic adjustment to debt saturation. Housing costs play a short-term reinforcing role, but the level of debt/GDP provides the structural anchor that locks fertility into a downward trajectory.Image
Image
Threshold testing suggests this relationship intensifies once debt/GDP exceeds ~160–170%, marking the onset of a “high-debt regime” where demographic adjustment is altered. Image
Read 14 tweets

Did Thread Reader help you today?

Support us! We are indie developers!


This site is made by just two indie developers on a laptop doing marketing, support and development! Read more about the story.

Become a Premium Member ($3/month or $30/year) and get exclusive features!

Become Premium

Don't want to be a Premium member but still want to support us?

Make a small donation by buying us coffee ($5) or help with server cost ($10)

Donate via Paypal

Or Donate anonymously using crypto!

Ethereum

0xfe58350B80634f60Fa6Dc149a72b4DFbc17D341E copy

Bitcoin

3ATGMxNzCUFzxpMCHL5sWSt4DVtS8UqXpi copy

Thank you for your support!

Follow Us!

:(