
 @deerpointmacro
 Once capital is non-fungible, such exclusion is no longer valid, and New Keynesian models lose closure without explicit balance-sheet dynamics.
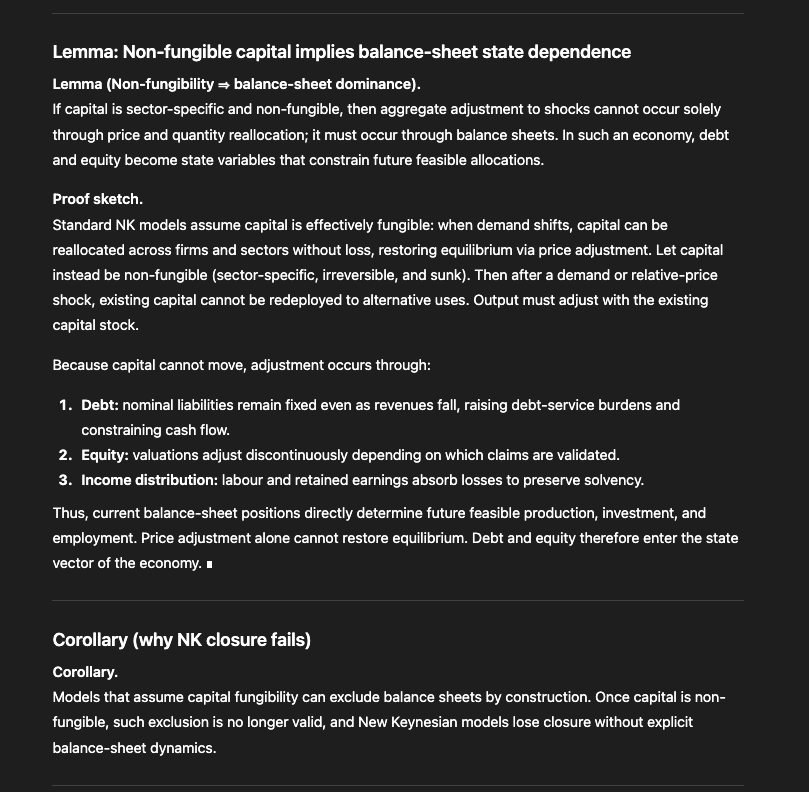


 Appendix B — Methodology Appendix
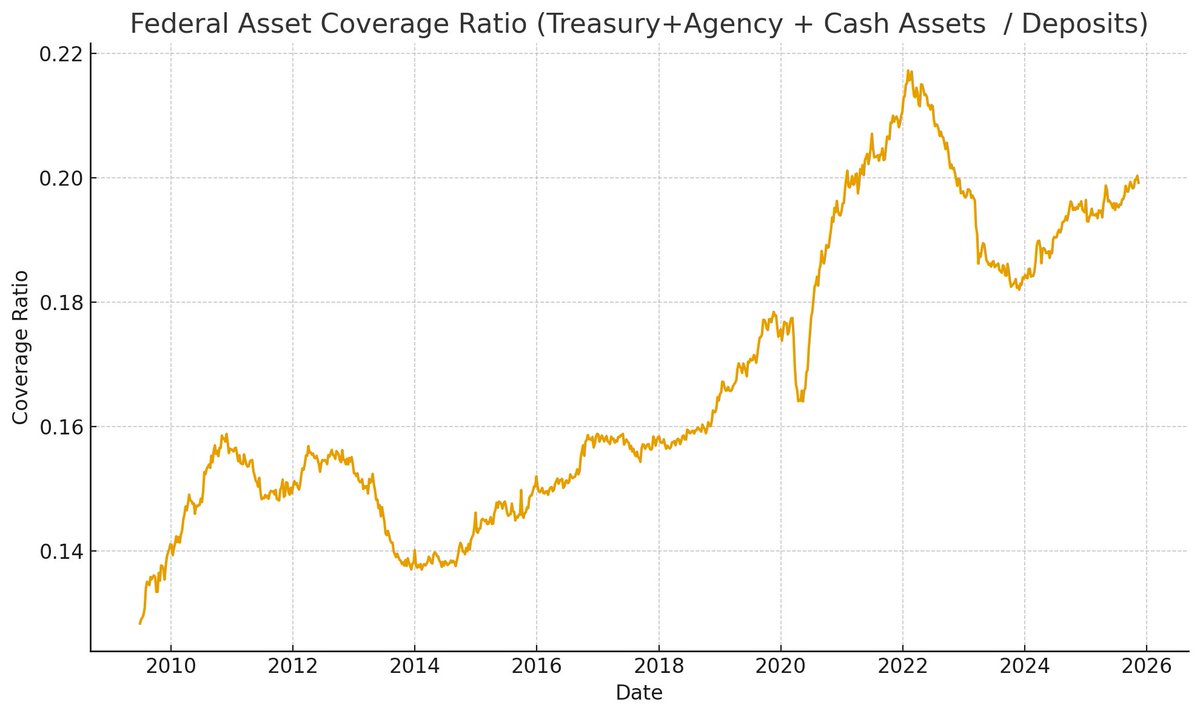
 D.2 Data and Methodology
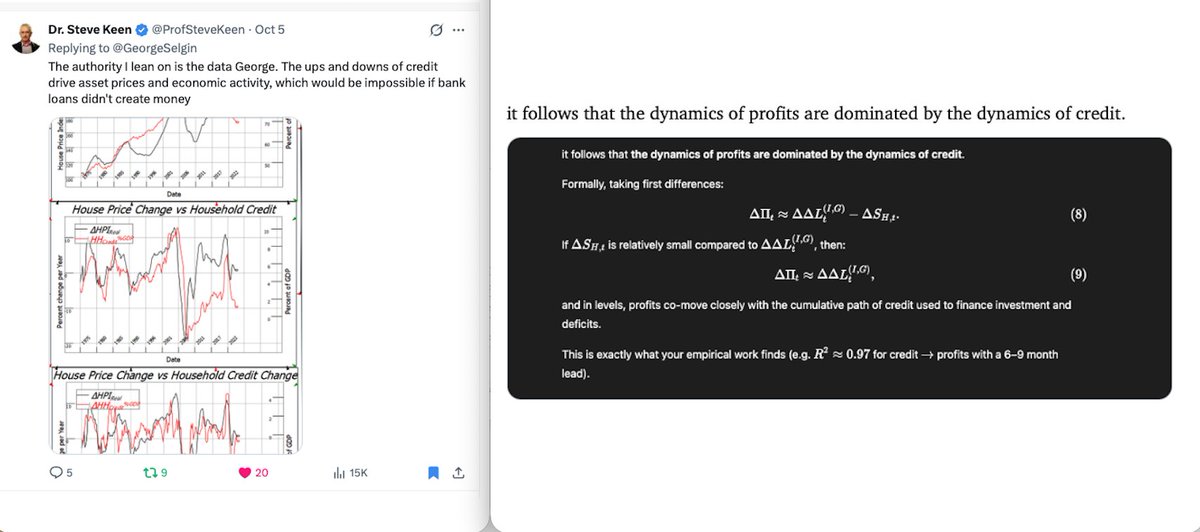 House prices do not just follow the level of debt; they respond to the change in the credit impulse — the acceleration of mortgage credit.
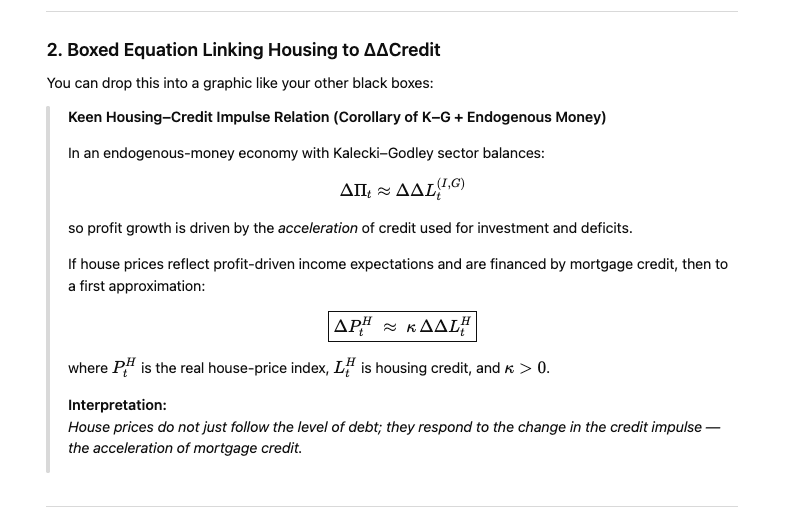
 Sectoral Financial Balances (Godley)
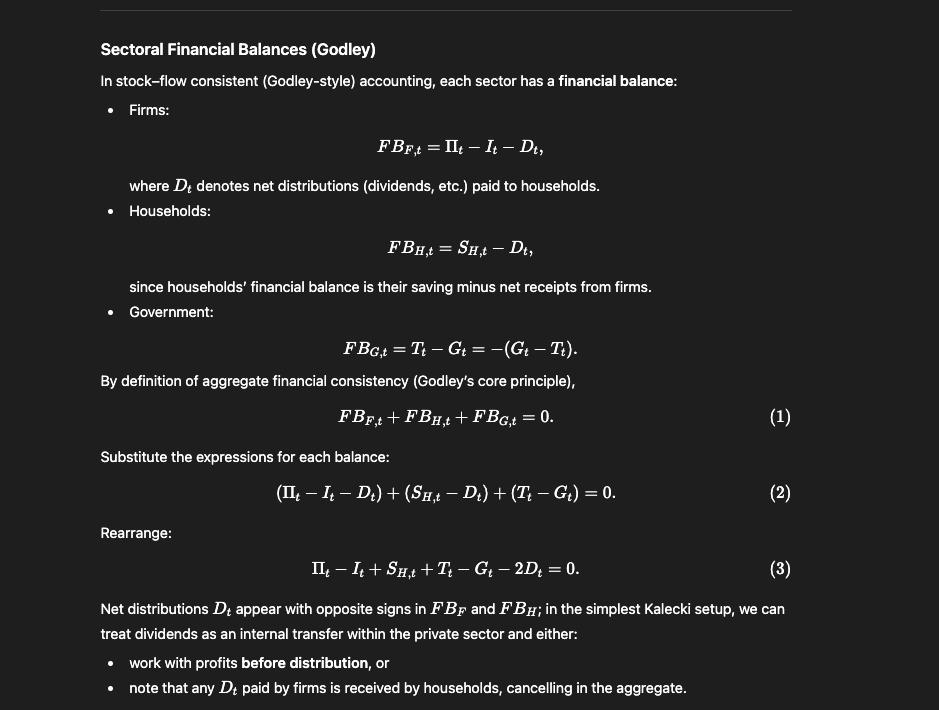
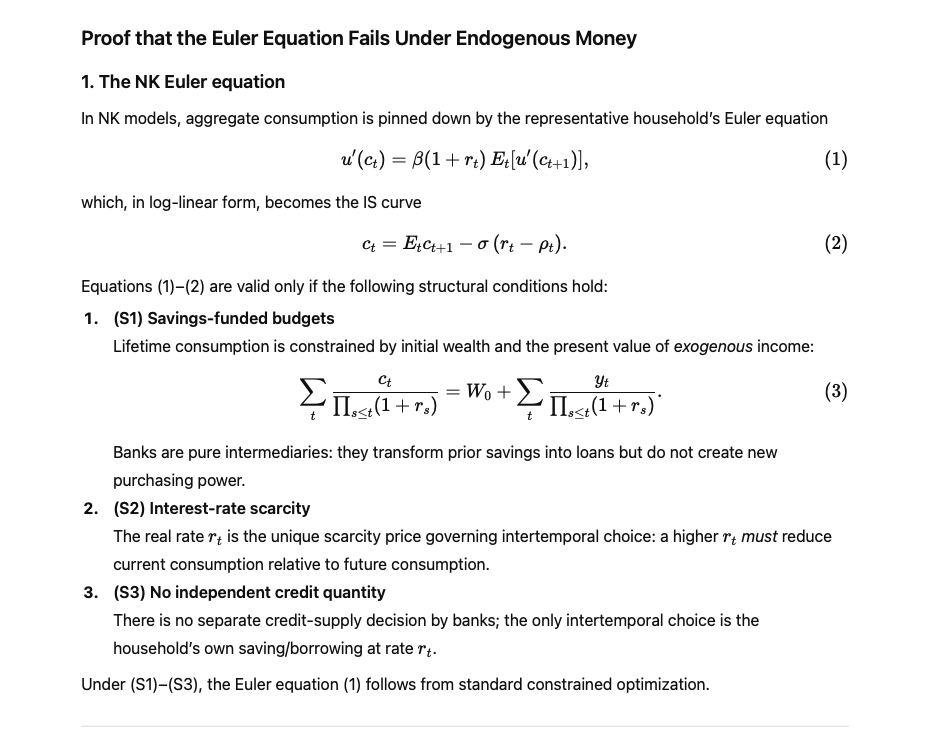 2. Endogenous money
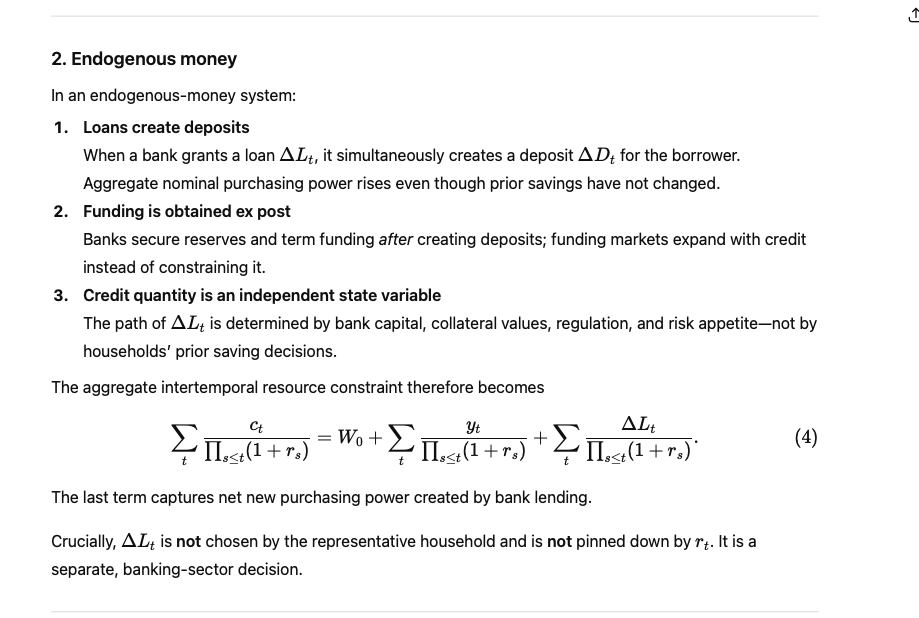
 @FlorinBilbiie The proof proceeds by showing that each of these assumptions is violated in an endogenous-money framework, thereby invalidating the Euler equation at the aggregate level and eliminating the IS curve.

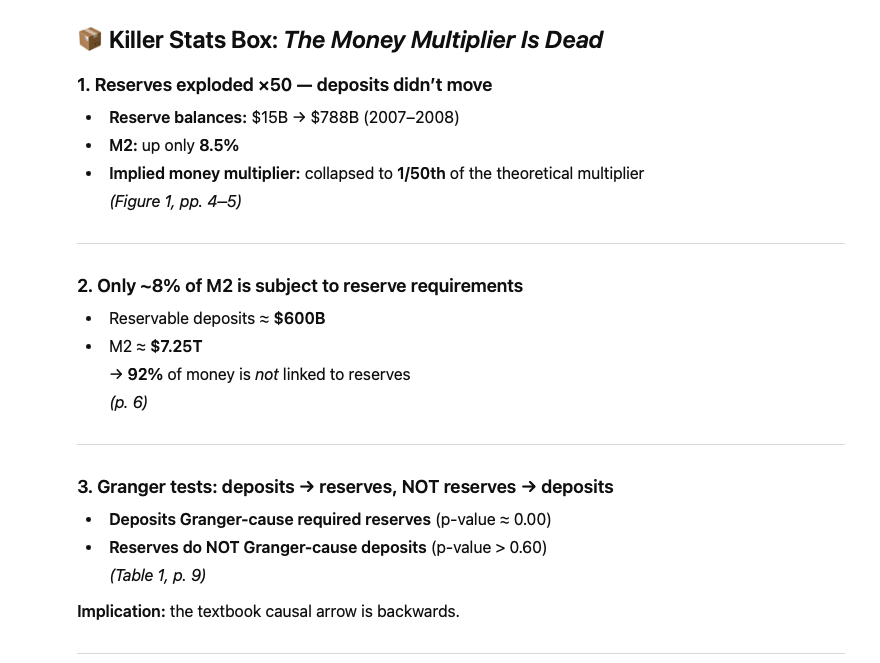 Managed liabilities DO Granger-cause bank loans
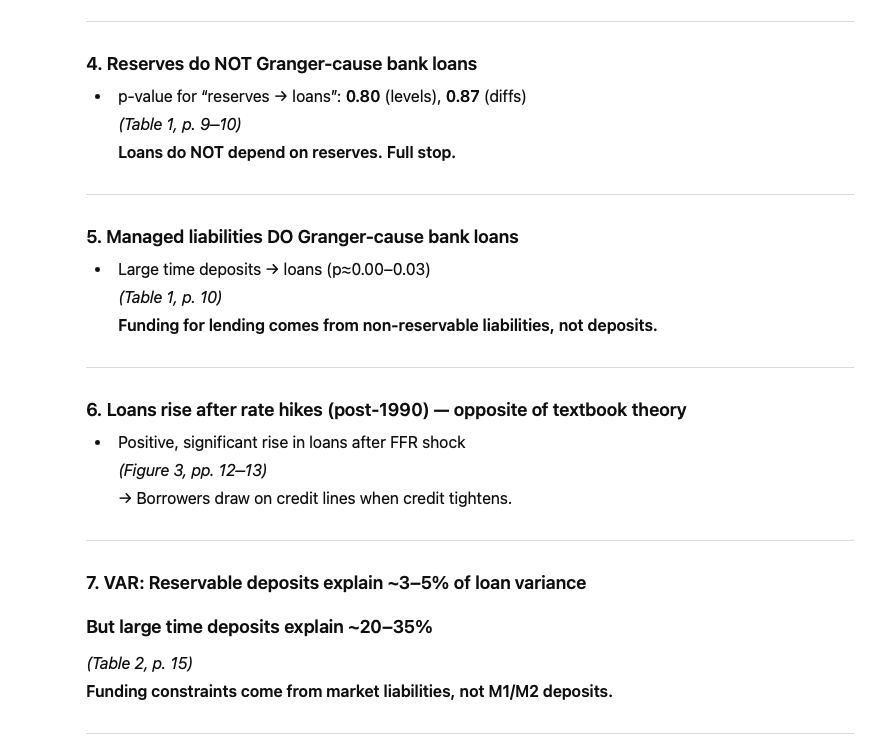
 @GeorgeSelgin @CascadiaEric @robox1234 @edwin_teejay Instead, the sequence runs the other way: bank credit creation expands deposits, and households subsequently hold a portion of those deposits as ‘savings’.
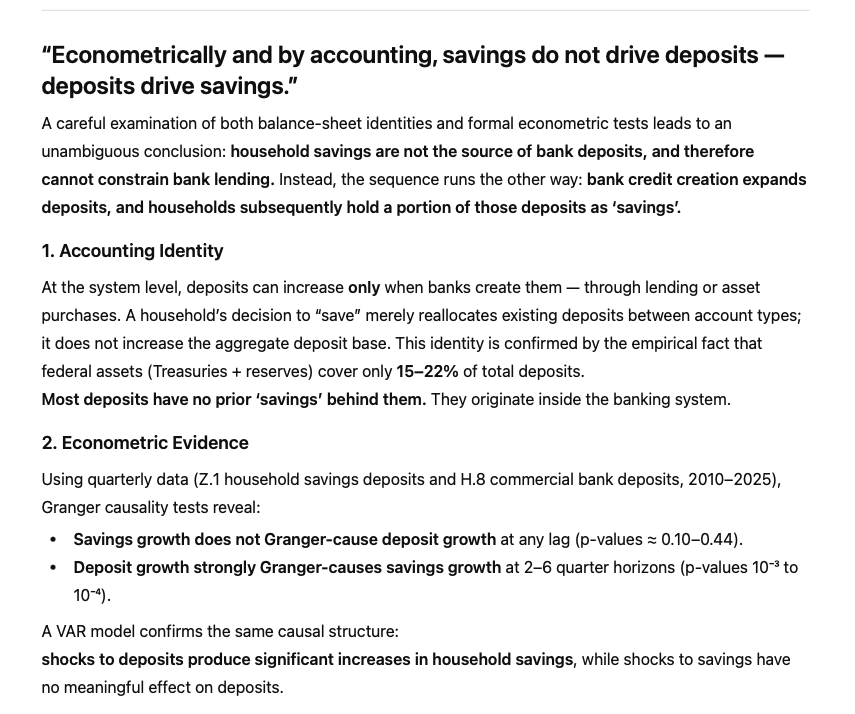
 @RelearningEcon Empirical Consistency Between the Kalecki Profit Identity and Measured Corporate Profits
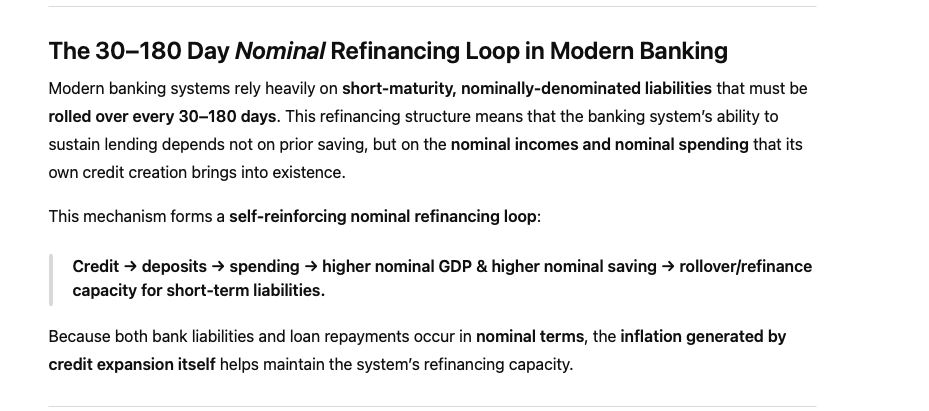 Short-term, nominal funding is the structural reality of banking
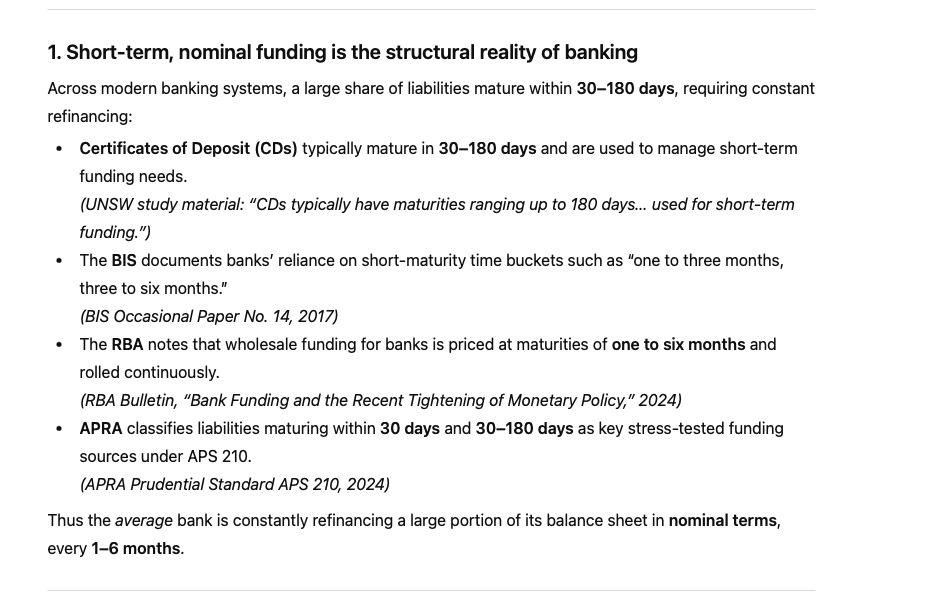
 @GeorgeSelgin To evaluate the core claim of constrained lending or Loanable-Funds Intermediationism—namely, that saving must rise before banks can expand credit—we ran a full set of VAR and Granger-causality tests using U.S. quarterly data.