This is insane:
As the record run in gold accelerates, US gold reserves just exceeded $1 TRILLION for the first time in history.
The US now holds ~2.4 TIMES more gold than Germany, the 2nd-largest holder in the world.
What is gold telling us? Let us explain.
(a thread)
As the record run in gold accelerates, US gold reserves just exceeded $1 TRILLION for the first time in history.
The US now holds ~2.4 TIMES more gold than Germany, the 2nd-largest holder in the world.
What is gold telling us? Let us explain.
(a thread)

Today's move puts gold up +44% year-to-date.
This means gold is now up 3.5 TIMES more than the S&P 500 during one of its strongest bull runs ever.
Historically, gold falls when stocks rise as it's a "safe haven" asset.
However, the EXACT opposite situation is happening now.
This means gold is now up 3.5 TIMES more than the S&P 500 during one of its strongest bull runs ever.
Historically, gold falls when stocks rise as it's a "safe haven" asset.
However, the EXACT opposite situation is happening now.

In fact, gold is now on track to post its best year since 1979, when inflation in the US was above 11%.
Not even the 2020 Pandemic, 2008 Financial Crisis, or 2000 Dot-Com bubble saw gold post a 40%+ annual gain.
The move puts US gold holdings at ~$1.1 TRILLION.
Not even the 2020 Pandemic, 2008 Financial Crisis, or 2000 Dot-Com bubble saw gold post a 40%+ annual gain.
The move puts US gold holdings at ~$1.1 TRILLION.

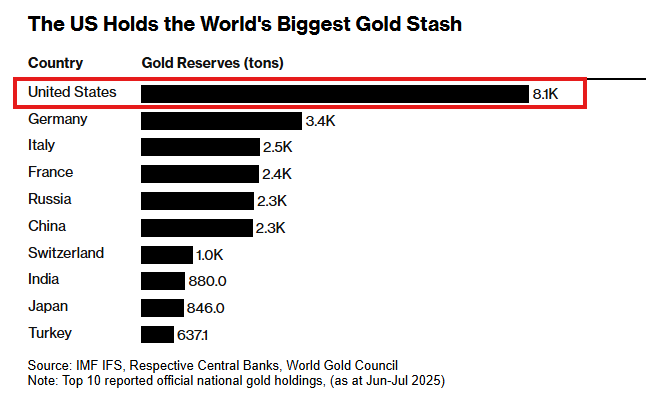
Here is a list of the world's largest gold holders.
The US currently owns 8,100 TONS of gold, more than 2 times what Germany holds, the second largest holder.
In fact, the US now holds more gold than China, France, and Russia combined.
ALL central banks have been buying gold.
The US currently owns 8,100 TONS of gold, more than 2 times what Germany holds, the second largest holder.
In fact, the US now holds more gold than China, France, and Russia combined.
ALL central banks have been buying gold.
World central banks bought another 166.5 tonnes of gold in Q2 2025.
This is ~41% above the average quarterly purchase between 2010 and 2021.
This also brought total purchases in the first half of 2025 to 415 tonnes, the third-largest H1 on record.
So, why is this happening?
This is ~41% above the average quarterly purchase between 2010 and 2021.
This also brought total purchases in the first half of 2025 to 415 tonnes, the third-largest H1 on record.
So, why is this happening?

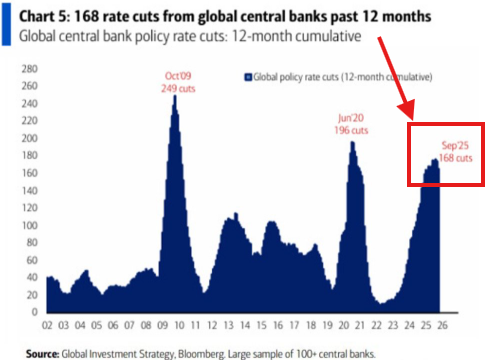
The reality is that global monetary policy has pivoted.
World central banks have cut rates 168 times over the last 12 months, the 3rd highest reading this century.
The previous cycle peak was 196 cumulative 12-month cuts in June 2020.
But, it's not because inflation is down.
World central banks have cut rates 168 times over the last 12 months, the 3rd highest reading this century.
The previous cycle peak was 196 cumulative 12-month cuts in June 2020.
But, it's not because inflation is down.
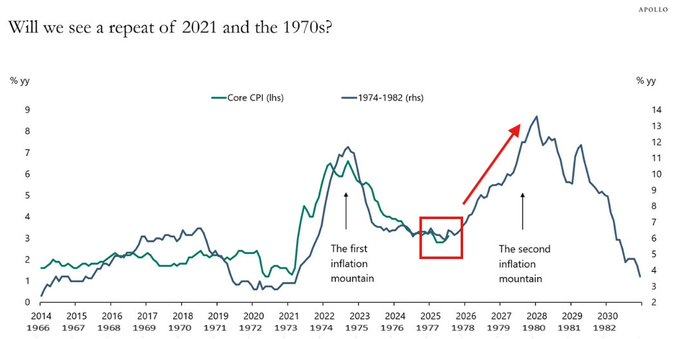
In the US, the Fed has explicitly stated that rate cuts have ONLY resumed due to a weakening labor market.
In fact, the Fed is now cutting rates into 2.9%+ Core PCE inflation for the first time in 30+ years.
Apollo has warned of a potential 1970s-style resurgence of inflation.
In fact, the Fed is now cutting rates into 2.9%+ Core PCE inflation for the first time in 30+ years.
Apollo has warned of a potential 1970s-style resurgence of inflation.
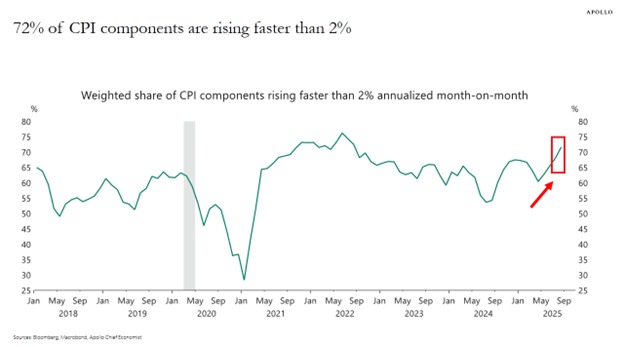
And, CPI inflation is heating up.
72% of CPI components are now surging faster than the Fed’s 2% target, the highest share in 3 years.
By comparison, the average was ~57% during the 2018-2019 period.
Apollo also claims that goods inflation is climbing again due to tariffs.
72% of CPI components are now surging faster than the Fed’s 2% target, the highest share in 3 years.
By comparison, the average was ~57% during the 2018-2019 period.
Apollo also claims that goods inflation is climbing again due to tariffs.
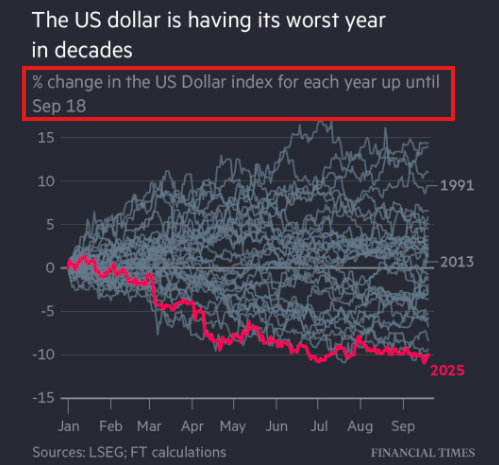
As a result, the US Dollar's purchasing power is collapsing.
The US Dollar is now on track to post its worst year since 1973.
The US Dollar Index fell -10.8% in the first half of 2025, its worst first-half performance since the end of the gold-backed Bretton Woods System.
The US Dollar is now on track to post its worst year since 1973.
The US Dollar Index fell -10.8% in the first half of 2025, its worst first-half performance since the end of the gold-backed Bretton Woods System.
Sum it all up and you have a weaker US Dollar, more uncertainty, rising inflation, and rate cuts.
This is a dream scenario for both gold and Bitcoin which have seen historic gains as a result.
Since January 2023, Gold is up +110% and Bitcoin is up +568%.
We remain bullish.
This is a dream scenario for both gold and Bitcoin which have seen historic gains as a result.
Since January 2023, Gold is up +110% and Bitcoin is up +568%.
We remain bullish.

As we look ahead, we believe the themes driving gold prices will result in major macroeconomic shifts.
This is redefining the way markets are moving.
Want to see how we are capitalizing on it?
Subscribe to access our premium analysis below:
thekobeissiletter.com/subscribe
This is redefining the way markets are moving.
Want to see how we are capitalizing on it?
Subscribe to access our premium analysis below:
thekobeissiletter.com/subscribe
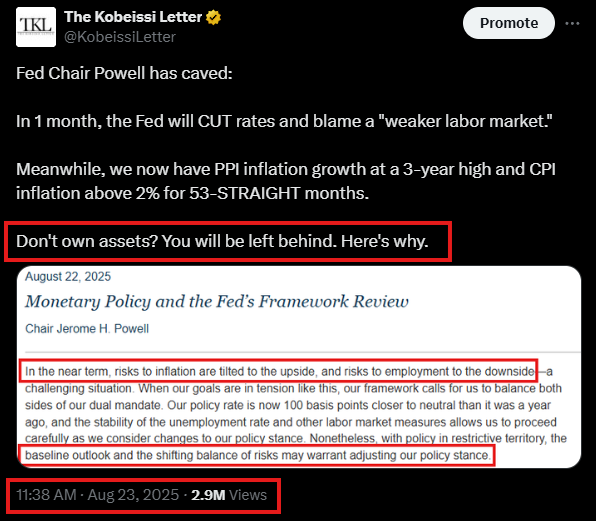
As we began posting in August, a new era of monetary policy has begun.
The Fed is effectively cutting rates into stagflation.
As we said on August 23rd, those who don't own assets will be left behind.
Follow us @KobeissiLetter for real time analysis as this develops.
The Fed is effectively cutting rates into stagflation.
As we said on August 23rd, those who don't own assets will be left behind.
Follow us @KobeissiLetter for real time analysis as this develops.
• • •
Missing some Tweet in this thread? You can try to
force a refresh