
PMC COVlD Update, Sep 29, 2025 (U.S.)
Summary: COVlD is everywhere.
On the back end of this unprecedented 11th wave, "times they are a-changin." In particular, COVlD levels are shifting north and east.
Notice that few states are in the highest and lowest categories. Much of the south and west have considerable transmission post-peak. Many places in the north and east are seeing steady or increasing transmission after relatively lower levels.
Overall, levels are lower than the past few weeks, but transmission remains considerable. Those relying on anecdata (friends, coworkers, and family infected) may increasingly realize we are in a wave.
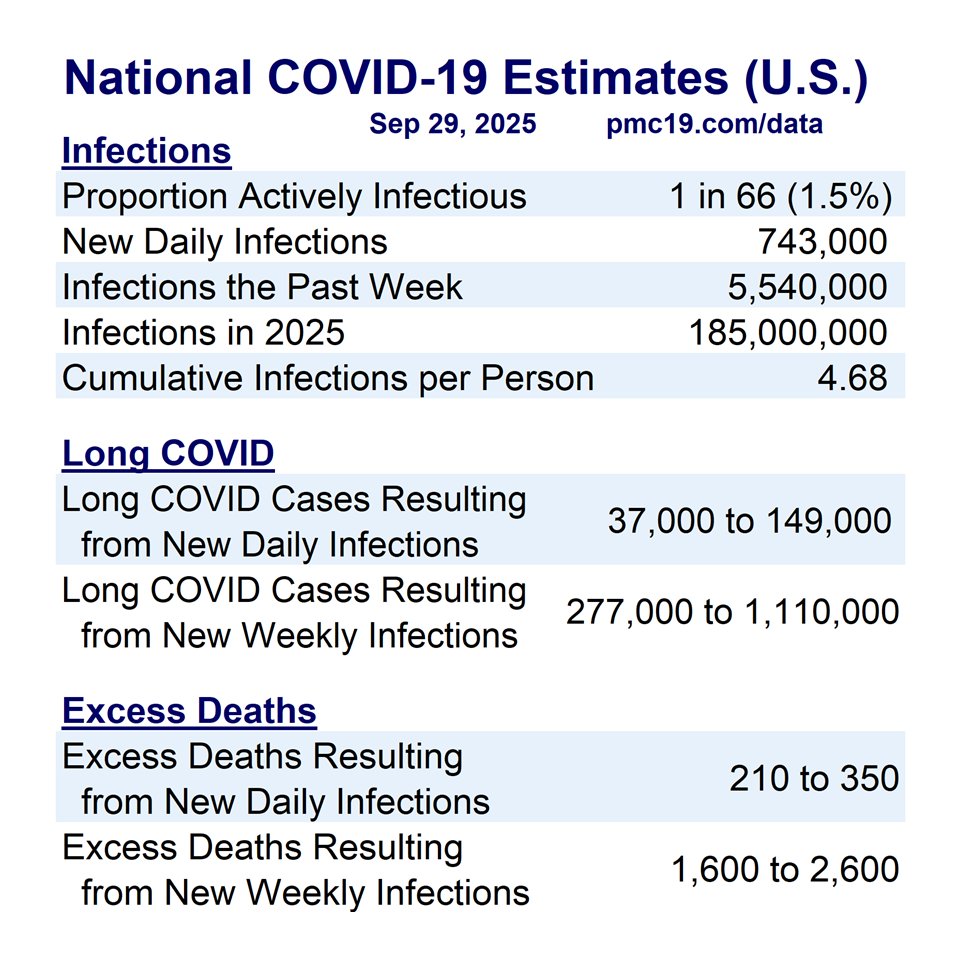
We estimate nearly 750,000 new daily infections nationwide, meaning approximately 1 in 66 people or 1.5% are actively infectious.
These estimates are derived by linking wastewater levels to IHME true case estimates using methodology commonly employed worldwide, detailed on the website, noted in a pre-print. Many publications in leading medical journals link wastewater data to key metrics that matter, noted in the online technical appendix.
In this week's report, we note adding North Dakota and Puerto Rico to the heat map in support of health equity. We have been imputing ND levels since the launch of PMC 3.0 using data from neighboring states. PR continues to report qualitative levels using the CDC format but is not longer included on the CDC website.
1/8 🧵
Summary: COVlD is everywhere.
On the back end of this unprecedented 11th wave, "times they are a-changin." In particular, COVlD levels are shifting north and east.
Notice that few states are in the highest and lowest categories. Much of the south and west have considerable transmission post-peak. Many places in the north and east are seeing steady or increasing transmission after relatively lower levels.
Overall, levels are lower than the past few weeks, but transmission remains considerable. Those relying on anecdata (friends, coworkers, and family infected) may increasingly realize we are in a wave.
We estimate nearly 750,000 new daily infections nationwide, meaning approximately 1 in 66 people or 1.5% are actively infectious.
These estimates are derived by linking wastewater levels to IHME true case estimates using methodology commonly employed worldwide, detailed on the website, noted in a pre-print. Many publications in leading medical journals link wastewater data to key metrics that matter, noted in the online technical appendix.
In this week's report, we note adding North Dakota and Puerto Rico to the heat map in support of health equity. We have been imputing ND levels since the launch of PMC 3.0 using data from neighboring states. PR continues to report qualitative levels using the CDC format but is not longer included on the CDC website.
1/8 🧵

PMC COVlD Update, Sep 29, 2025 (U.S.)
State-level prevalence estimates, AL to MS. The levels use CDC labels, which tend to have an optimistic portrayal of risk. For example, CO is listed at "low" (by our estimate 1.5% infectious).
#MaskUp at 1.5% if having lapsed.
2/8 🧵
State-level prevalence estimates, AL to MS. The levels use CDC labels, which tend to have an optimistic portrayal of risk. For example, CO is listed at "low" (by our estimate 1.5% infectious).
#MaskUp at 1.5% if having lapsed.
2/8 🧵

PMC COVlD Update, Sep 29, 2025 (U.S.)
State-level prevalence estimates, Missouri to Wyoming.
New York had *huge* retroactive upward corrections, and is now "High," as many residents hypothesized.
Note, Puerto Rico only provides CDC qualitative levels, so no data.
3/8 🧵
State-level prevalence estimates, Missouri to Wyoming.
New York had *huge* retroactive upward corrections, and is now "High," as many residents hypothesized.
Note, Puerto Rico only provides CDC qualitative levels, so no data.
3/8 🧵

PMC COVlD Update, Sep 29, 2025 (U.S.)
We made this infographic to show that COVlD levels are considerable across key Northeastern states.
The huge retroactive upward correction to NYS was so alarming, we released it prior to our full report.
4/8 🧵
We made this infographic to show that COVlD levels are considerable across key Northeastern states.
The huge retroactive upward correction to NYS was so alarming, we released it prior to our full report.
4/8 🧵
https://x.com/michael_hoerger/status/1971820189252759853
PMC COVlD Update, Sep 29, 2025 (U.S.)
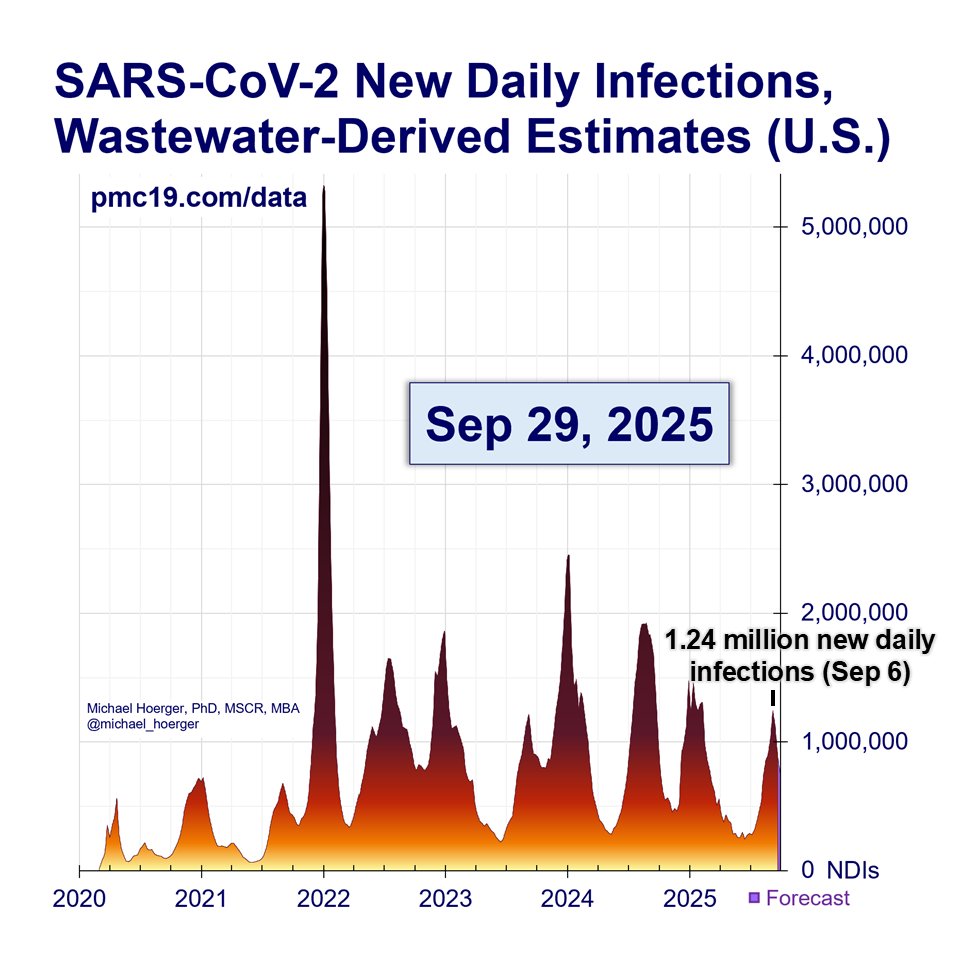
We are in a serious 11th COVlD wave. Share this figure with others.
We peaked nationally around Sep 6 at 1.24 million estimated new daily infections. The forecast was spot on, with close estimates of timing & level amid noisy data.
5/8 🧵
We are in a serious 11th COVlD wave. Share this figure with others.
We peaked nationally around Sep 6 at 1.24 million estimated new daily infections. The forecast was spot on, with close estimates of timing & level amid noisy data.
5/8 🧵
PMC COVlD Update, Sep 29, 2025 (U.S.)
Our model estimates 5.5 million new weekly infections, expected to result in >200,000 individuals with long-term health sequelae and 1,600-2,600 excess deaths.
Check your blood pressure. Avoid a silent post-infection heart attack.
6/8 🧵
Our model estimates 5.5 million new weekly infections, expected to result in >200,000 individuals with long-term health sequelae and 1,600-2,600 excess deaths.
Check your blood pressure. Avoid a silent post-infection heart attack.
6/8 🧵
PMC COVlD Update, Sep 29, 2025 (U.S.)
Notice that current transmission (red) is so closely tracking 2 years ago, it's challenging to see the yellow line.
Look ahead for a simple "forecast." Simple is good. Share with others who do not track COVlD data.
7/8 🧵
Notice that current transmission (red) is so closely tracking 2 years ago, it's challenging to see the yellow line.
Look ahead for a simple "forecast." Simple is good. Share with others who do not track COVlD data.
7/8 🧵

PMC COVlD Update, Sep 29, 2025 (U.S.)
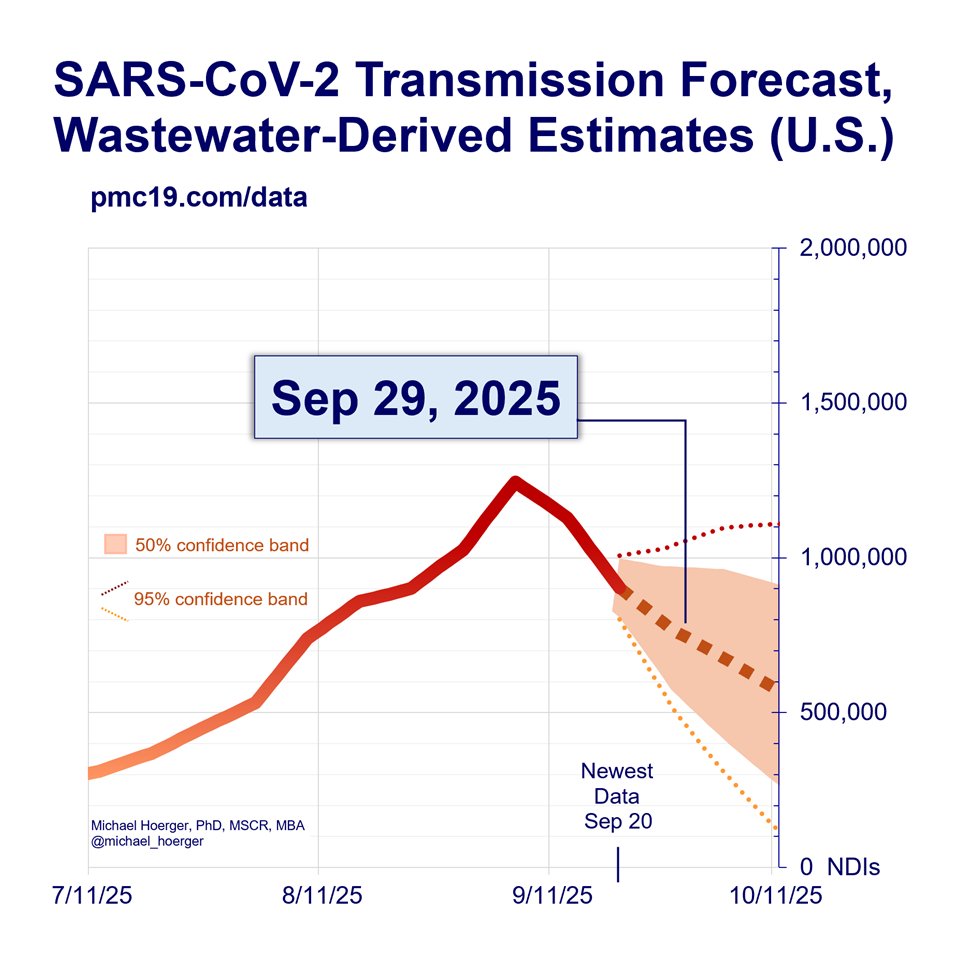
Our forecast has us dipping a bit lower than the relative "lull" 2 years ago, but these are noisy data.
Also, real and perceived barriers to boosters create uncertainty. #MaskUp, get boosted, and check your BP while there. ❤️🩹😷💉
8/8 🧵
Our forecast has us dipping a bit lower than the relative "lull" 2 years ago, but these are noisy data.
Also, real and perceived barriers to boosters create uncertainty. #MaskUp, get boosted, and check your BP while there. ❤️🩹😷💉
8/8 🧵
• • •
Missing some Tweet in this thread? You can try to
force a refresh


