The US government shutdown:
For the first time since 2018, the US is about to enter a government shutdown and investors are bracing for it.
This would furlough 750,000 workers PER DAY, costing ~$400M in daily compensation.
What does it all mean? Let us explain.
(a thread)
For the first time since 2018, the US is about to enter a government shutdown and investors are bracing for it.
This would furlough 750,000 workers PER DAY, costing ~$400M in daily compensation.
What does it all mean? Let us explain.
(a thread)

The last time we entered a government shutdown was in December 2018, in Trump's 1st term.
The shutdown lasted 35 days, making it the longest government shutdown in US history.
The average length of a shutdown is 8 days and its implications spread further when it lasts longer.
The shutdown lasted 35 days, making it the longest government shutdown in US history.
The average length of a shutdown is 8 days and its implications spread further when it lasts longer.

During a shutdown, many Federal functions are suspended.
Services that the government deems “essential,” such as those related to law enforcement, continue.
If an agreement is not reached by 12:01 AM ET on October 1st, the US government will officially enter a shutdown.
Services that the government deems “essential,” such as those related to law enforcement, continue.
If an agreement is not reached by 12:01 AM ET on October 1st, the US government will officially enter a shutdown.

The million dollar question: What does it mean for the market?
Surprisingly, it rarely derails the market over the long-run.
In fact, 86% of shutdowns saw the S&P 500 end higher 12 months later with an average gain of +12.7%.
Results are consistent regardless of president.
Surprisingly, it rarely derails the market over the long-run.
In fact, 86% of shutdowns saw the S&P 500 end higher 12 months later with an average gain of +12.7%.
Results are consistent regardless of president.
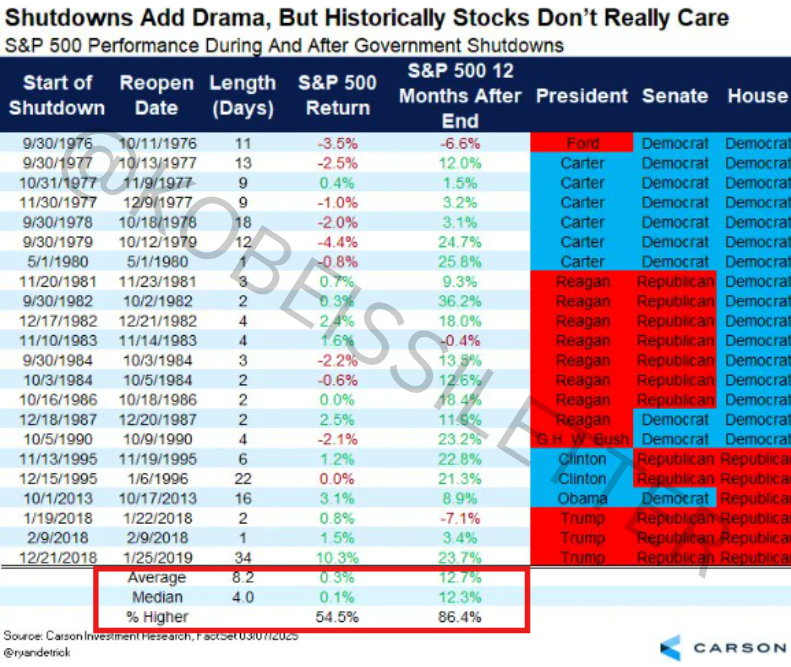
The near-term effects bring more volatility.
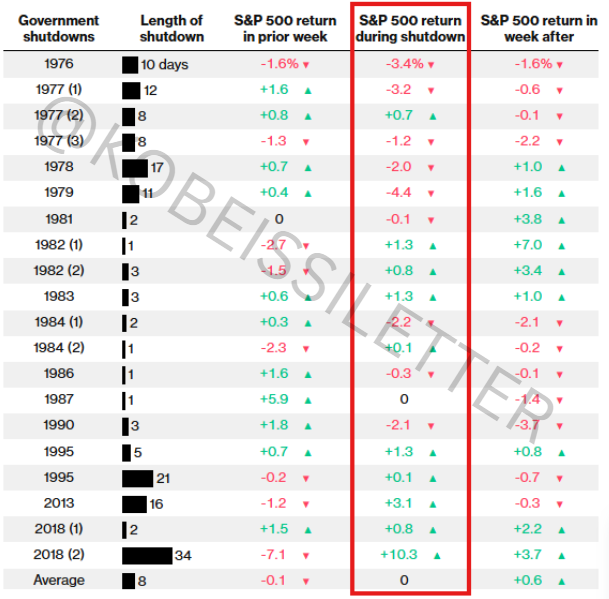
The S&P 500 tends to finish higher in just ~55% of cases at the end of the shutdown.
In the 1970s and 1980s, this typically came with a sharp downturn.
However, the S&P 500 has finished higher during every shutdown since 1995.
The S&P 500 tends to finish higher in just ~55% of cases at the end of the shutdown.
In the 1970s and 1980s, this typically came with a sharp downturn.
However, the S&P 500 has finished higher during every shutdown since 1995.
Today, Trump said the US will "probably" have a government shutdown.
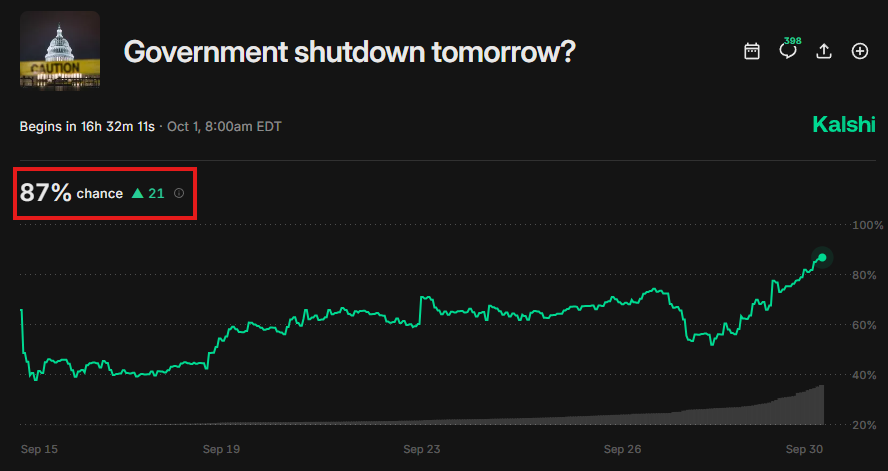
Prediction markets show there is currently an 87% chance of a shutdown in 9 hours from now, per Kalshi.
The odds of a shutdown by the end of 2025 are near a record 90% chance.
Markets are crystal clear.
Prediction markets show there is currently an 87% chance of a shutdown in 9 hours from now, per Kalshi.
The odds of a shutdown by the end of 2025 are near a record 90% chance.
Markets are crystal clear.
In fact, data this morning shows that government staffers are already preparing for the shutdown.
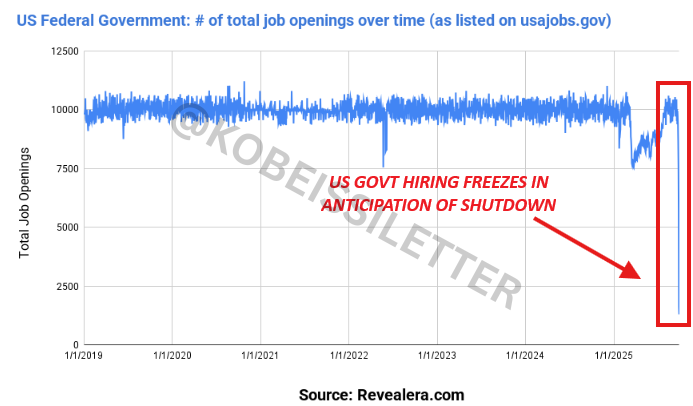
The total number of job openings on the US govt website plummeted 87% over the past week.
Openings fell from ~10,000 to just ~1,300 in a matter of days as shutdown odds surged.
The total number of job openings on the US govt website plummeted 87% over the past week.
Openings fell from ~10,000 to just ~1,300 in a matter of days as shutdown odds surged.
Meanwhile, gold is set to post a +10% monthly gain and is now up +45% YTD.
Gold has been pricing this in for the last few weeks.
Couple this with rate cuts into rising inflation and gold is on track for its best year since 1979.
Gold just hit its 39th all time high of 2025.
Gold has been pricing this in for the last few weeks.
Couple this with rate cuts into rising inflation and gold is on track for its best year since 1979.
Gold just hit its 39th all time high of 2025.

Positioning heading into this shutdown is polarized.
As the S&P 500 posts one of its best 6-month runs in history, short positioning in volatility is high.
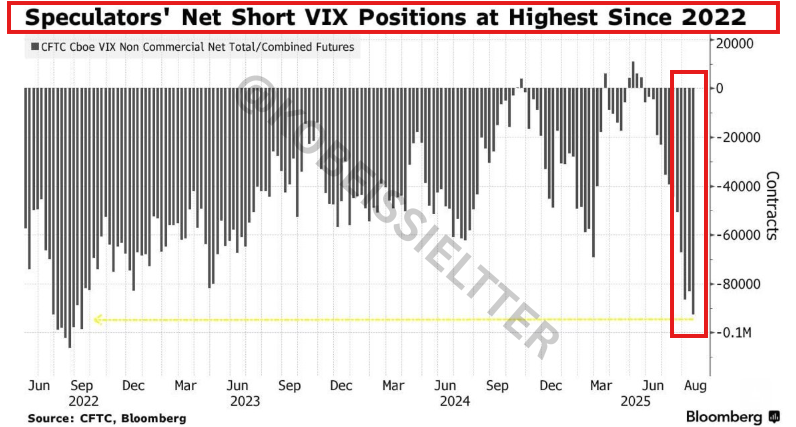
Net short $VIX positions are at their highest levels since 2022.
A $VIX spike would result in widespread short covering.
As the S&P 500 posts one of its best 6-month runs in history, short positioning in volatility is high.
Net short $VIX positions are at their highest levels since 2022.
A $VIX spike would result in widespread short covering.
Simultaneously, the US Dollar is on track for its worst year since 1973.
In fact, the US Dollar is depreciating so quickly that Apollo says it will spark more inflation.
The -10% drop would coincide with a 30 bps jump in inflation per Fed models.
The shutdown won't help.
In fact, the US Dollar is depreciating so quickly that Apollo says it will spark more inflation.
The -10% drop would coincide with a 30 bps jump in inflation per Fed models.
The shutdown won't help.

Major macroeconomic shifts have become a common occurrence in today's markets.
This is redefining the way markets are moving and we are breaking it all down.
Want to see how we are capitalizing on it?
Subscribe to access our premium analysis below:
thekobeissiletter.com/subscribe
This is redefining the way markets are moving and we are breaking it all down.
Want to see how we are capitalizing on it?
Subscribe to access our premium analysis below:
thekobeissiletter.com/subscribe
Ultimately, the shutdown will end with a budget bill and more deficit spending.
All as the Fed cuts rates into stagflation, prompting a rush into assets and a search for yield.
Position yourself accordingly.
Follow us @KobeissiLetter for real time analysis as this develops.
All as the Fed cuts rates into stagflation, prompting a rush into assets and a search for yield.
Position yourself accordingly.
Follow us @KobeissiLetter for real time analysis as this develops.

• • •
Missing some Tweet in this thread? You can try to
force a refresh