What is happening?
The S&P 500 is up +40% in 6 months, Gold is nearing $4,000/oz, and Bitcoin hit a record $2.5 TRILLION market cap.
Meanwhile, the US Dollar is set for its WORST year since 1973.
Are markets THAT strong or is the US Dollar just crashing?
(a thread)
The S&P 500 is up +40% in 6 months, Gold is nearing $4,000/oz, and Bitcoin hit a record $2.5 TRILLION market cap.
Meanwhile, the US Dollar is set for its WORST year since 1973.
Are markets THAT strong or is the US Dollar just crashing?
(a thread)

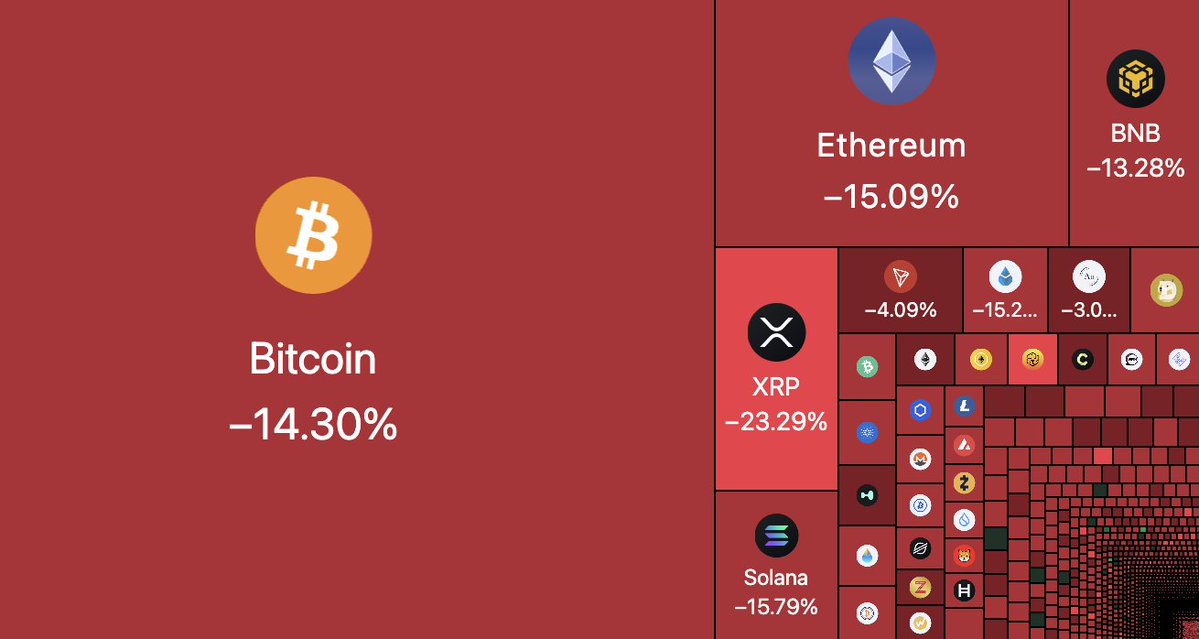
Yesterday, on a casual Saturday night, Bitcoin surged to $125,000, a new all time high.
This makes Bitcoin worth a record $2.5 trillion.
Meanwhile, gold has hit 40 record highs in 2025 and is now worth a whopping $26.3 TRILLION.
That's more than 10 TIMES the value of Bitcoin.
This makes Bitcoin worth a record $2.5 trillion.
Meanwhile, gold has hit 40 record highs in 2025 and is now worth a whopping $26.3 TRILLION.
That's more than 10 TIMES the value of Bitcoin.

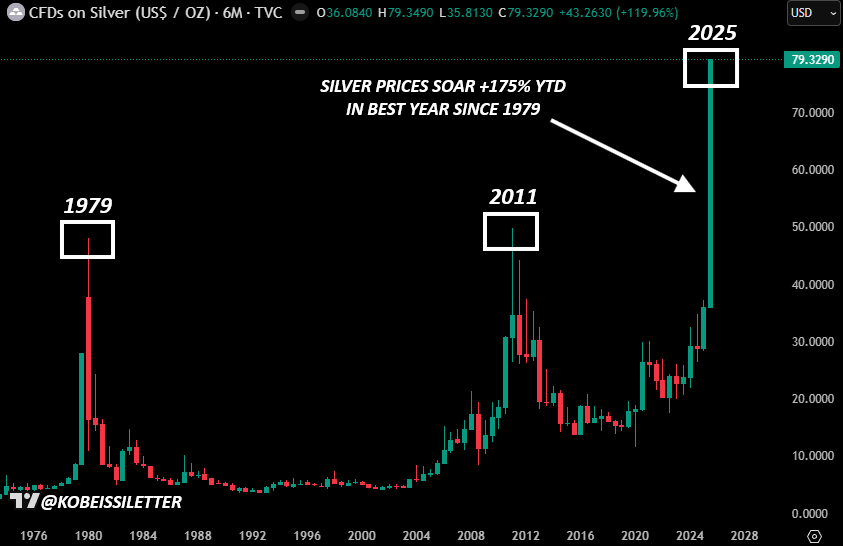
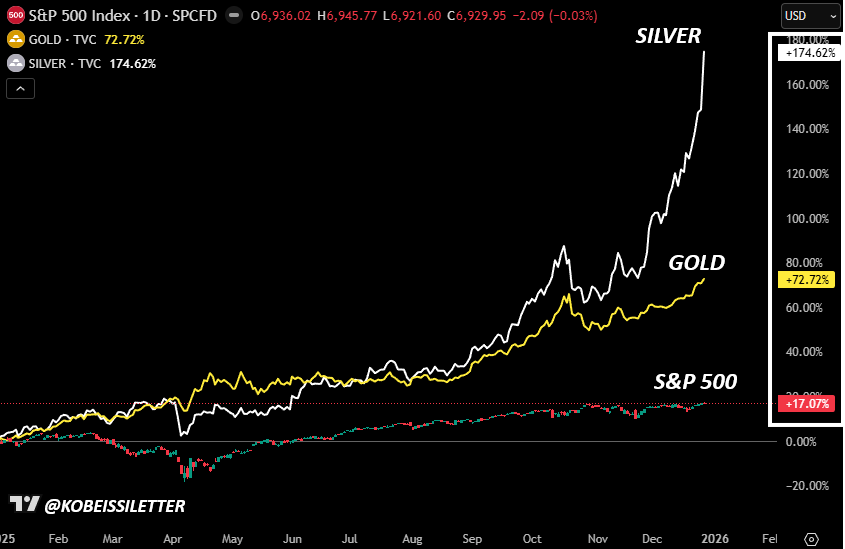
Meanwhile, take a look at Silver, worth $2.7 TRILLION and up over +60% YTD.
Gold, Silver, and Bitcoin are now all in the top 10 largest assets in the world.
These are all typically viewed as safe haven assets which rise when stocks fall.
But, take a look at equity markets.
Gold, Silver, and Bitcoin are now all in the top 10 largest assets in the world.
These are all typically viewed as safe haven assets which rise when stocks fall.
But, take a look at equity markets.

The S&P 500 is up +39% in 6 months, adding $16 TRILLION of market cap.
The Nasdaq 100 is up for 6 STRAIGHT months which has only happened 6 times since 1986.
And, the Magnificent 7 companies are investing a record $100B+ per quarter in CapEx to fuel the AI Revolution.
The Nasdaq 100 is up for 6 STRAIGHT months which has only happened 6 times since 1986.
And, the Magnificent 7 companies are investing a record $100B+ per quarter in CapEx to fuel the AI Revolution.

In fact, SAFE HAVEN assets are now trading with record high correlation to stocks.
The correlation coefficient between Gold and the S&P 500 reached a record 0.91 in 2024.
This means that Gold and the S&P 500 were moving in TANDEM 91% of the time.
So, what is happening?
The correlation coefficient between Gold and the S&P 500 reached a record 0.91 in 2024.
This means that Gold and the S&P 500 were moving in TANDEM 91% of the time.
So, what is happening?

There is a widespread rush into assets happening right now.
As inflation rebounds and the labor market weakens, the Fed is CUTTING rates.
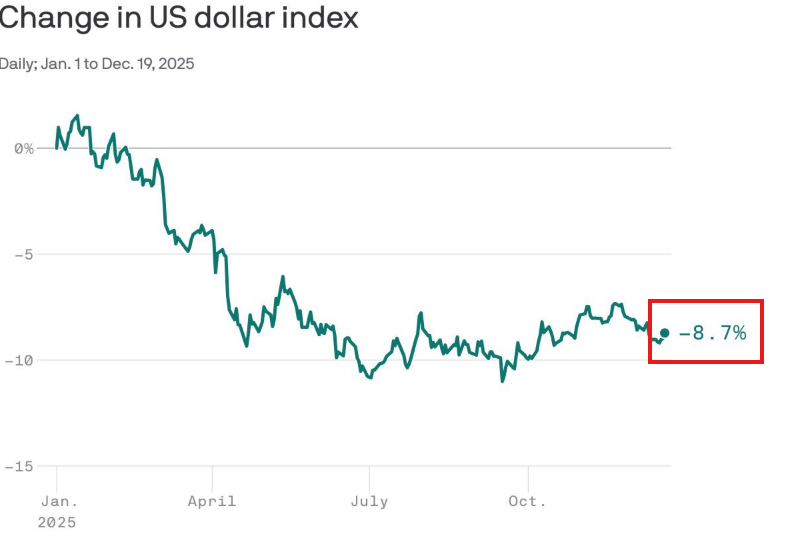
The USD is now on track for its worst year since 1973, down over -10% YTD.
The USD has lost -40% of its purchasing power since 2000.
As inflation rebounds and the labor market weakens, the Fed is CUTTING rates.
The USD is now on track for its worst year since 1973, down over -10% YTD.
The USD has lost -40% of its purchasing power since 2000.

Take a look at this:
The Fed is cutting rates into 4.0% annualized inflation since 2020.
And, the Fed is cutting rates into 2.9%+ Core PCE inflation for the first time since the 1990s.
What's really happening here is assets are pricing in a NEW era of monetary policy.
The Fed is cutting rates into 4.0% annualized inflation since 2020.
And, the Fed is cutting rates into 2.9%+ Core PCE inflation for the first time since the 1990s.
What's really happening here is assets are pricing in a NEW era of monetary policy.

That's the only case that makes sense.
When safe haven assets, risky assets, real estate, and inflation are all rising together, its a macro-based shift.
Here are MARKET-BASED inflation expectations over the next 5-10 years.
The Fed has ZERO control of long-term yields.
When safe haven assets, risky assets, real estate, and inflation are all rising together, its a macro-based shift.
Here are MARKET-BASED inflation expectations over the next 5-10 years.
The Fed has ZERO control of long-term yields.

Simultaneously, we are in the biggest technological revolution since the internet.
So, you have investors looking to defend against a Fed pivot into inflation all as the AI Revolution heats up.
Asset owners are winning.
The widespread rush into ALL assets is accelerating.
So, you have investors looking to defend against a Fed pivot into inflation all as the AI Revolution heats up.
Asset owners are winning.
The widespread rush into ALL assets is accelerating.

As we have been warning, this will only result in a widening of the historic US wealth divide.
The bottom 50% of US households now hold just 2.5% of total US wealth.
As the rush into assets ramps up, those who own assets will win and everyone else will be left behind.
The bottom 50% of US households now hold just 2.5% of total US wealth.
As the rush into assets ramps up, those who own assets will win and everyone else will be left behind.

Markets are more reactive and dynamic than ever.
As a result, the macroeconomy is shifting and stocks, commodities, bonds, and crypto are tradable and investable.
Want to receive our premium analysis?
Subscribe to access our premium analysis below:
thekobeissiletter.com/subscribe
As a result, the macroeconomy is shifting and stocks, commodities, bonds, and crypto are tradable and investable.
Want to receive our premium analysis?
Subscribe to access our premium analysis below:
thekobeissiletter.com/subscribe
Lastly, this chart summarizes what's happening.
Since ChatGPT was released in November 2022, job openings have plummeted while stocks have soared.
We are in the midst of a generational macroeconomic shift.
Follow us @KobeissiLetter for real time analysis as this develops.
Since ChatGPT was released in November 2022, job openings have plummeted while stocks have soared.
We are in the midst of a generational macroeconomic shift.
Follow us @KobeissiLetter for real time analysis as this develops.

• • •
Missing some Tweet in this thread? You can try to
force a refresh