Hanno Lustig Profile picture
Oct 10 6 tweets 4 min read Read on X
1/In the Eurozone, unconventional monetary policy leads to large cross-border fiscal transfers because it allows the periphery to borrow from the core at belo-market rates. We quantify these transfers. Image
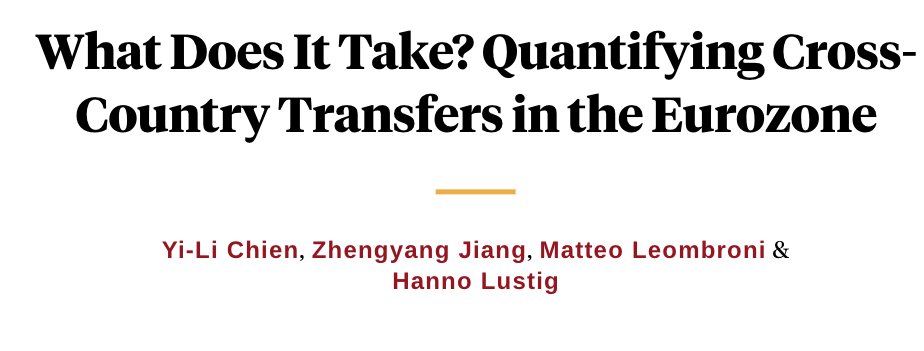
2/ The Eurosystem’s balance sheet had grown to 56% of GDP in the Eurozone by the end of 2021. Most of this growth has happened through an expansion of the national central bank (NCB) balance sheets, because NCBs carry out 90% of the asset purchases. The ECB funds its asset purchases mostly by issuing bank reserves in core countries. The NCBs of core countries accumulate claims on the NCBs of periphery countries intermediated by the ECB.2 These intra-Eurozone claims are referred to as Target2 assets and liabilities.

For example, between 2014 and 2021, the Bundesbank has funded its balance sheet expansion mainly by issuing bank reserves, while the Banca d’Italia has done so by issuing Target2 IOUs.Image
3/Whenever the ECB expands its balance sheet, the Eurozone periphery borrows from the core through the Eurosystem at a low rate below the market rate.

For these Target2 claims to be truly risk-free, the ECB must be the senior creditor, but, in that case, the government bonds of periphery countries would be rendered riskier by large-asset scale purchases, since bondholders have been effectively subordinated to the ECB. Existing empirical evidence implies that QE in the Eurozone lowers yields spreads by reducing credit risk. This evidence from bond market suggests that Target2 claims are directly exposed to default and redenomination risk in the perception of bond investors.Image
4/As these balance sheet expansions are concentrated in times of stress in bond markets, taxpayers in core countries like Germany are likely to be exposed to credit and currency risk—on the asset side of the Bundesbank—in high risk episodes, but they are not compensated for this risk. The ECB pools the income net of expenses earned by the NCBs on their balance sheets, and then redistributes the pooled income back to NCBs based on their capital key shares. Each NCB’s holding of its domestic sovereign debt is exempt from the pooling arrangement. As a result, NCBs in the periphery can borrow at low interest rates from the core to earn the carry profit on its own high-risk sovereign bonds.
5/This core-periphery pattern is an equilibrium phenomenon whenever investors impute a non-zero probability to a break-up of the Eurozone. All else equal, Eurozone banks will strictly prefer to hold reserves in the core countries, because core currencies would be expected to appreciate against periphery currencies in case of a Eurozone exit or break-up. As a result, bank reserves in the core and the periphery should not trade at par. Given that they do in the Eurosystem, banks strictly prefer to hold core reserves in equilibrium. Similarly, households strictly prefer to hold cashinthecorecountries. To the best of our knowledge, oursisthefirstpapertoarguethat this core-periphery pattern is an equilibrium phenomenon. This evidence from reserve accumulation in the core suggests that reserves in the periphery are exposed to currency redenomination risk.
6/To quantify the implicit transfers due to income pooling, we compare the income from the pooling arrangement to a counterfactual scenario without Eurozone, without the ECB pooling arrangements and without non-marketable debt. In this counterfactual scenario, NCBs do not 2pool the income, and assets earn market rates of return. We assume that theEurozone governments only borrow from other Eurozone governments at the prevailing market rates. We impute NCB incomes and expenses based on these assumptions. Importantly, we do not assume that Target2 claims are as risky as government bond

Over this period between 2014 and 2023, Germany paid a cross-border transfer of 11% of GDP to other counties, while Italy and Spain received a cross-border subsidy of 5.9% and 7.2% of their GDP, respectively. However, Italian and Spanish taxpayers receive only a smaller cumulative net subsidy of 2.6% and 2.1% of their GDP in the same period, because part of the cross-border transfers accrue to Italian and Spanish banks, not taxpayers. When accounting for all NCBs and ECB, cross-country subsidies sum to zero.
The red lines are the cross-country subsidies.Image

• • •

Missing some Tweet in this thread? You can try to force a refresh
 

Keep Current with Hanno Lustig

Hanno Lustig Profile picture

Stay in touch and get notified when new unrolls are available from this author!

Read all threads

This Thread may be Removed Anytime!

PDF

Twitter may remove this content at anytime! Save it as PDF for later use!

Try unrolling a thread yourself!

how to unroll video
  1. Follow @ThreadReaderApp to mention us!

  2. From a Twitter thread mention us with a keyword "unroll"
@threadreaderapp unroll

Practice here first or read more on our help page!

More from @HannoLustig

Apr 16
What can we learn from the high-frequency response in bond and currency markets to the tariff announcement about the status of the US dollar as the global reserve currency?

Short paper.
tinyurl.com/tr8u383w
joint work with Arvind Krishnamurthy, Zhengyang Jiang (@ProfJiang ), Rob Richmond (@rrichmond ), and Chenzi Xu (@chenzix)

We conclude that the tariff announcements have led investors to question the role of the dollar as the reserve currency. This explains why the dollar has depreciated by 3.4% between April 4 and April 14 in spite of rising US rates. As a result, the willingness of foreign investors to pay extra for the safety of dollar safe assets has declined. Our measure of this willingness to pay is the 1-year US Treasury basis, measured against the German Bund, plotted in black in the Figure below. The basis (left vertical axis) is the yield on the synthetic Treasury constructed from the German bund minus the yield on the actual Treasury. The decline in the Treasury basis explains the depreciation of the dollar over the past few weeks, in spite of rising rates.

🧵 below.

Plot of 1-year Treasury basis against German Bund. Defined as German yield (hedged into USD) minus US Treasury yield (left vertical axis). Euro/USD exchange rate (right vertical axis).Image
1/ On April 2, President Trump announced the reciprocal tariffs to be imposed on a long list of countries. On April 4 China retaliated. The VIX, a measure of implied volatility in the US stock market, more than doubled and peaked at 52 on April 8, 2025, up from 21 on April 2. This means that stock investors estimated the annualized volatility of S&P 500 stock returns to be around 52% per annum. Between April 4 and April 14, the US dollar depreciated by 3.6%. The depreciation of the dollar was surprising to market participants. Normally, in times of global volatility, such as during the GFC of 2008 and the onset of the pandemic in March of 2020, the dollar appreciates as dollar-denominated assets benefit from a flight to safety. Not this time around.
2/Even more puzzling, U.S. long-term interest rates rose significantly from April 4 to April 14. The yield spread between 10-year US Treasury bonds and 10-year German Bunds, plotted against the left vertical axis in Figure 1, increased by 50 bps. We also plot the Euro/USD exchange rate against the right vertical axis. All else equal, a higher long-run interest rate on dollar investments should lead investors to shift capital into the US dollar, thus strengthening the dollar. If we use long-run uncovered interest rate parity as the benchmark, a 50 basis points increase in U.S. long-term yields relative to European yields should immediately appreciate the dollar by about 5%. Yet, we observed a 3.6% depreciation, leaving a surprising gap of 8.6%. The dollar became disconnected from yields.Image
Read 12 tweets
Apr 10
Don't blame the plumbing of Treasury markets, blame Congress and the White House. Not the unwinding of the basis trade in US Treasury markets, but the response to a large, macro shock.

March 2020 was the first sign of cracks in the global safe asset supplier armor. April 7 and 8 2025 provide more evidence. Late-stage exorbitant privilege.

A 🧵

When USTR yields spiked on Tuesday, everyone was pointing to the unwinding of basis trades by hedge funds. While that may have contributed to the spike in yields, the fundamental shock was a macro shock.

If the US disentangles itself from the global financial system, and runs current account balances with ROW, then the ROW cannot be counted to absorb all of that new issuance coming down the pipeline. The demand curve for USTR shifts inwards as a result. Furthemore, there is a ton of evidence that the ROW were inelastic or price-insensitive buyers of USTR. This happens at a time when Congress is set to extend the TCJA, adding $ 37 trillion in new deficits over 30 years, and pushing the debt/GDP ratio above 200% by .

As a result, if you're holding long bonds, then the rational response in this macro environment is to sell, in anticipation of increases in yields.

Just for context, according to the Flow of Funds, the ROW holds $8.494 trillion in Treasurys, compared to $3.821 for the Fed, $2.681 for households, and $4.479 trillion for money market and mutual funds. Holdings plotted below.

If you insist on current account balances or surpluses for the US, then foreigners will likely not be net buyers of USTR in the future. In fact, Americans will likely become net buyers of foreign bonds. All that issuance will have to absorbed by Americans.Image
2/For the past 75 years The US has been the global safe asset supplier. And that’s a great position to be in.

The Great Financial Crisis is a good example. Lehman failed in September of 2008. Foreign investors started buying Treasurys in bulk. In the fourth quarter of 2008 alone, foreign investors absorbed $270 billion in Treasurys, more than half of the $ 554 billion that had been issued by the Treasury. Throughout the 2008-2009 GFC, foreign investors were strong buyers of Treasurys.

After Congress passed the TARP bill (Emergency Economic Stabilization Act of 2008), the 10-year Treasury yield continued to decline by another 200 bps. The federal government was about to run deficits in excess of 9% of GDP in 2009 and 8.9% in 2010, unprecedented in peacetime. In spite of the massive issuance ahead, the Treasury market was happy to absorb all of this without forcing yields higher.

That is part of the exorbitant privilege of the US in the international financial system.
In the past, whenever the U.S. Treasury needed to dramatically increase issuance, as it did during the GFC, it could count on foreign investors to show up and start buying, at least if the crisis was global in nature. These investors are not particularly price-sensitive either. Safe-asset buyers are distinct from other investors. They are not simply trading off expected returns against risk. In fact, they are perfectly happy to forego some expected return in exchange for the safety and liquidity of Treasurys. You can think of that as foreigners paying a user fee for Treasurys!

Often, the advice US economists have for fiscal policymakers abroad (including the Eurozone) misses the mark because other countries can't go out and issue a ton of debt in global recessions without driving up yields. They call it exorbitant privilege for a reason.
3/I am going to argue that the US is now in late-stage exorbitant privilege.

The first signs of cracks in the armor were seen when COVID arrived in US. When the COVID-19 pandemic arrived in the US, the yield on the 10-year increased by 68 bps over the course of eight trading days between March 9 and March 18. Treasury yields increased as stocks were declining in value and as the VIX peaked. There was no textbook flight to safety by foreign investors.

Foreign investors were net sellers of Treasurys in the first quarter of 2020. The rest of the world sold more than $ 284 billion in Treasurys in the first quarter of 2020. Most of the foreign selling was concentrated at longer maturities. In March of 2020, foreign investors sold more than $400 billion of U.S. Treasury Notes and Bonds, followed by sales of $200 billion in April. The Fed purchased more than $1.01 trillion in the first quarter of 2020, absorbing more than twice the Treasury’s total issuance of $ 385 billion. Put differently, the private sector sold $616 billion in Treasurys in the first quarter of 2020. (below plots of 4-quarter moving average of net purchases of Treasurys at annual rates.)

That’s some evidence from quantities about the reduced appetite for Treasurys abroad.Image
Read 13 tweets
Feb 22
Yes, debt has been the ruin of great powers. In "Exorbitant Privilege Gained and Lost: Fiscal Implications", forthcoming in the JPE, we study the experience of the Dutch Republic and the UK.

Both were able to borrow a lot at low yields, more than warranted by fundamentals. The UK lost that privilege around the interbellum. The Dutch Republic around the end of the 18th century.

Bondholder losses and financial repression ensued.

The US then took over the baton from the UK as the world's safe asset supplier after WWII and was able to borrow a lot more than warranted by fundamentals in the past decades. But the appetite for Treasurys among investors has waned, especially abroad.

papers.ssrn.com/sol3/papers.cf…Image
Image
Before WWI, the UK's debt/GDP ratio (in blue) exceeded the fundamental value, the PDV of surpluses (in red). Image
Read 4 tweets
Jan 14
Treasurys are on sale. It used to be the case that if you compared US Treasurys to other securities, the US Treasury would always be expensive, compared to:

1/ foreign bonds: actual Treasury were typically more expensive than synthetic US Treasury constructed from e.g. a German Bund using currency risk hedges (i.e., the yield on Treasury lower than yield on synthetic Treasury).
2/ corporate bonds: actual Treasury were typically more expensive synthetic US Treasury constructed from AAA corporate bonds using credit risk default swaps (i.e., the yield on Treasury lower than yield on synthetic Treasury constructed from AAA corporate).
3/swaps: actual Treasury were typically more expensive than synthetic US Treasury position using swap (i.e., yield on Treasury lower than swap rate or positive swap spread).

All of these yield spreads have now flipped signs at longer tenors. Actual Treasurys are now typically cheaper than the synthetic versions (or, equivalently, actual yields are higher than synthetic yields).

You can construct 'plumbing' explanations for each of these, but taken together, they suggest that the increased Treasury supply has pushed down the convenience yields investors get from the safety and liquidity of US Treasurys.

As global government bond supply increases and central banks have stopped buying, US Treasurys are now cheap relative to equivalent instruments.

Demand for the safety and liquidity of Treasurys is downward sloping. That was always a key problem with the r
🧵 with some pictures.
1/ Compared to foreign bonds: The n-year Treasury basis is defined as the difference between the n-year foreign Treasury yield plus a currency forward contract that hedges the foreign exchange risk (i.e., the synthetic Treasury yield) and the actual n-year US Treasury yield.

A positive basis means the actual Treasury yields are lower. We use safe government bonds for G-10 countries to measure foreign government yields, so that default risk is small.

At 5-year and 10-year tenors, the basis is negative, while it's close to zero at the 1-year. Figure from @ProfJiang and @rrichmond's new paper.
papers.ssrn.com/sol3/papers.cf…Image
2/Compared to corporates: The blue line plots the spread between 10-year AAA corporate and Treasurys. The red line is the CDS-adjusted version of the AAA/AA-Treasury spread (as in Lira Mota's 2023 paper). The gray line denotes the 3-month GC rate-Treasury spread. The vertical dotted lines denote March of 2020 and March of 2022.
kansascityfed.org/documents/1034…Image
Read 6 tweets
Jan 4
2024 may also be remembered as the year U.S. fiscal exuberance died.

post-mortem 🧵 on how we got here.

Right now, with the 10 year US Treasury yield trading well above 4.5% and the federal government spending roughly the equivalent of the defense budget just on interest expenses, a fairly broad-based consensus seems to be developing among economists that the fiscal path we’re on is in fact not a sustainable one, as Jay Powell pointed out 4 weeks ago. r
The figure below plots the federal government's interest expense as a fraction of US GDP.Image
2/But until last year, there was broad-based fiscal exuberance in the US. Not just the “Learn to love trillion dollar deficits” variety of the Modern Monetary Theory fringes.

Even among mainstream economists there was widespread fiscal optimism. “Put bluntly, public debt may have no fiscal cost” (Olivier Blanchard's AEA presidential address, 2019). The underlying idea was that we can just roll over deficits permanently because the US govt's cost of funding is always lower than the growth rate of the economy, r
3/It wasn’t always like that. In the early 90s, US Treasury yields started to surge as markets grew concerned about the size of deficits. The benchmark 10-year yield increased from 5.2% in late 1993 to more than 8% 12 months later. Partly in response to what came to be known as the bond market massacre, the federal government under the Clinton administration started to run small surpluses. One of Clinton’s advisers, James Carville, was so impressed with the sway of the bond market vigilantes that he famously quipped

“I used to think that if there was reincarnation, I wanted to come back as the president or the pope or as a .400 baseball hitter. But now I would like to come back as the bond market. You can intimidate everybody.”
In 2000, the last year the US was running surpluses, the ratio of debt to GDP was 39%.
Read 20 tweets
Nov 3, 2023
📣📣What about Japan?

Fiscal sustainability in Japan. Image
1/Whenever you bring up fiscal sustainability, you’ll get questions about Japan. Japan is not in the r<g region. Since 1997, the real return on Japanese government debt has exceeded the growth rate by 1.2%.
2/So, we decided to dig into the Japanese case by consolidating the public sector's balance sheet. papers.ssrn.com/sol3/papers.cf…
Read 7 tweets

Did Thread Reader help you today?

Support us! We are indie developers!


This site is made by just two indie developers on a laptop doing marketing, support and development! Read more about the story.

Become a Premium Member ($3/month or $30/year) and get exclusive features!

Become Premium

Don't want to be a Premium member but still want to support us?

Make a small donation by buying us coffee ($5) or help with server cost ($10)

Donate via Paypal

Or Donate anonymously using crypto!

Ethereum

0xfe58350B80634f60Fa6Dc149a72b4DFbc17D341E copy

Bitcoin

3ATGMxNzCUFzxpMCHL5sWSt4DVtS8UqXpi copy

Thank you for your support!

:(