Most traders ignore Inversion Fair Value Gaps (IFVG). Smart money doesn’t.
Once you understand how they flip liquidity and bias, you’ll see the chart differently. 👇
[🧵Thread]
Once you understand how they flip liquidity and bias, you’ll see the chart differently. 👇
[🧵Thread]
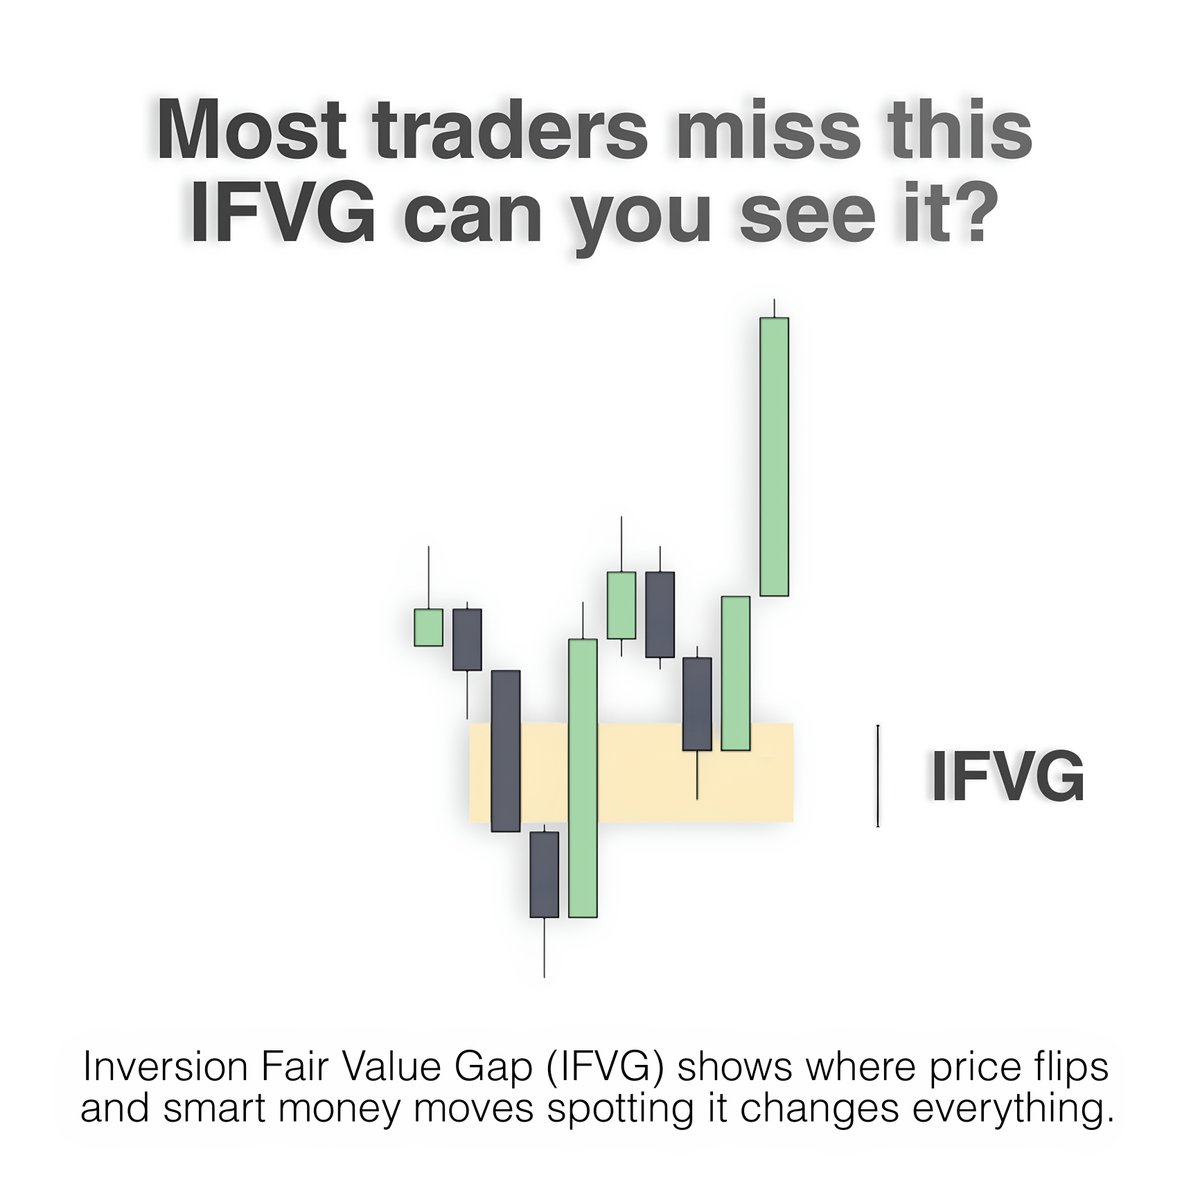
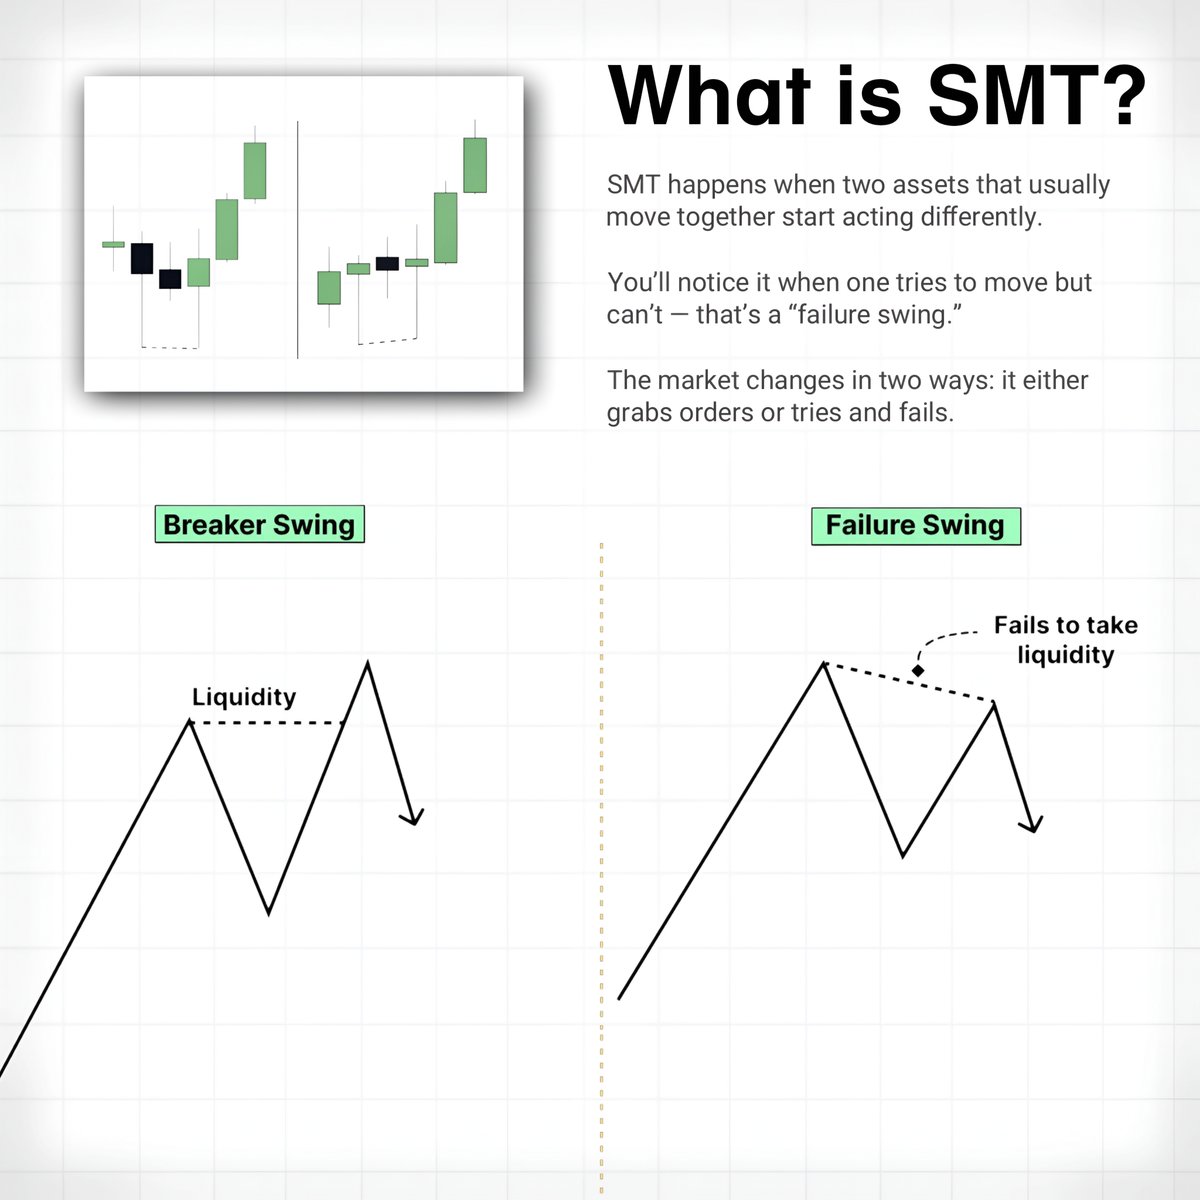
What is Inversion FVG (IFVG)?
Inversion FVGs are fair value gaps that fail and show a change in market flow.
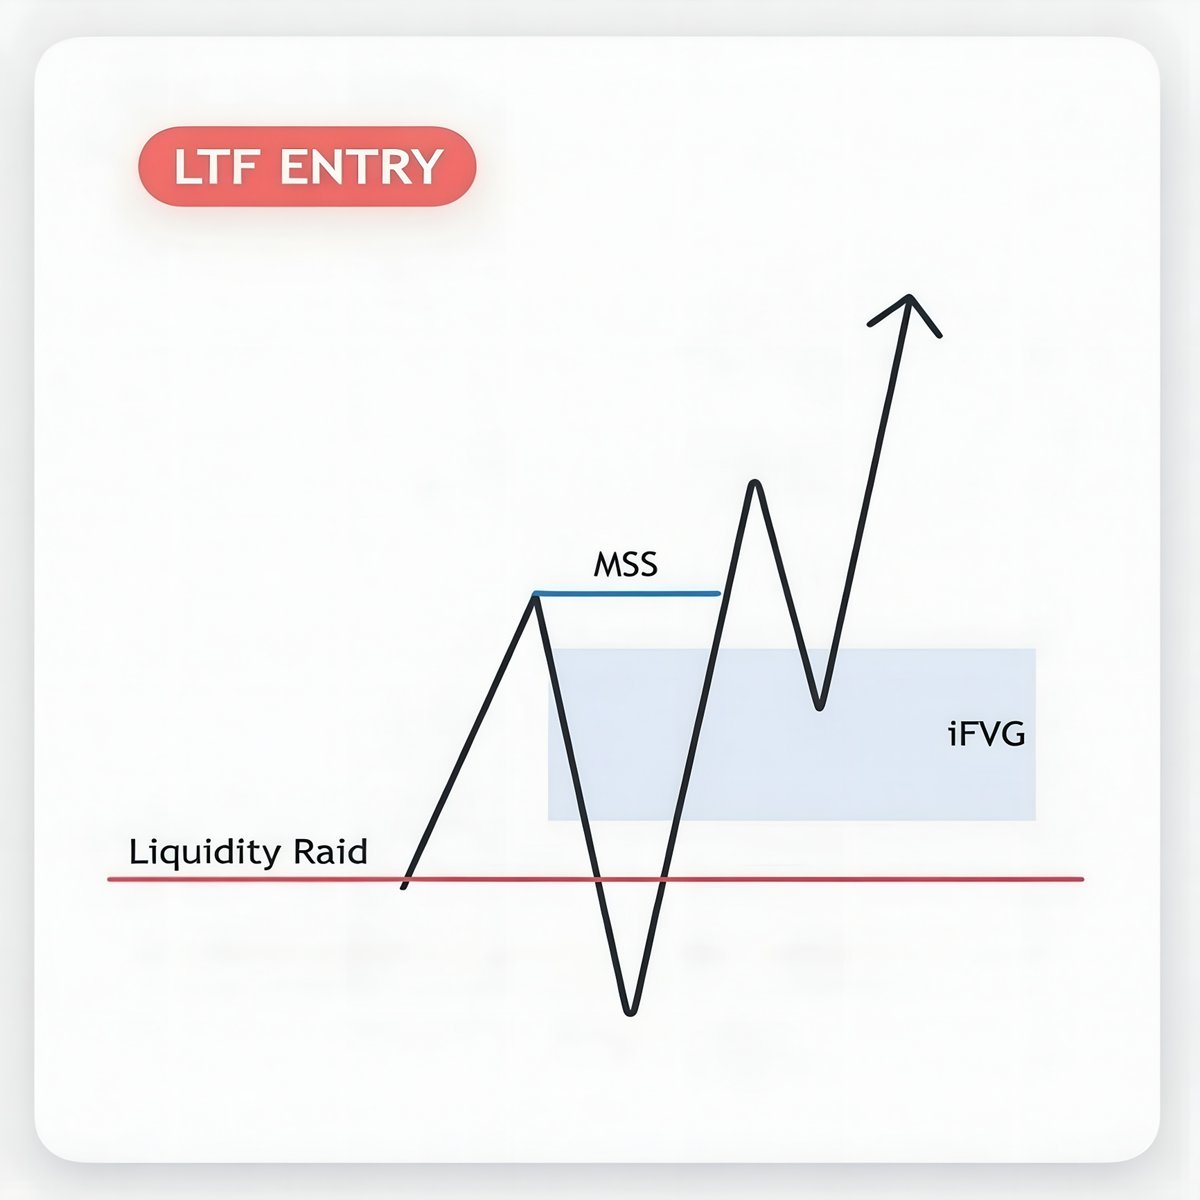
They can be used as entries on lower or higher timeframes, points of interest, or signals of market structure change.
Inversion FVGs are fair value gaps that fail and show a change in market flow.
They can be used as entries on lower or higher timeframes, points of interest, or signals of market structure change.

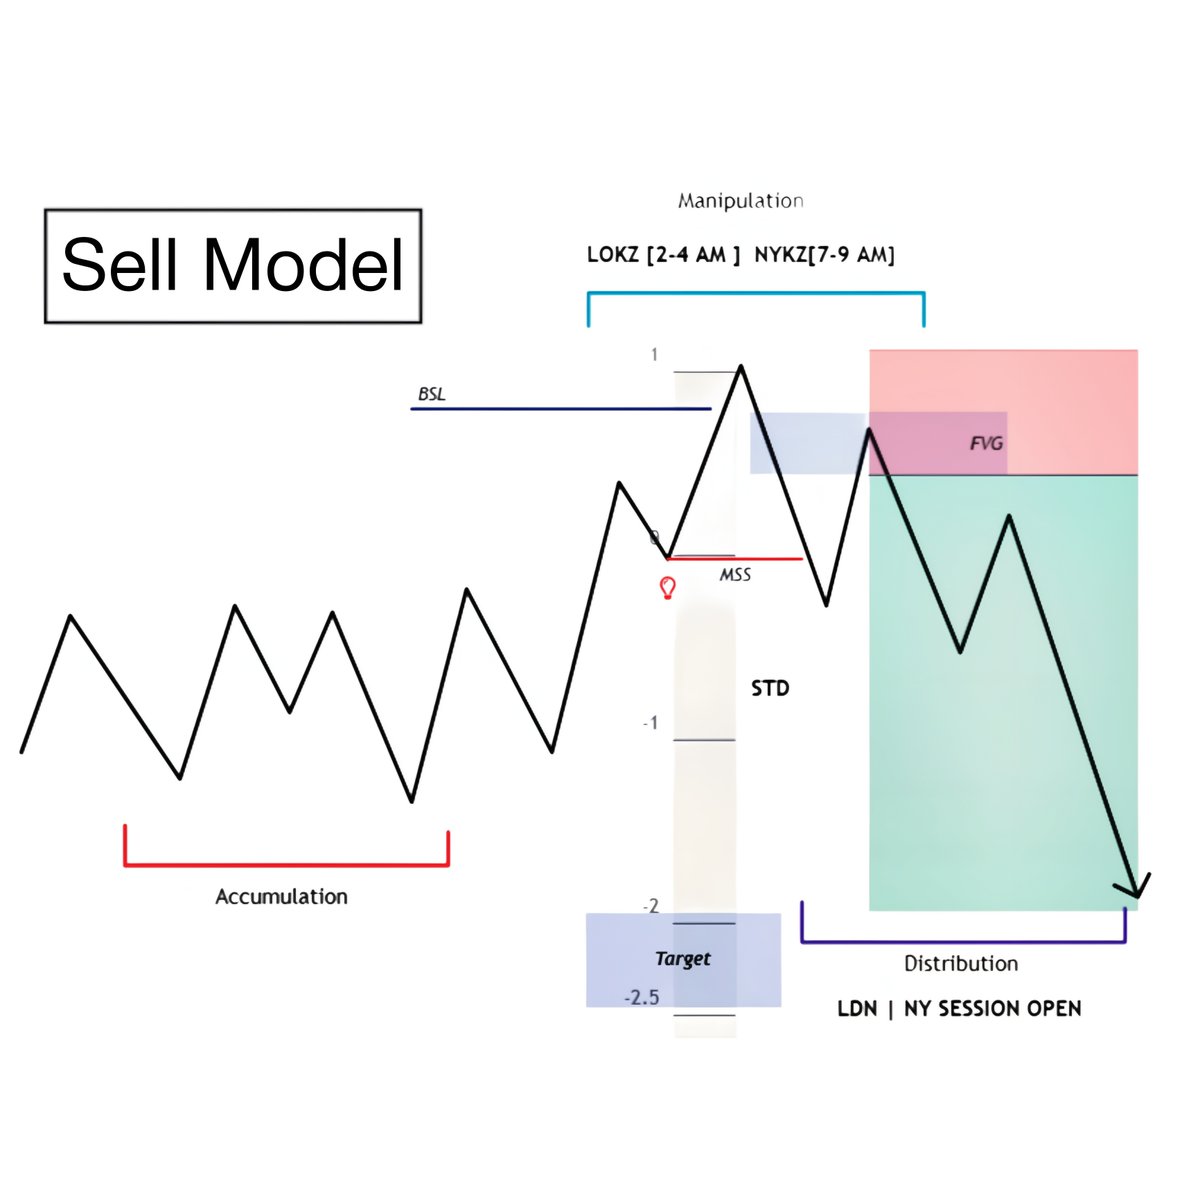
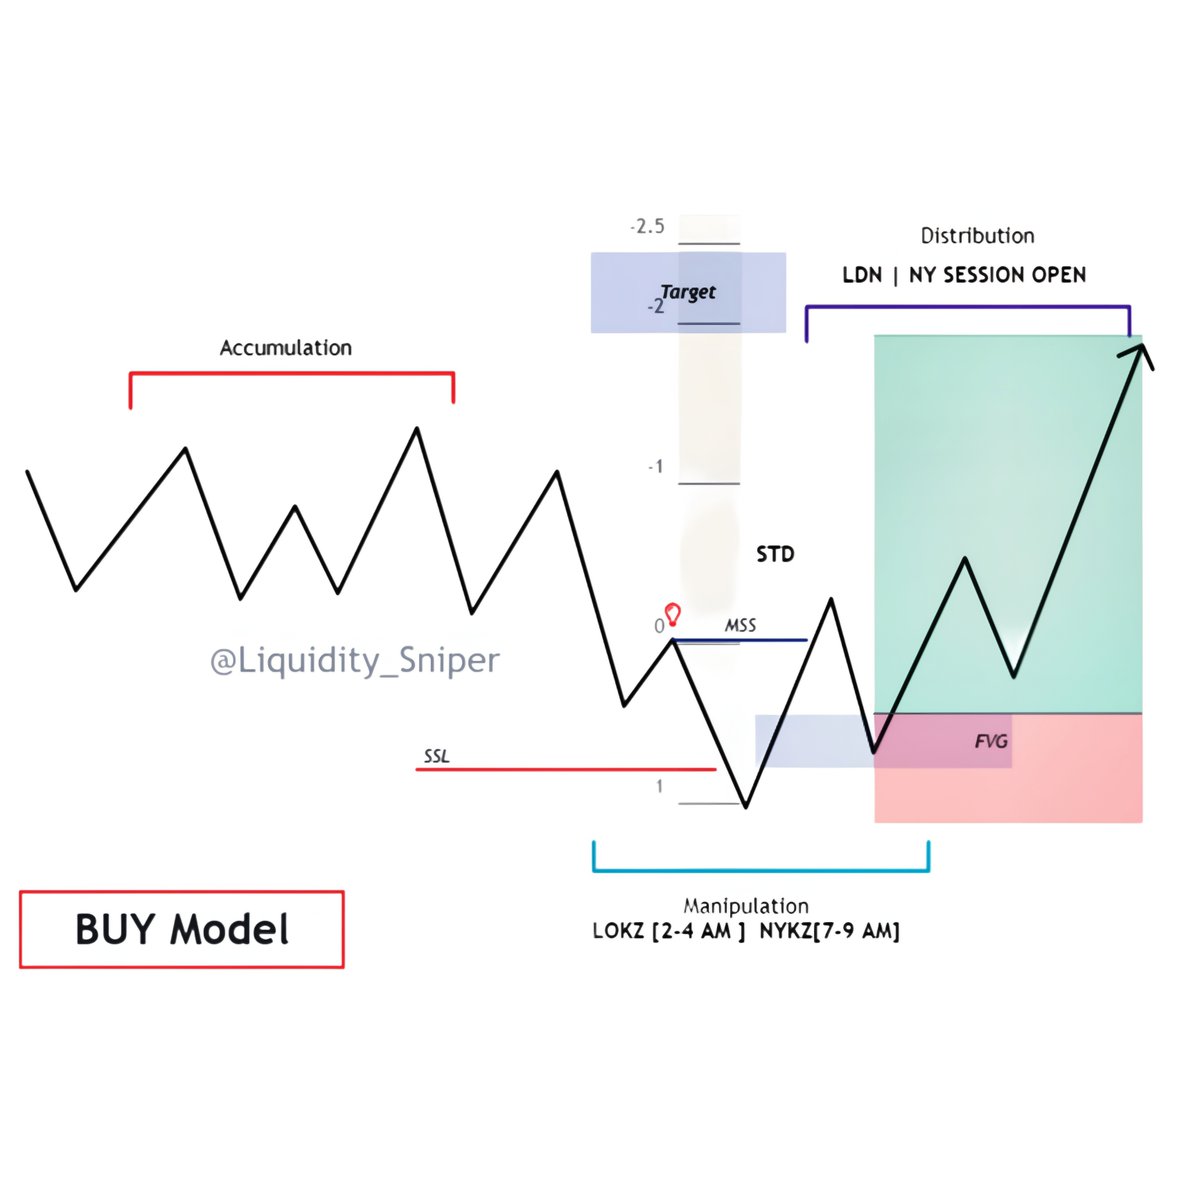
A bullish inversion happens when price closes above a SIBI FVG.
This shows the flow changed from selling to buying, and the FVG now acts as support.
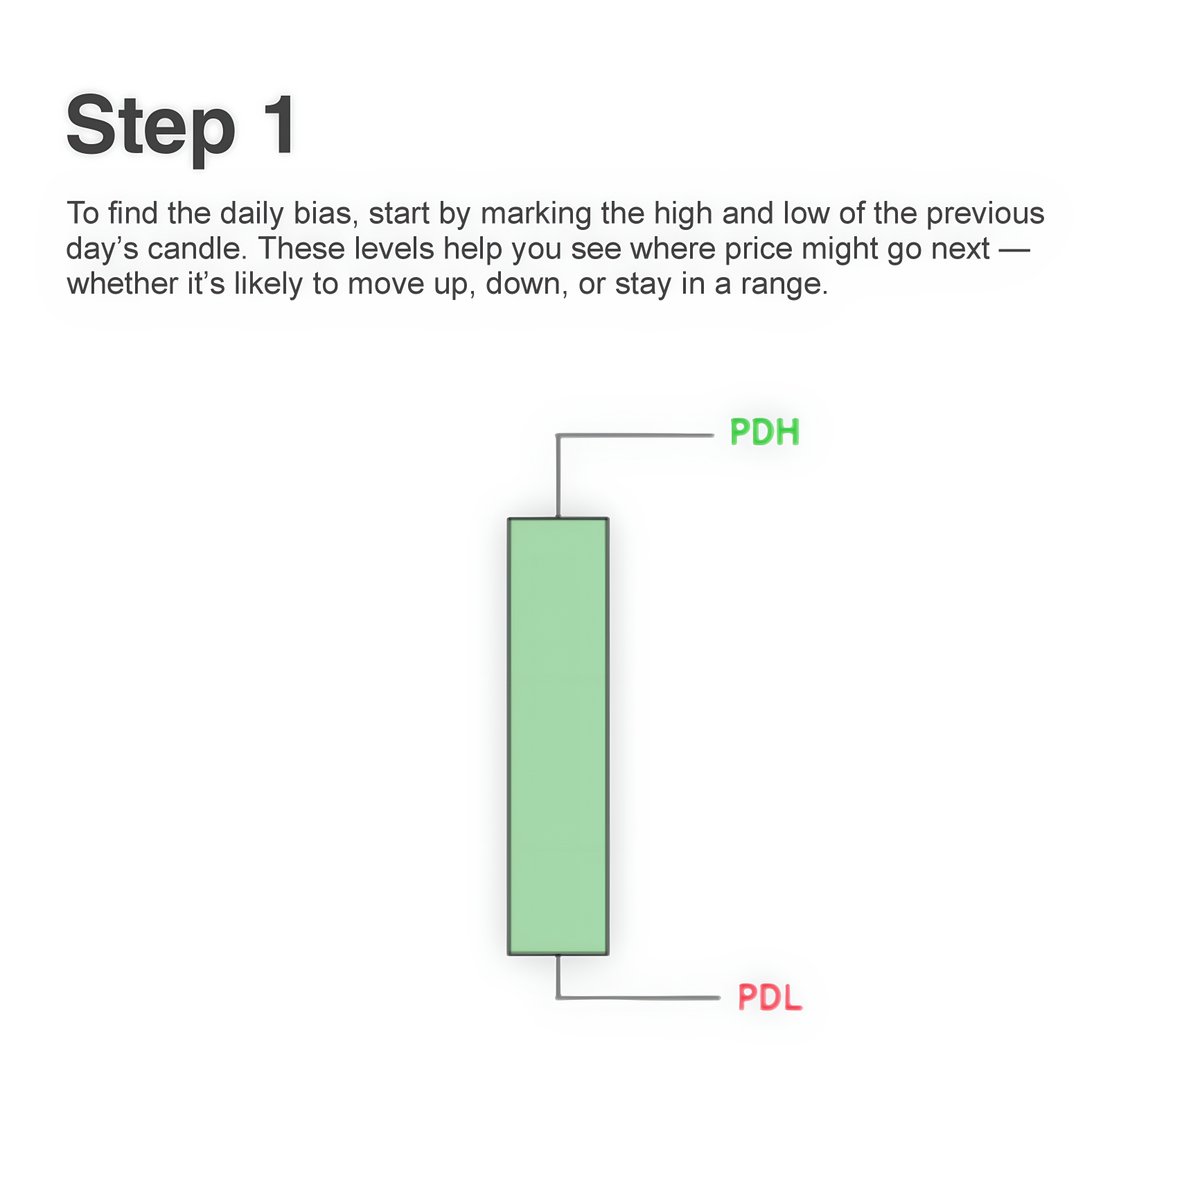
Step 1 : Mark FVG
This shows the flow changed from selling to buying, and the FVG now acts as support.
Step 1 : Mark FVG

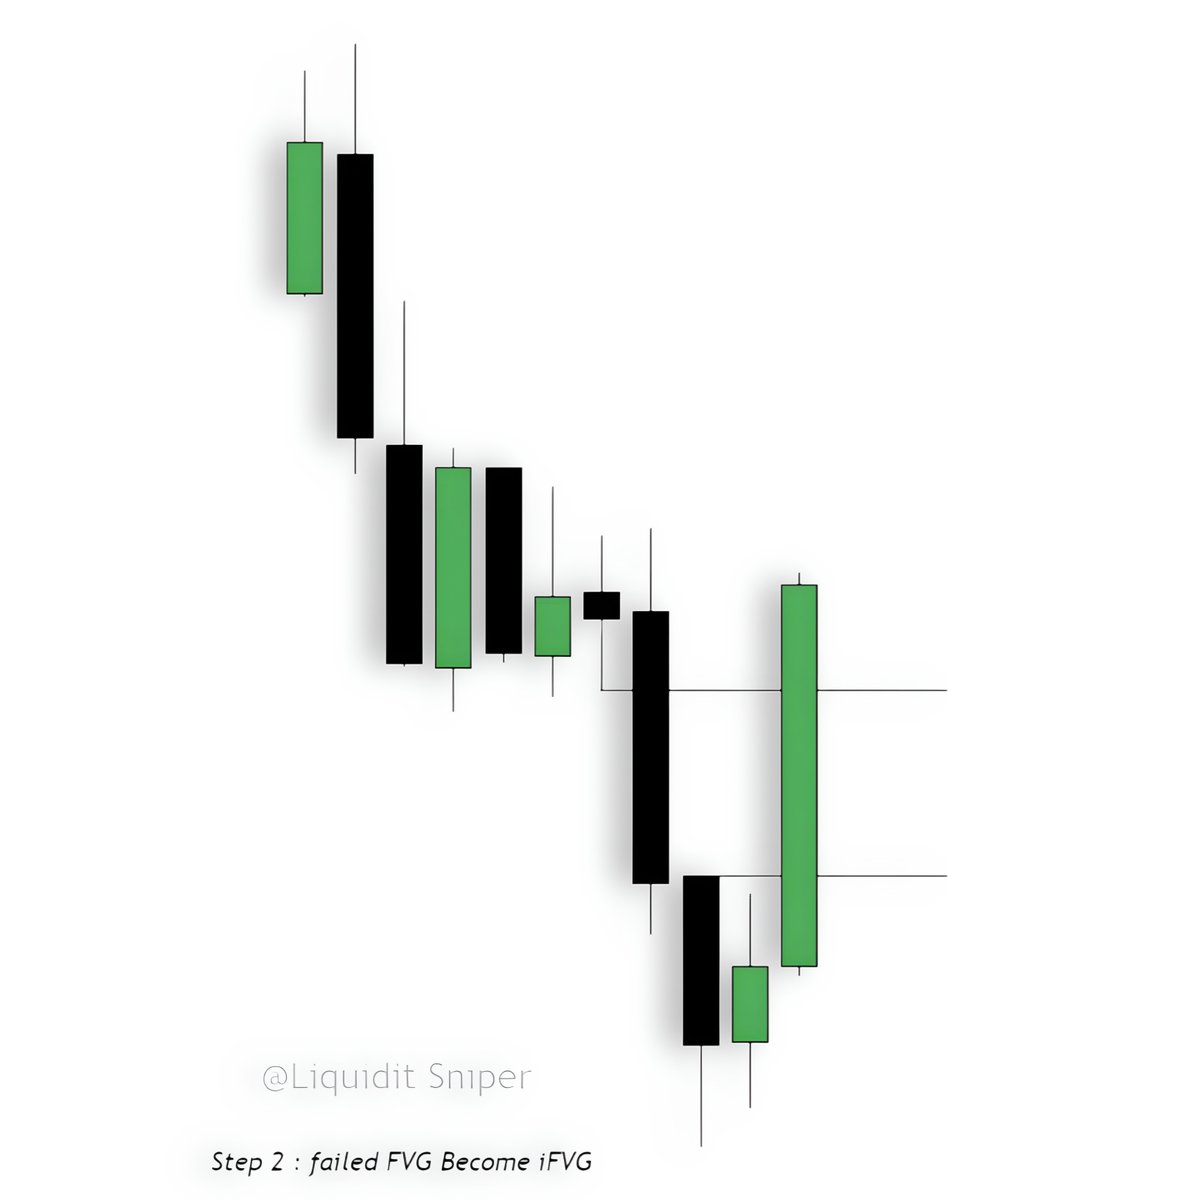
Step 2 : failed FVG become Inversion fvg (IFVG).
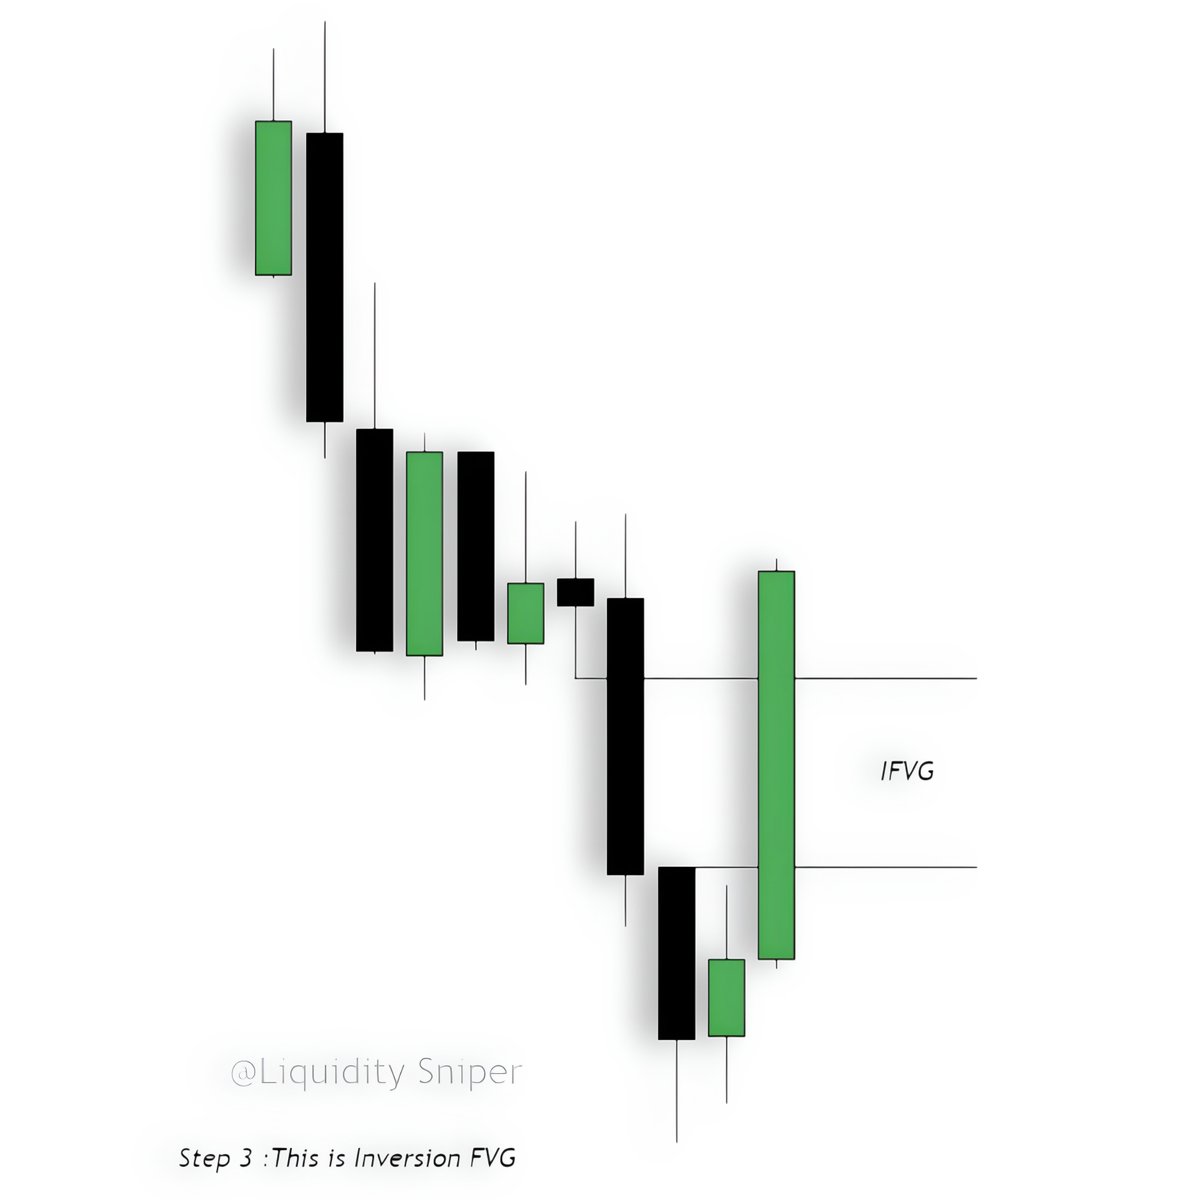
Step 3: Identify and mark your Inversion FVG (iFVG).
Step 4: Enter at the top of the zone and place your stop loss at the swing low.

Step 5: Set your target using liquidity levels, BSL, standard deviation, or 2RR.
This is how you confirm an Inversion FVG.
This is how you confirm an Inversion FVG.

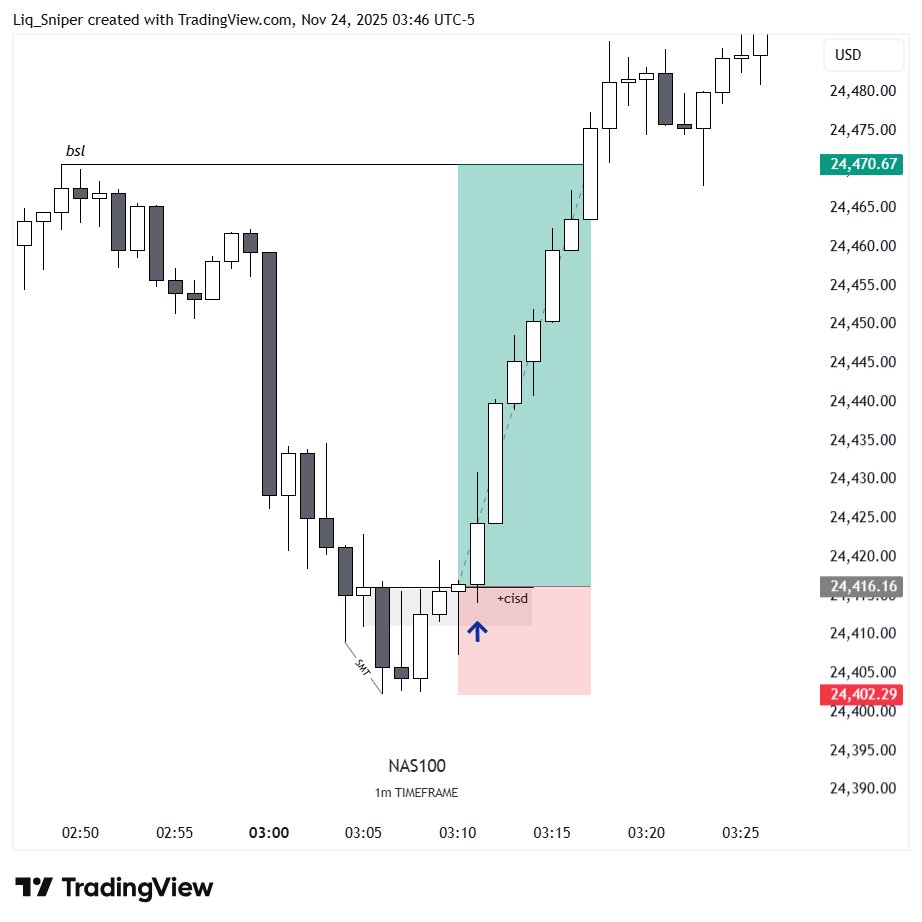
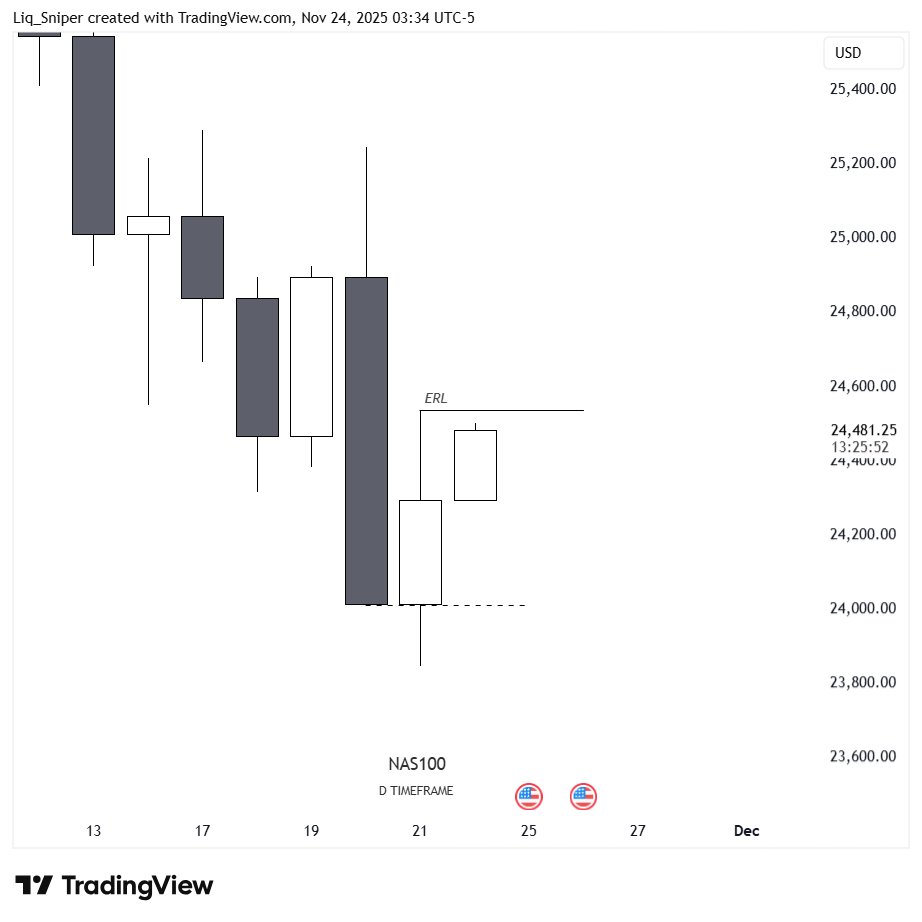
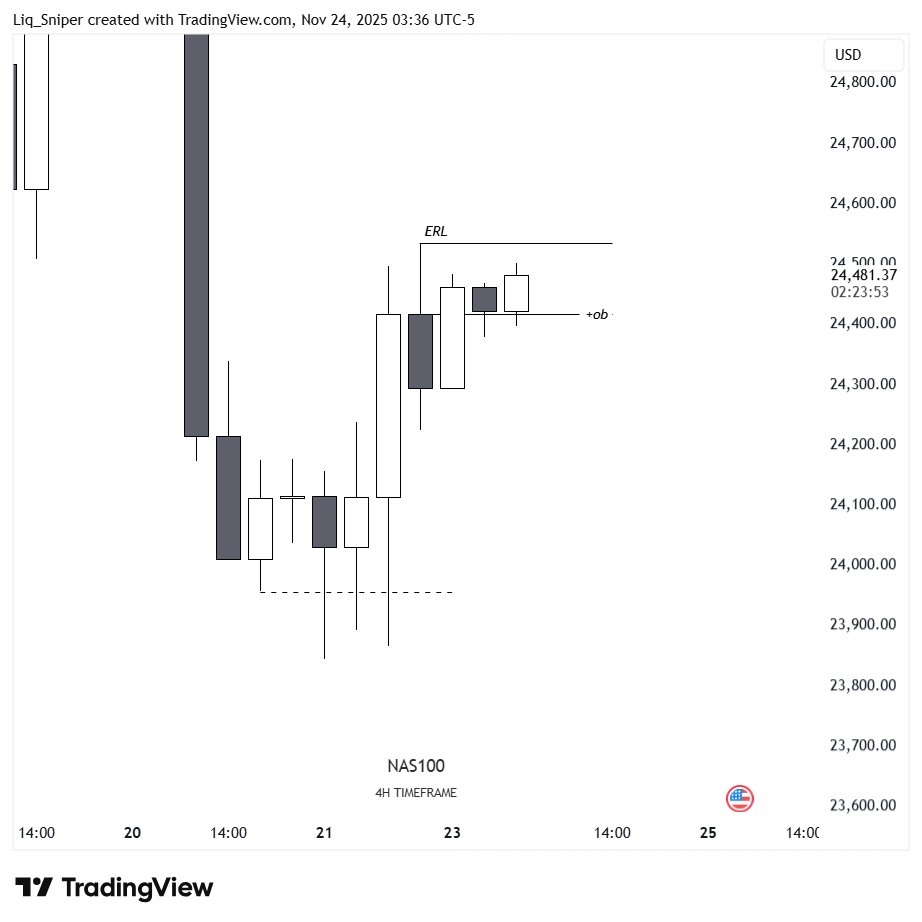
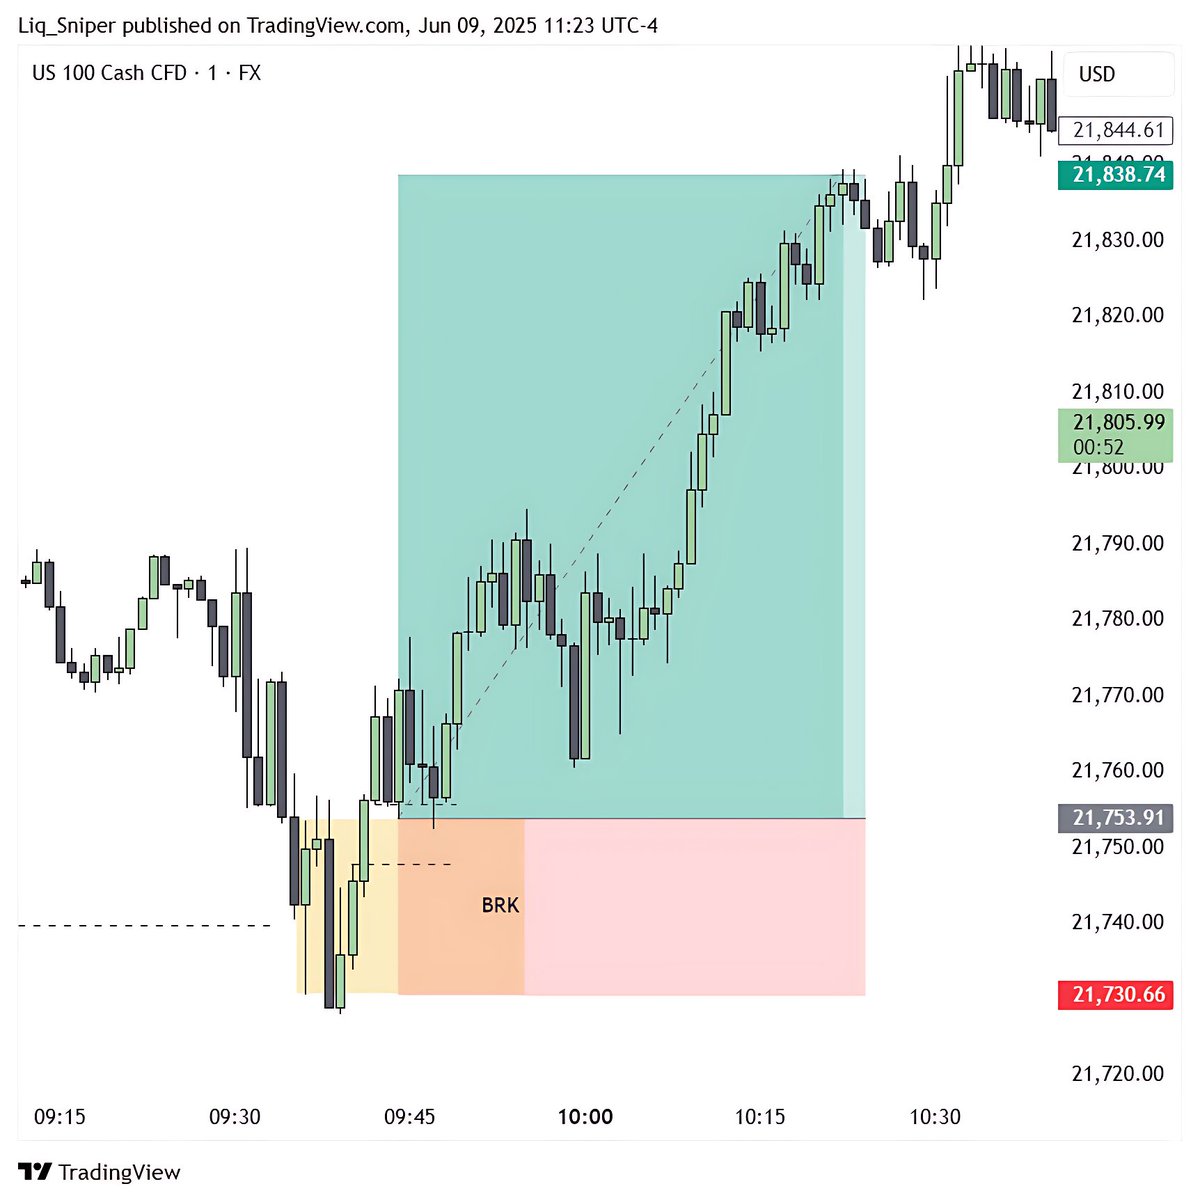
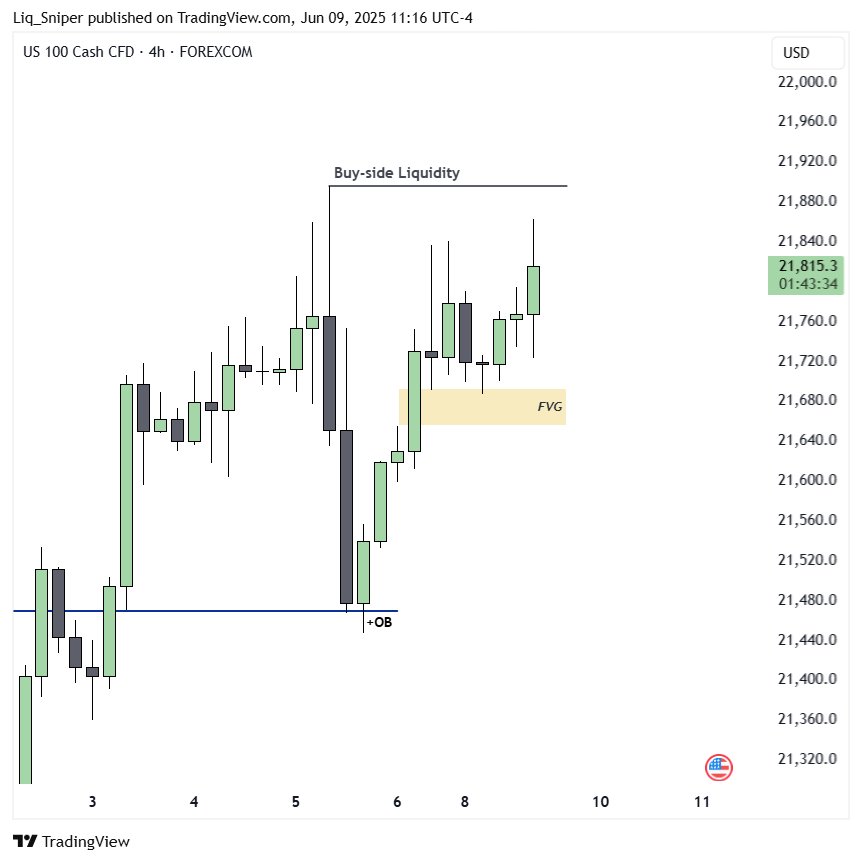
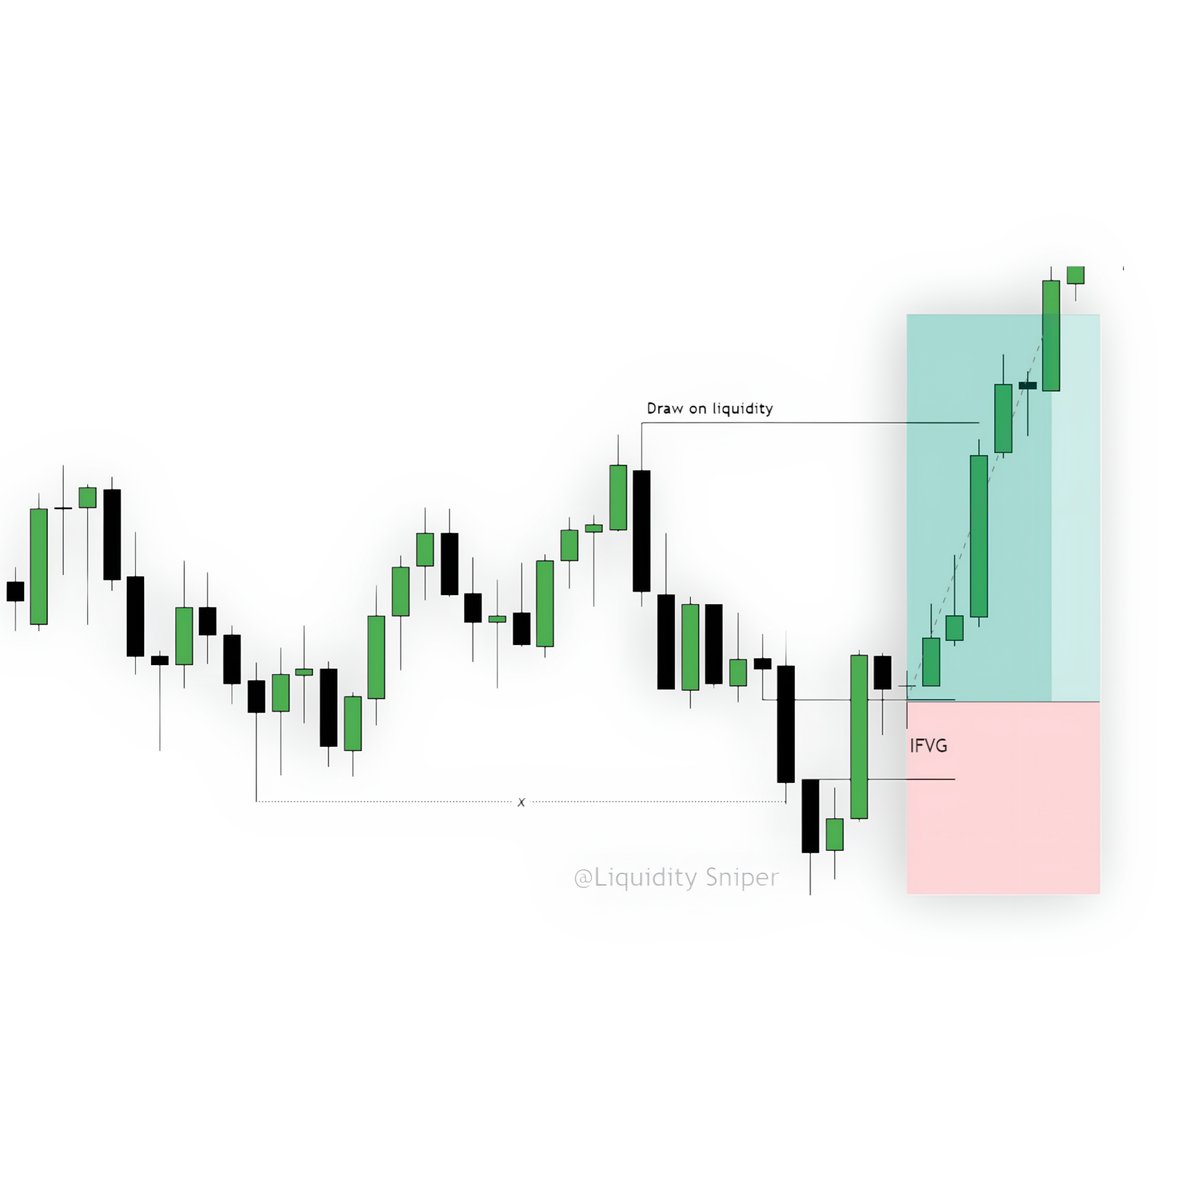
Examples :
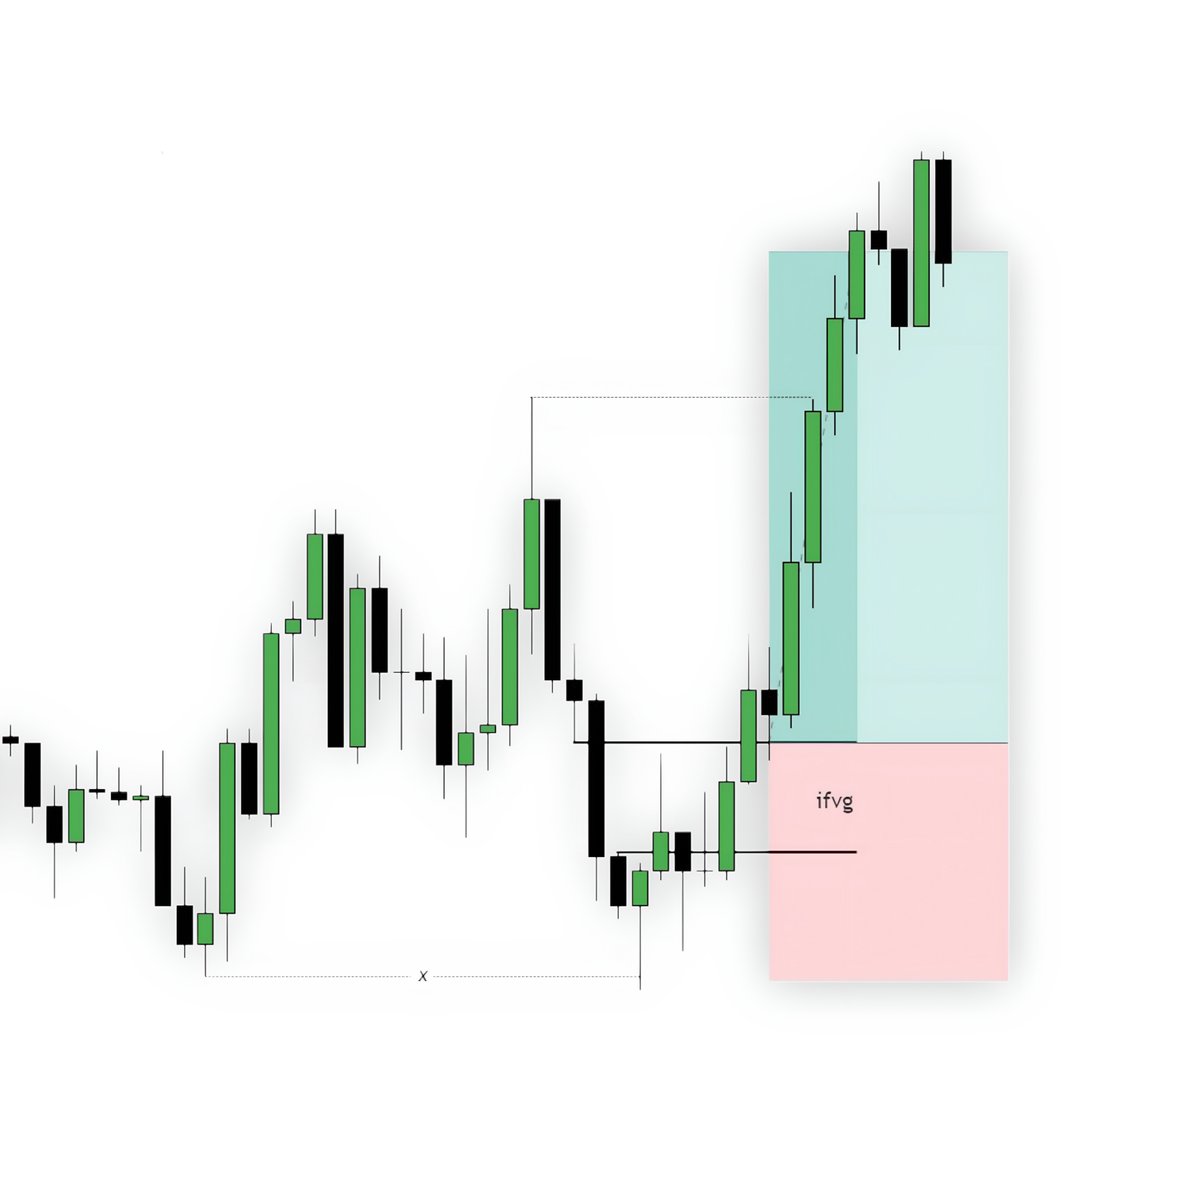
IFVG Examples :
Join for weekly outlook updates and Educational content : t.me/Liquidity_Snip…

Ready to trade with the best?
The5ers has been trusted since 2016 for fast payouts and low spreads. You won’t regret it. ✨
🎉Get 10% OFF now:
Questions? DM me anytime ✉️. the5ers.com/?afmc=o78
The5ers has been trusted since 2016 for fast payouts and low spreads. You won’t regret it. ✨
🎉Get 10% OFF now:
Questions? DM me anytime ✉️. the5ers.com/?afmc=o78

• • •
Missing some Tweet in this thread? You can try to
force a refresh