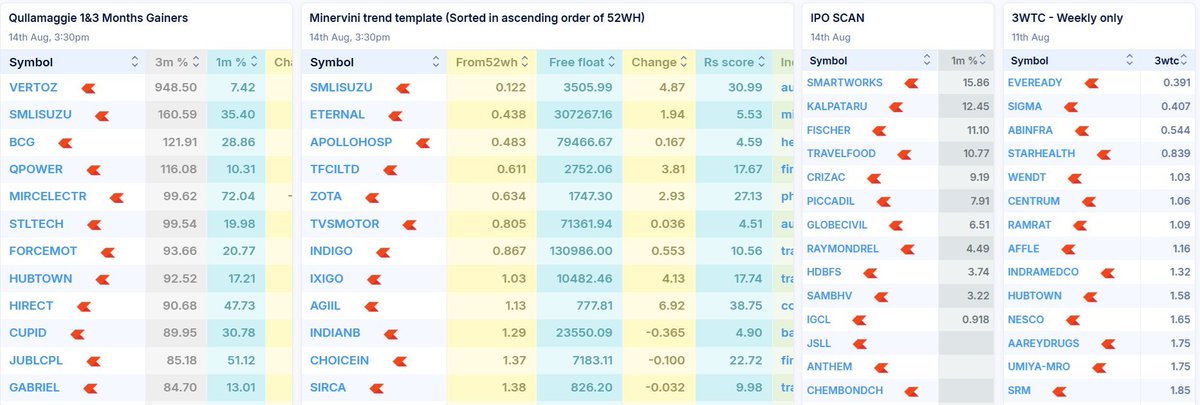
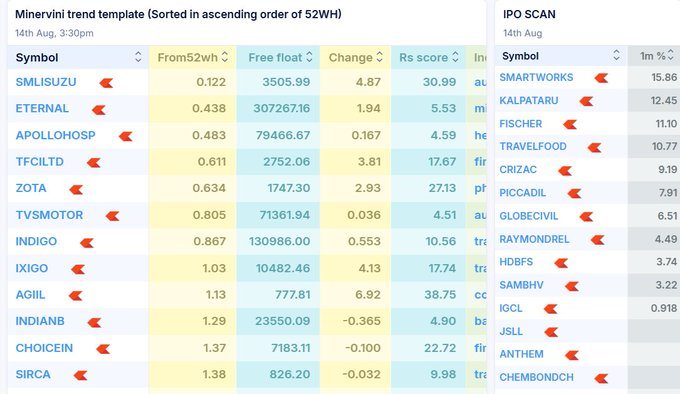
Minervini Trend Template : Filters out sideways or weak stocks.
Focuses on names that already have institutional buying interest.
Helps avoid “cheap” stocks that are actually weak trends.
IPO Scan : Lists out Stocks that have got listed recently
These two scans are used for spotting momentum stocks:
Focuses on names that already have institutional buying interest.
Helps avoid “cheap” stocks that are actually weak trends.
IPO Scan : Lists out Stocks that have got listed recently
These two scans are used for spotting momentum stocks:
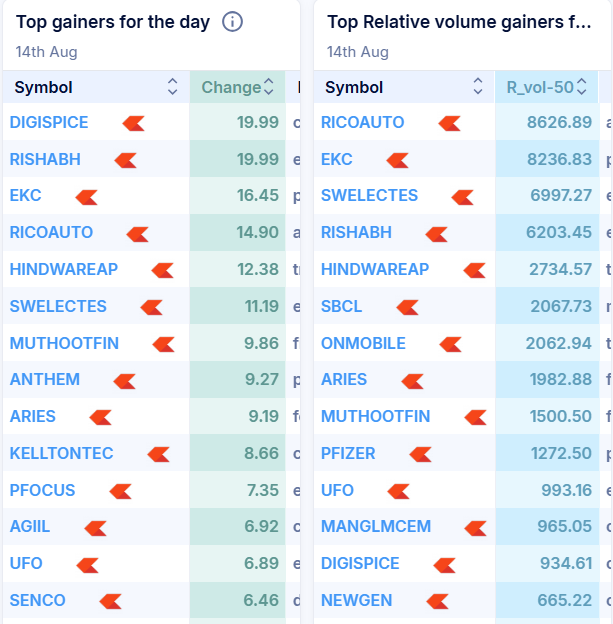
Top Gainers for the Day → Shows stocks with the highest price percentage increase today.
Good for finding intraday momentum leaders.
Top Relative Volume Gainers → Shows stocks with trading volume much higher than their 50-day average (relative volume spike).
Good for spotting unusual activity that might signal news, breakouts, or big moves.
Good for finding intraday momentum leaders.
Top Relative Volume Gainers → Shows stocks with trading volume much higher than their 50-day average (relative volume spike).
Good for spotting unusual activity that might signal news, breakouts, or big moves.
Market Breadth Scanner
1. 10-day SMA – No. of Stocks Above 10DMA Counts how many stocks are currently trading above their 10-day moving average. Purpose:
Short-term market sentiment. High readings → many stocks in short-term uptrends → possibly overbought. Low readings → many stocks in short-term downtrends → possibly oversold.
2. 20-day SMA – No. of Stocks Above 20DMA Counts how many stocks are above their 20-day moving average. Purpose:
Slightly longer-term momentum check. Can confirm if a short-term bounce (seen in the 10DMA chart) is also supported in the medium term.
3. % of Stocks Above Key Moving Averages Table Shows the percentage of all stocks above their: 20DMA (short-term trend) 50DMA (medium-term trend) 200DMA (long-term trend)
Purpose: See whether strength/weakness is across all timeframes. If all 3 are high → broad, healthy market. If all 3 are low → broad, weak market.

Join telegram for more such screeners t.me/Techno_charts
1. Net New 52-week High & Low Measures the number of stocks making new 52-week highs minus those making new 52-week lows.
Purpose: Positive → more stocks making fresh yearly highs → strong market. Negative → more stocks hitting yearly lows → weak market. Good for big-picture, long-term trend confirmation.
2. Net New 3-Month High Similar idea, but based on 3-month highs and lows. Purpose: Acts as an early warning signal before the 52-week version.
Can detect short-to-medium term trend changes sooner. Useful for spotting early strength or weakness before it shows up in longer-term charts.

Watch the complete video :
Chartink Dashboard Link :
chartink.com/dashboard/2496…
chartink.com/dashboard/2496…
Join telegram for more such screeners t.me/Techno_charts
• • •
Missing some Tweet in this thread? You can try to
force a refresh

