No, it's not a bubble in tech stocks. We are less than 1 standard deviation from the trend. You can see what a bubble looks like in the late 1990's when we exploded out of the decade long log regression channel to be multiple SD's from trend.
Nothing to see, move on... 1/
Nothing to see, move on... 1/

Also, "But P/E ratio's are at bubble valuations!" narrative doesnt take into account the fact the during debasement the P rises (due to debasement) more than E (anchored by GDP growth in general). If debasement is 11% and GDP is 2% trend over same period then P/E rises by 9% p.a
This means that P/E ratio's double over 8 years or so. Its the denominator effect.
Also BTC is less than 1SD from trend. It usually hits 2 SD.
Also BTC is less than 1SD from trend. It usually hits 2 SD.

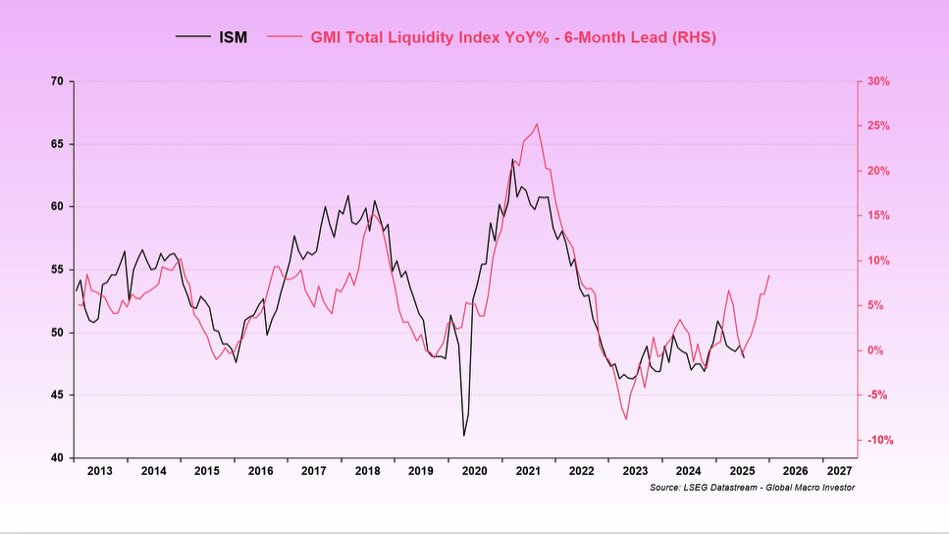
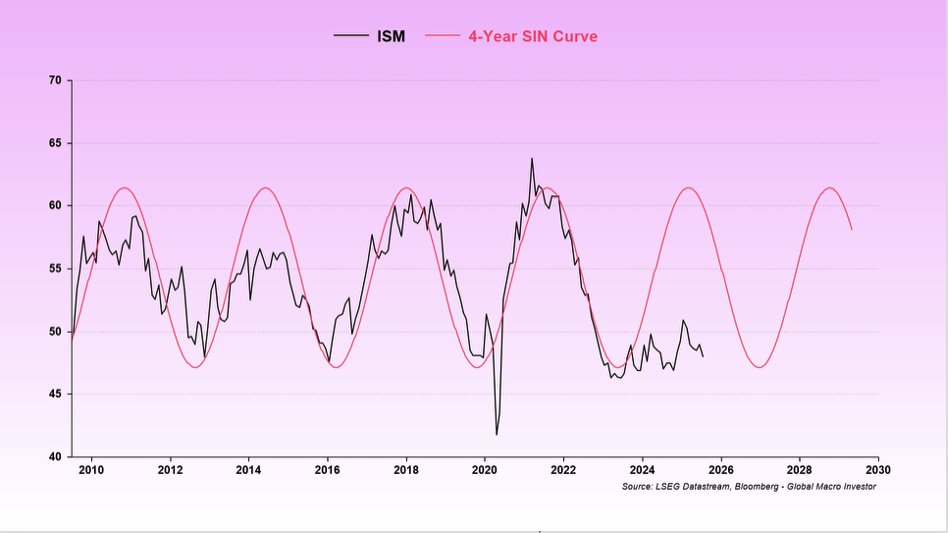
This is driven by the ISM (business cycle) being lacklustre so far....

Which in turn is driven by less need to add liquidity in the US due to most debts extending to 5 yrs and needing to be rolled over next 12 months...($10trn)

Thus the bulk of liquidity is delayed and forward looking indicators suggest it lies ahead...financial conditions gives us a 3 month lead....
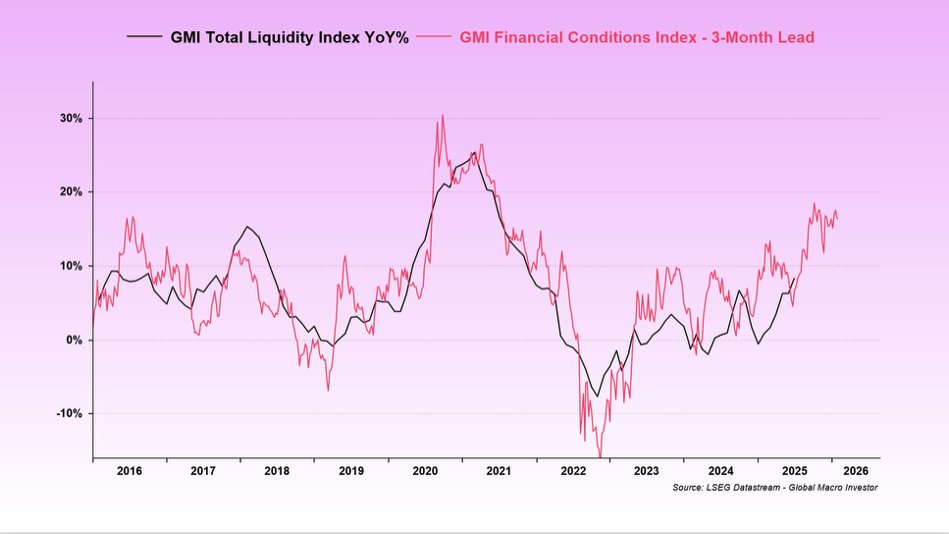
And that in turn leads ISM...
And that all drive number go up... NDX has a slight premium currently but that is normal at this phase.

And BTC usually decouples to the upside too at this point in the cycle...
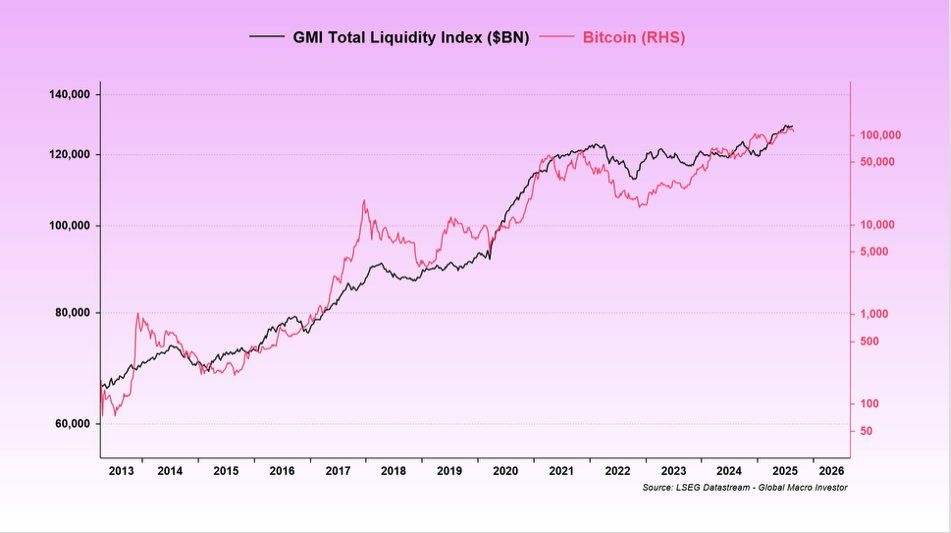
NDX, which you call a bubble has a a correlation of 96% (and BTC 90%)

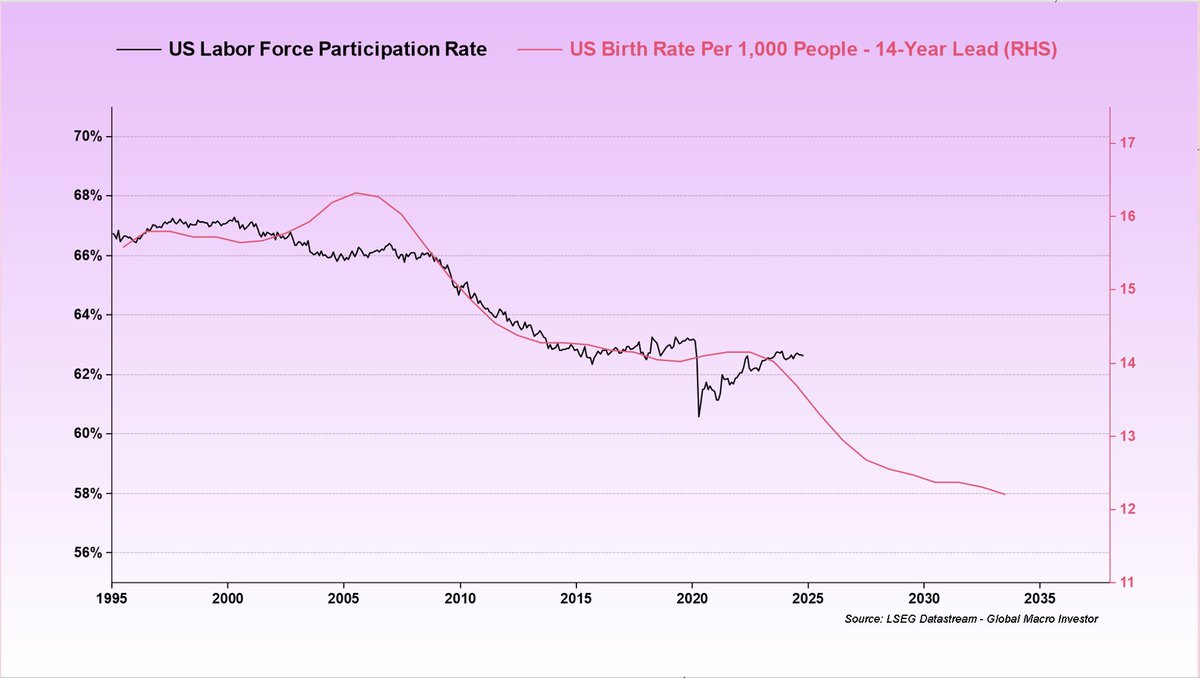
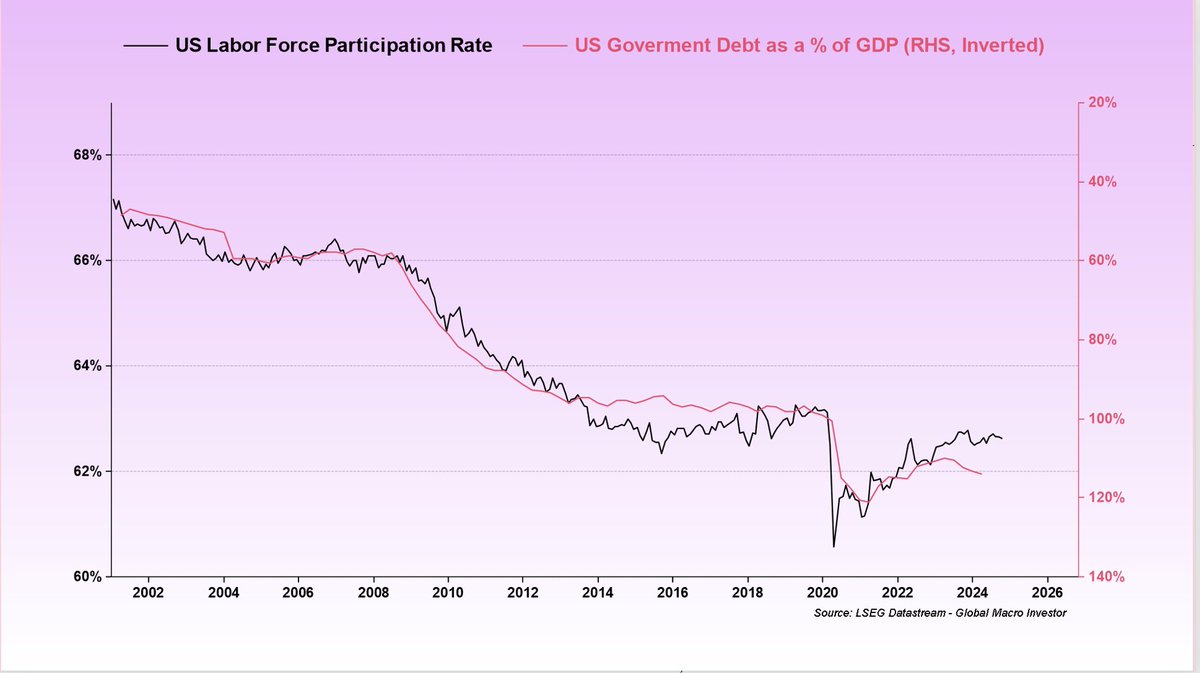
Which makes total Global Liquidity the most dominant macro factor maybe in the history of markets. This is driven by demographics which drives debt...
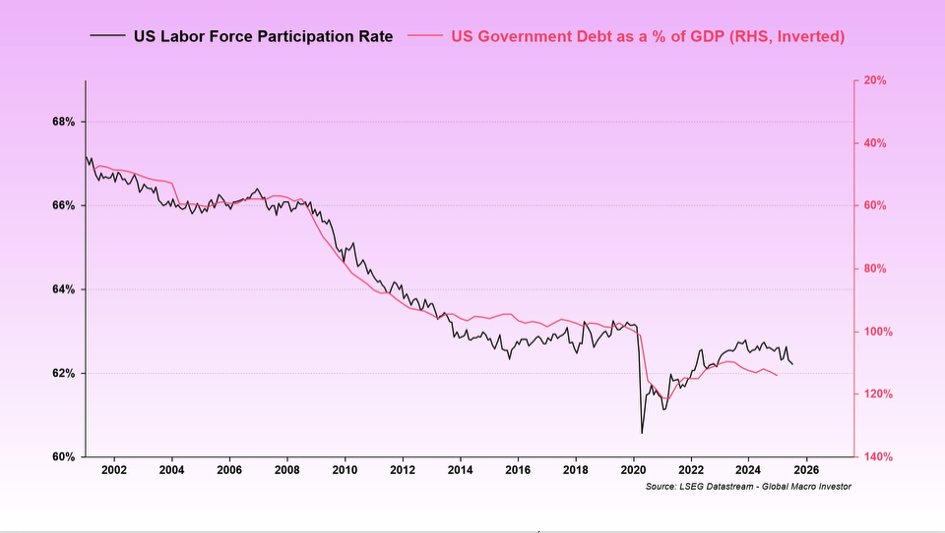
And debt drives liquidity via debasement...
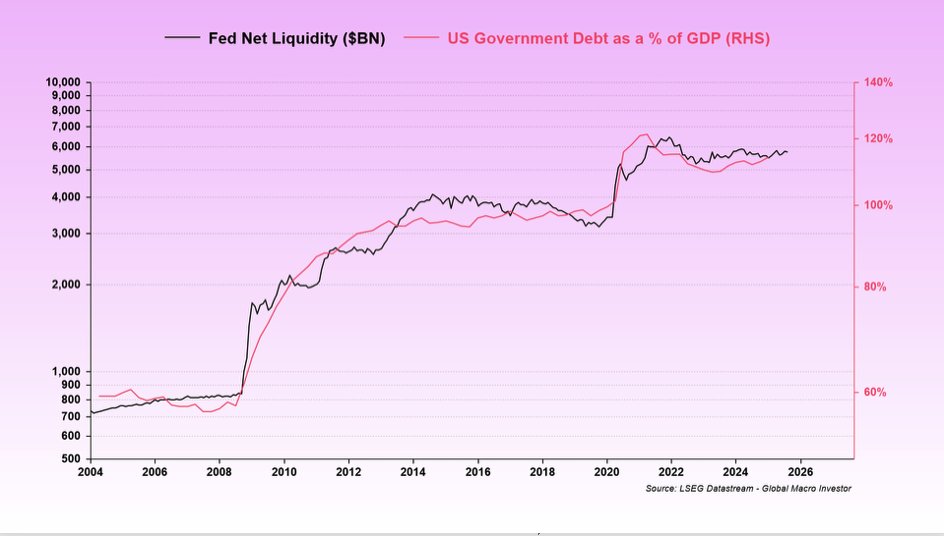
BUT, this is not just a US game. Back in 2017, the Fed were raising raises, doing QT and t Fed Net Liquidity was flat but China and the UK drove total global liquidity, which meant number go up.
Total Global Liquidity is THE game. It is THE debasement of fiat...
Total Global Liquidity is THE game. It is THE debasement of fiat...
But this time in the US rates are too damned high and that means we really need to allow liquidity to fill the void...

And to us, that is why the cycle is lacklustre thus far...because 2025 was not the year of the big debt roll over...thank you Covid for allowing avg maturity to be lengthened by a year as rates hit zero..
So, probabilistically speaking, things have shifted...

I am fully aware that "this time is different" is a powerfully dangerous sentence but our view at GMI is that it is not different, it is the same because the cycle is based on debt maturity.
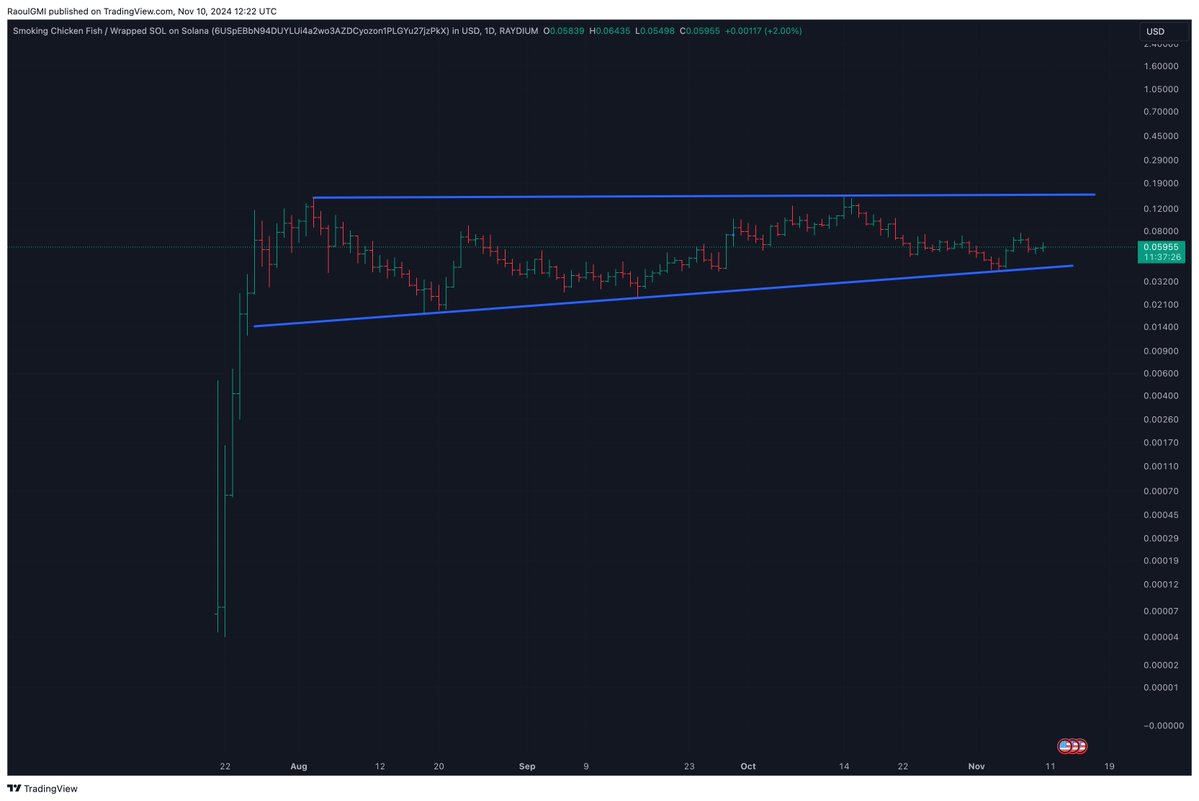
Still, taking lifestyle chips off into a strong rally to new highs in ETH, SOL, SUI will hedge the risk of being wrong. I never go through the cycle with no exposure but instead prefer to compound and add when prices fall.
To me, it's all to play for. There are no bubbles.
To me, it's all to play for. There are no bubbles.
• • •
Missing some Tweet in this thread? You can try to
force a refresh