Most traders see the crash after it happens.
This thread shows how to spot market stress before it breaks, and how to tell if the damage is short-term or structural.
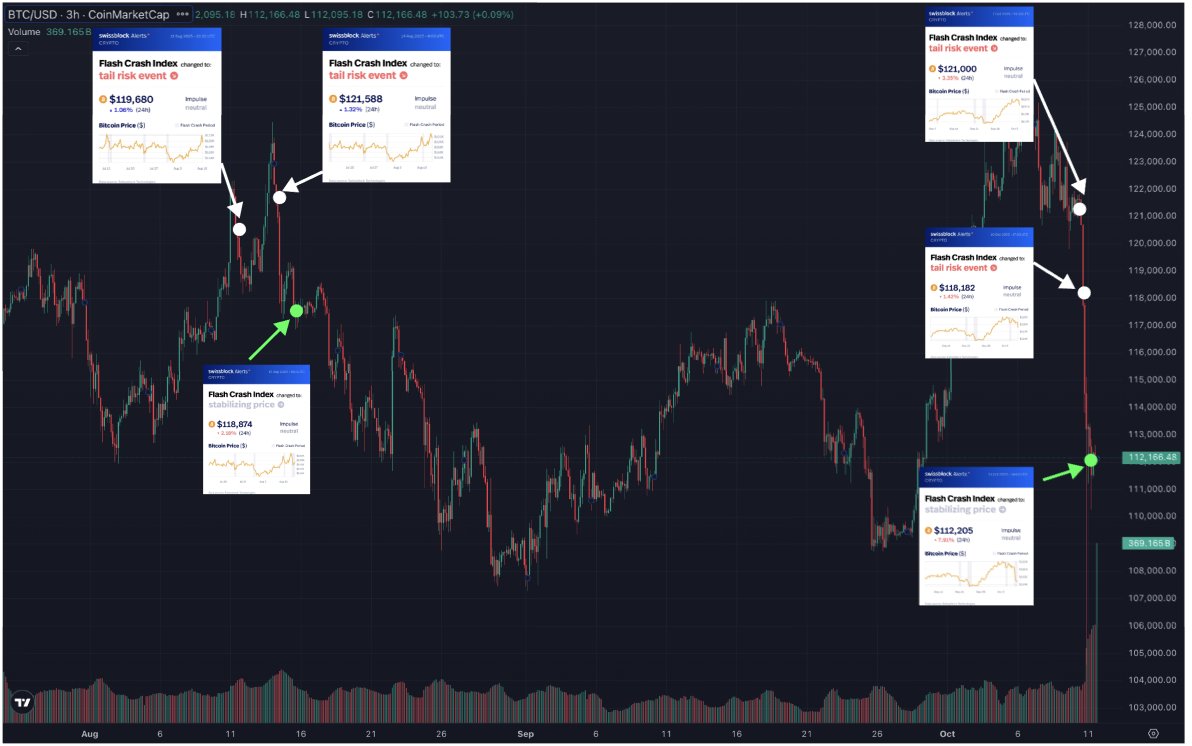
We’ll use two moments — the August ATH and yesterday’s selloff —to show how @bitcoinvector alerts reveal the structure beneath price.
🧵 Read this if you trade volatility ↓
This thread shows how to spot market stress before it breaks, and how to tell if the damage is short-term or structural.
We’ll use two moments — the August ATH and yesterday’s selloff —to show how @bitcoinvector alerts reveal the structure beneath price.
🧵 Read this if you trade volatility ↓
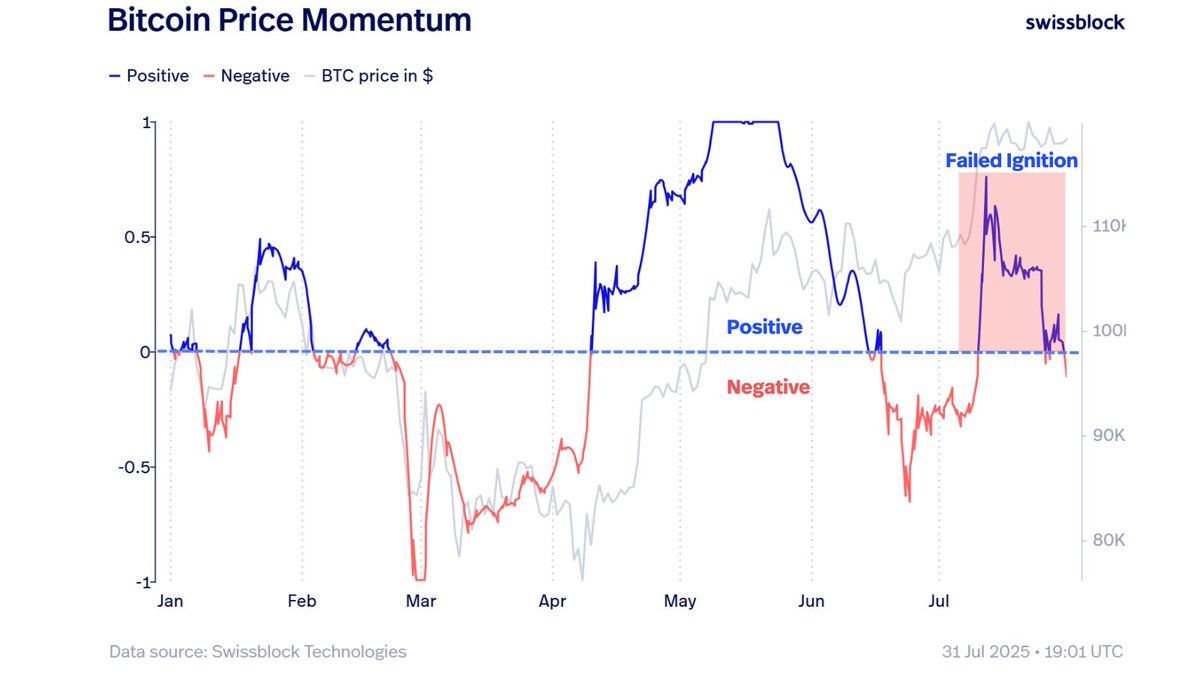
Local Stress (Flash Crash Alert)
Every breakdown begins quietly — as local stress.
⚪️The Flash Crash alert detects short-term volatility shocks before price collapses.
In both August and yesterday, these alerts fired hours ahead of the main move, mapping fast-building downside pressure while most of the market was still calm.That early signal is the first layer of protection.

Stabilization (When the Panic Ends)
After each selloff, @bitcoinvector tracks volatility compression to identify when sellers exhaust.
This triggers a “Stabilizing Price” phase 🟢 — showing when local stress fades and the market resets. It helps you know when to pause and when to re-enter — avoiding false recoveries that trap reactive traders.
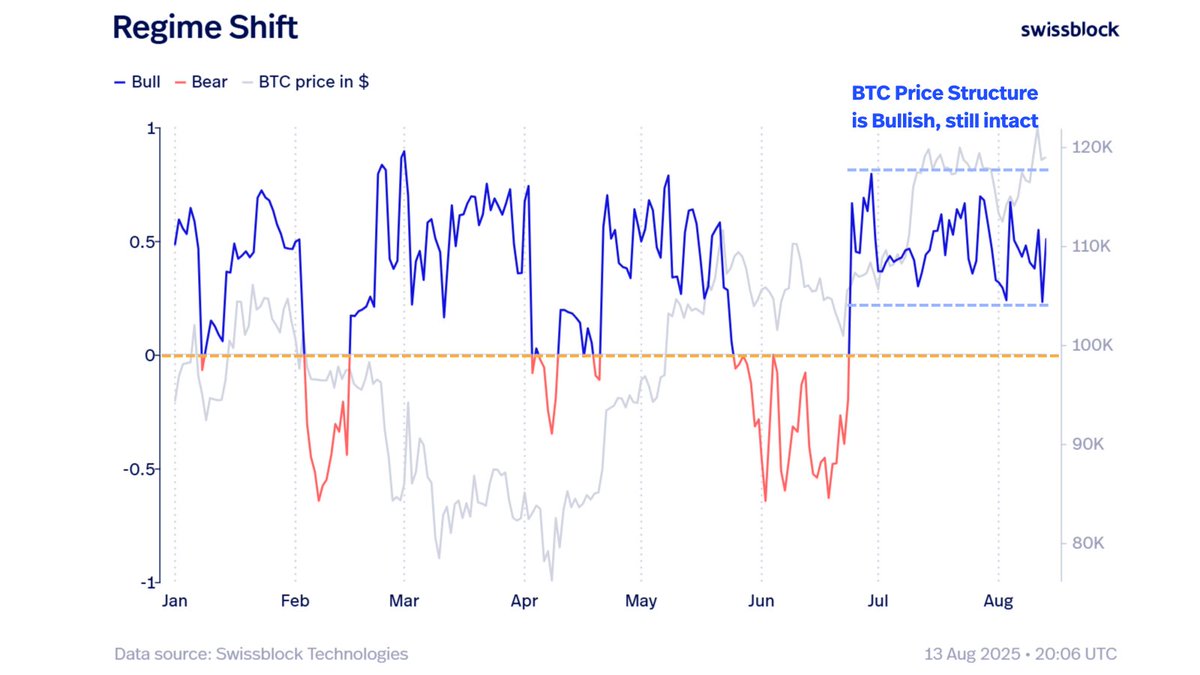
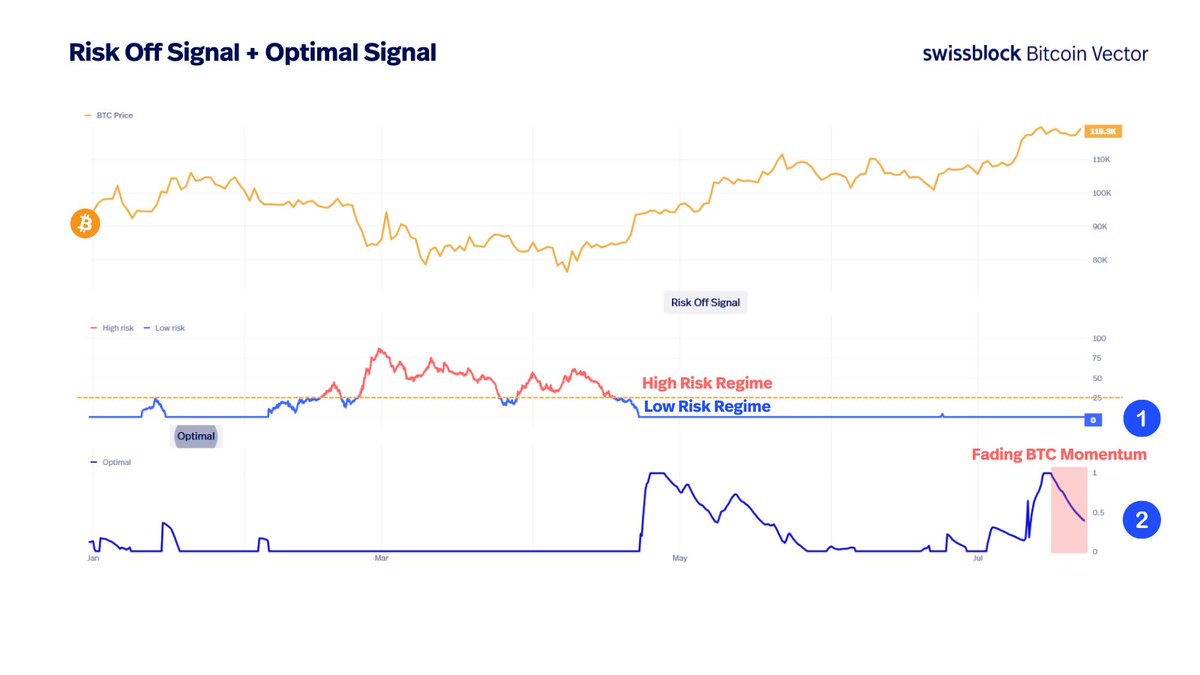
The key question: Was it just stress — or a structural breakdown?
In the chart 👇
(1) Regime Shift Signal → volatility skew flips bearish — first sign of structural change.
(2) Risk-Off Signal → confirms full systemic deterioration — liquidity contraction and prolonged downside risk.
• August ATH: both (1) + (2) triggered → full structural breakdown.
• Yesterday: only (1) → stress elevated, but not systemic yet.

The difference between reaction and anticipation is structure.
@bitcoinvector Advanced gives you the same alerts that identify stress before the crowd sees it —
from Flash Crash triggers to Regime Shift and Risk-Off transitions.
Stay informed. Stay positioned. Stay ahead.
🔗 Join here → swissblock.net/products/repor…
@bitcoinvector Advanced gives you the same alerts that identify stress before the crowd sees it —
from Flash Crash triggers to Regime Shift and Risk-Off transitions.
Stay informed. Stay positioned. Stay ahead.
🔗 Join here → swissblock.net/products/repor…
• • •
Missing some Tweet in this thread? You can try to
force a refresh