Swissblock Profile picture
Pioneering the next investment frontiers, block by block @bitcoinvector @altcoinvector https://t.co/FzuBsdcsZQ
Oct 11 5 tweets 2 min read
Most traders see the crash after it happens.

This thread shows how to spot market stress before it breaks, and how to tell if the damage is short-term or structural.

We’ll use two moments — the August ATH and yesterday’s selloff —to show how @bitcoinvector alerts reveal the structure beneath price.

🧵 Read this if you trade volatility ↓ Local Stress (Flash Crash Alert)

Every breakdown begins quietly — as local stress.

⚪️The Flash Crash alert detects short-term volatility shocks before price collapses.

In both August and yesterday, these alerts fired hours ahead of the main move, mapping fast-building downside pressure while most of the market was still calm.That early signal is the first layer of protection.Image
Aug 13 6 tweets 2 min read
With #BTC and #ETH on the verge of marking new all-time highs.

BTC’s price structure remains bullish and intact, despite the early August downside pressure.

The question: is there enough strength to break higher? 👇Image 
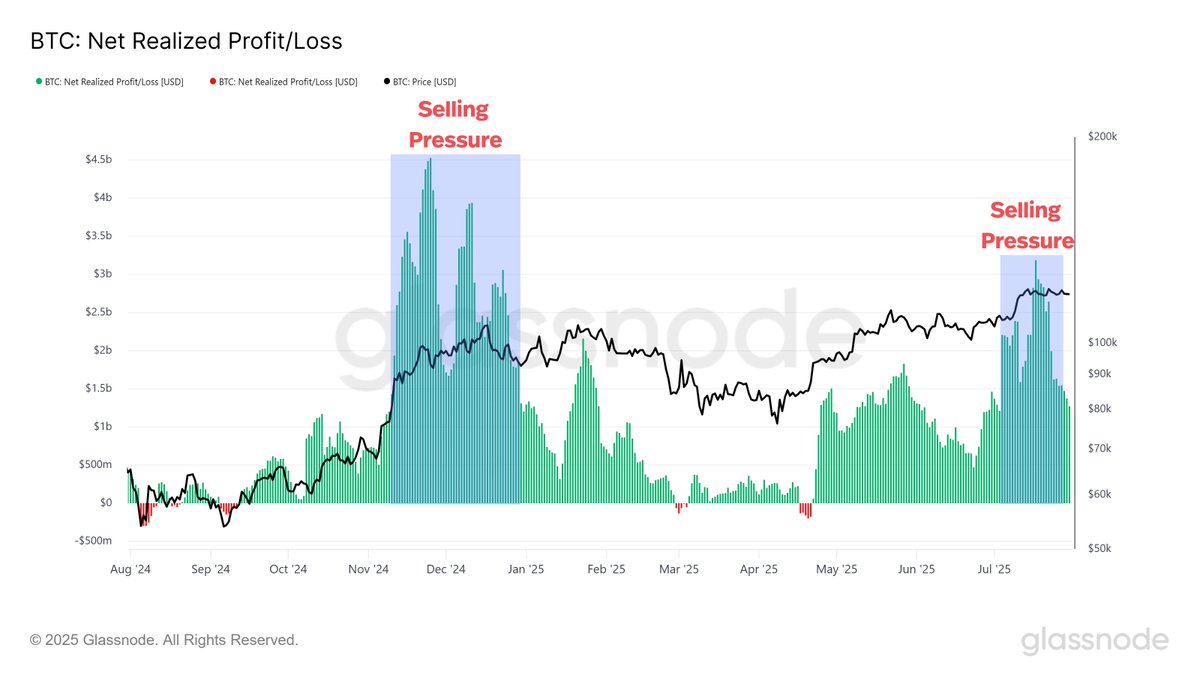
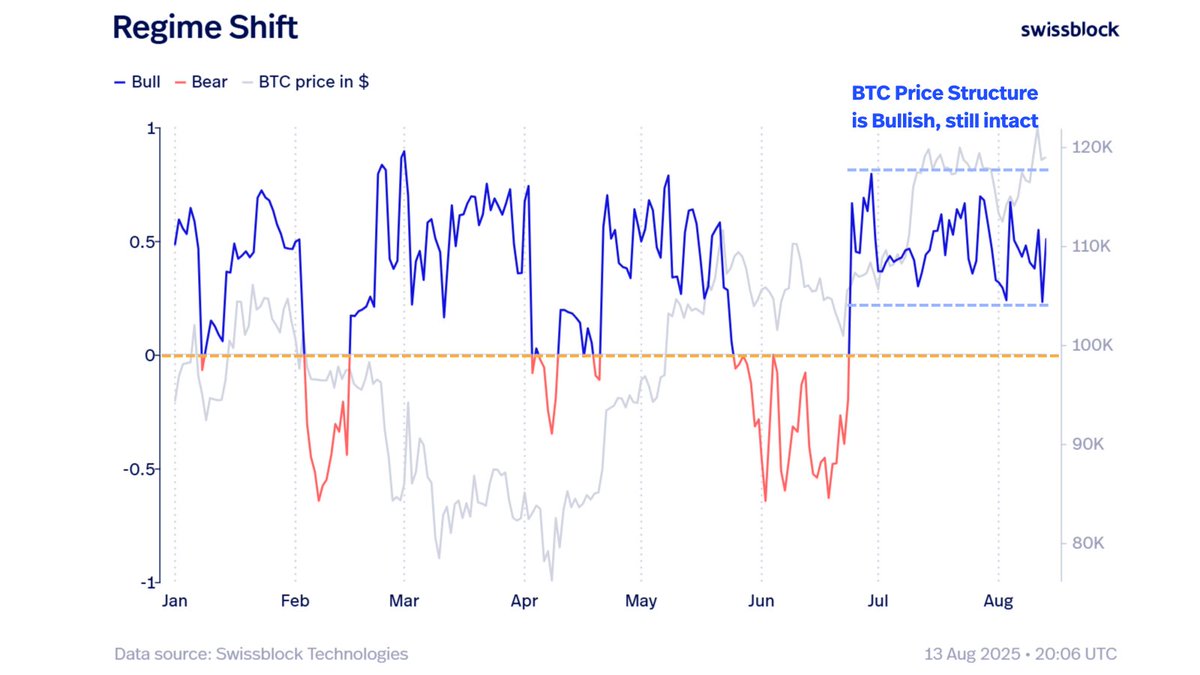
BTC is fundamentally strong, backed by solid on-chain metrics.

It’s in a state of bullish vitality, but one key driver is missing: increasing liquidity, with fresh capital inflows lagging new market participants.Image
Jul 31 6 tweets 2 min read
What’s going on with Bitcoin?

Momentum has failed to ignite.

$BTC attempted to break higher—but the rally stalled above $118K, and momentum flipped back to negative.

Are we in a failed breakout zone?

Let’s break it down 🧵Image 
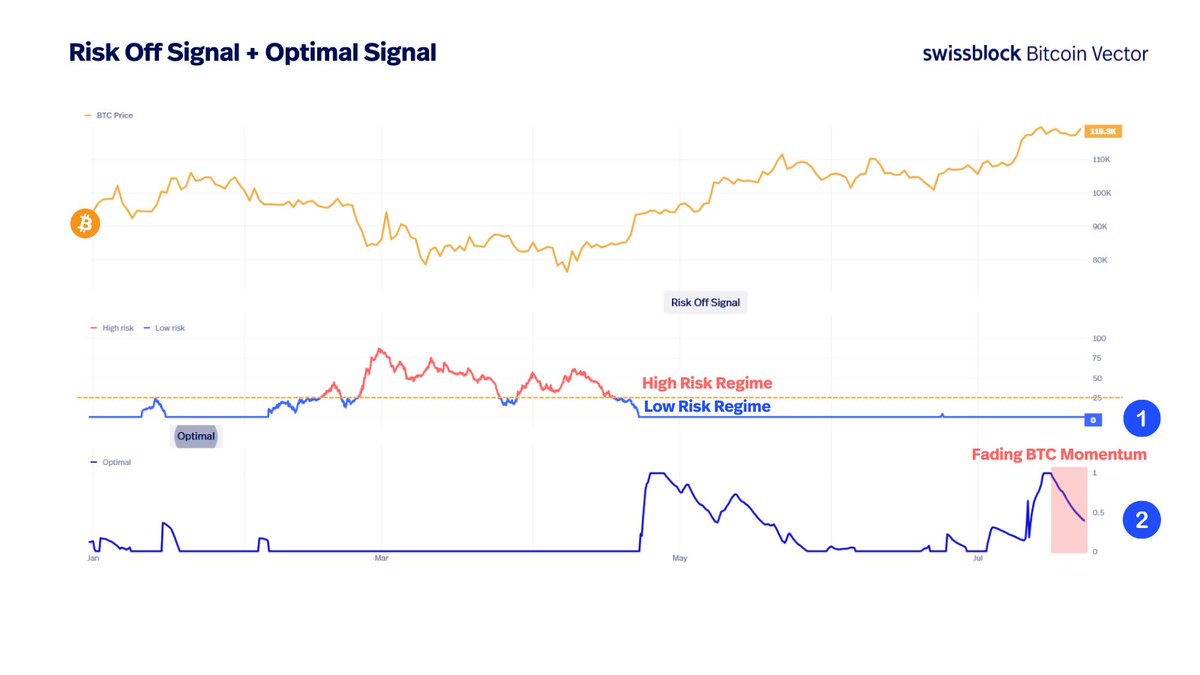
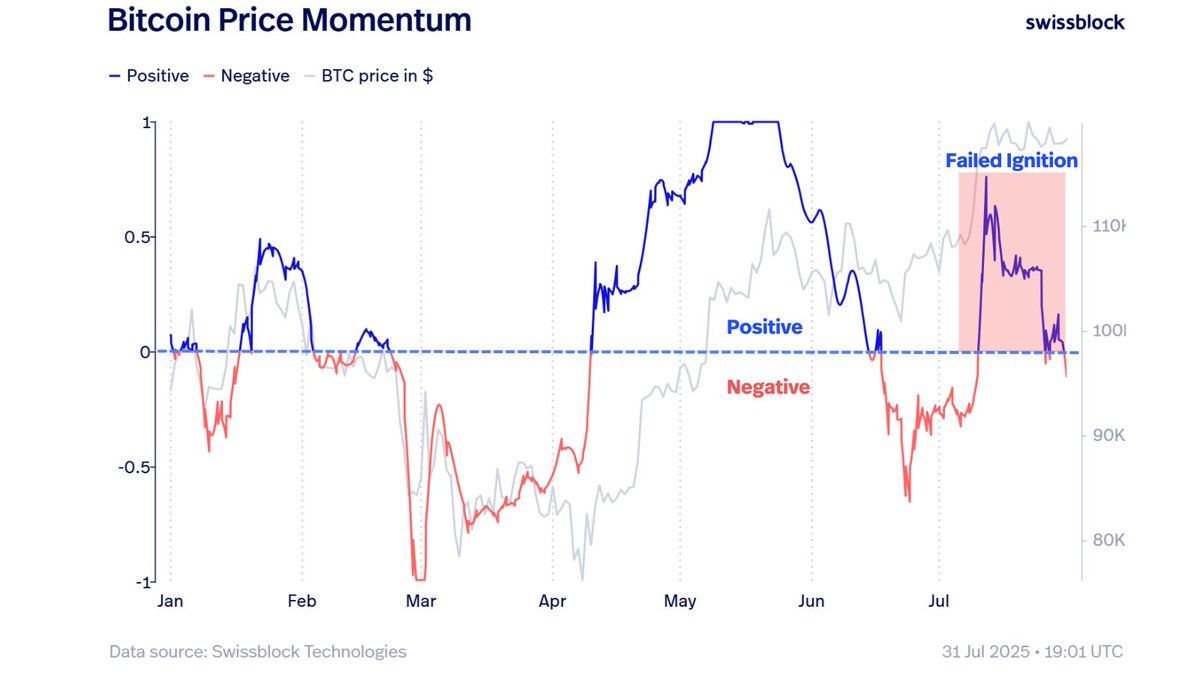
Why is momentum stalling?

Profit-taking is rising—but not as intense as late 2024.
Realized profits grew during July, enough to cap upside and trigger consolidation.

Selling pressure is visible, but not extreme—think cooling, not capitulation.

Chart from @glassnodeImage
Jul 22 7 tweets 2 min read
The ultimate breakdown of Bitcoin’s positioning:

Structure, momentum, risk, fundamentals, and market rotation.

Here’s what’s building beneath the surface — and why the cycle isn’t over, it’s evolving. Chart via @bitcoinvector

Fundamentals are solid: new participants and liquidity have entered the system.

This supports the mid-term bullish case.
But in the short term, buyers are DCA’ing or waiting for volatility or confirmation.

Jun 24 4 tweets 2 min read
ETH is playing catch-up, and the setup couldn't be clearer (Part 1).

🔹We're entering a phase where capital rotation into Ethereum—and altcoins—has historically triggered explosive upside.

Let’s break down the data 🧵 Green Zones = Accumulation & Expansion Phases

Across all charts, we highlight 5 key green zones—moments where:

🔹ETH and BTC fundamentals aligned
🔹Supply in profit surged
🔹Capital rotated
🔹Alts exploded

ETH is now stepping into Zone 5, and the signs are familiar.Image