I removed everything from my system
removed indicators, removed complexity, removed the noise.
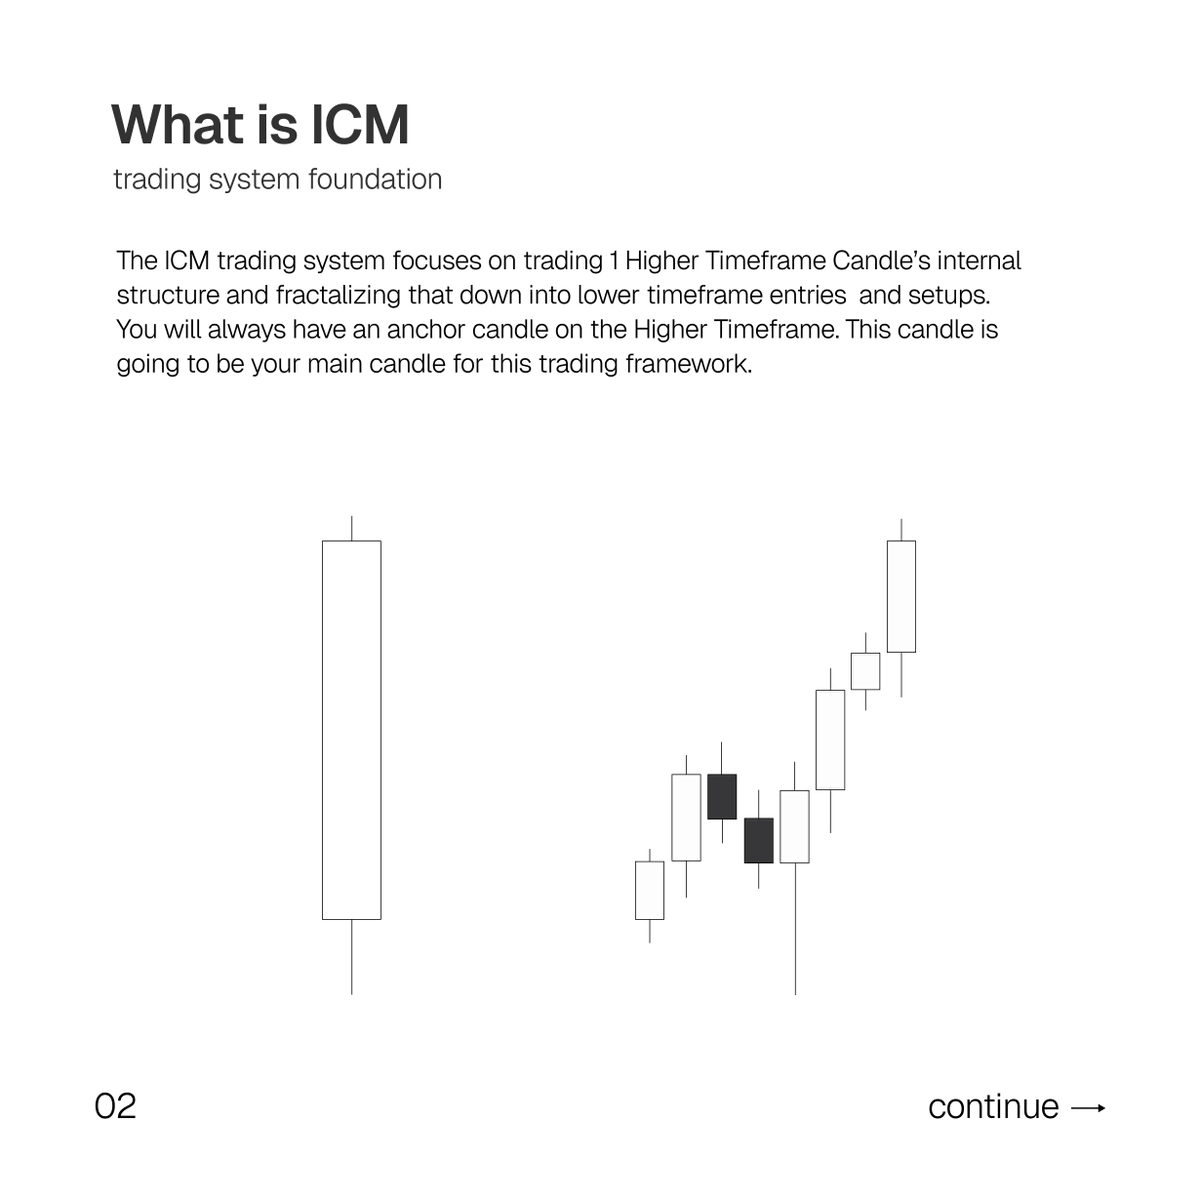
what's left? the ICM model
one candle
15 minutes per day
I made $70,000 in September alone trading just this model.
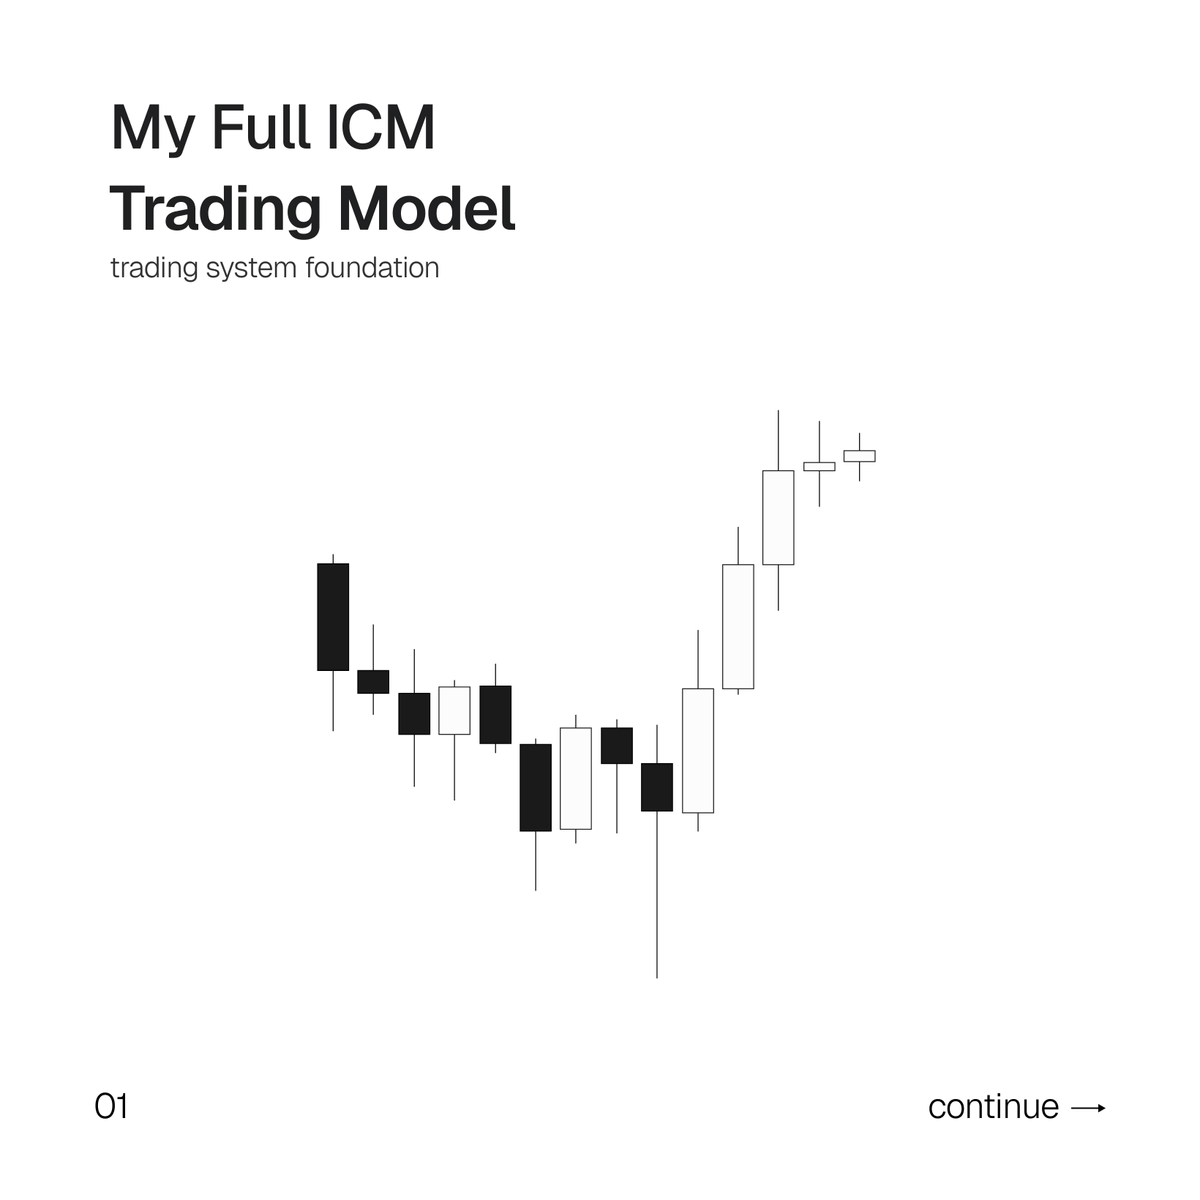
Here is my full ICM trading model🧵
removed indicators, removed complexity, removed the noise.
what's left? the ICM model
one candle
15 minutes per day
I made $70,000 in September alone trading just this model.
Here is my full ICM trading model🧵
the stages of the trading system:
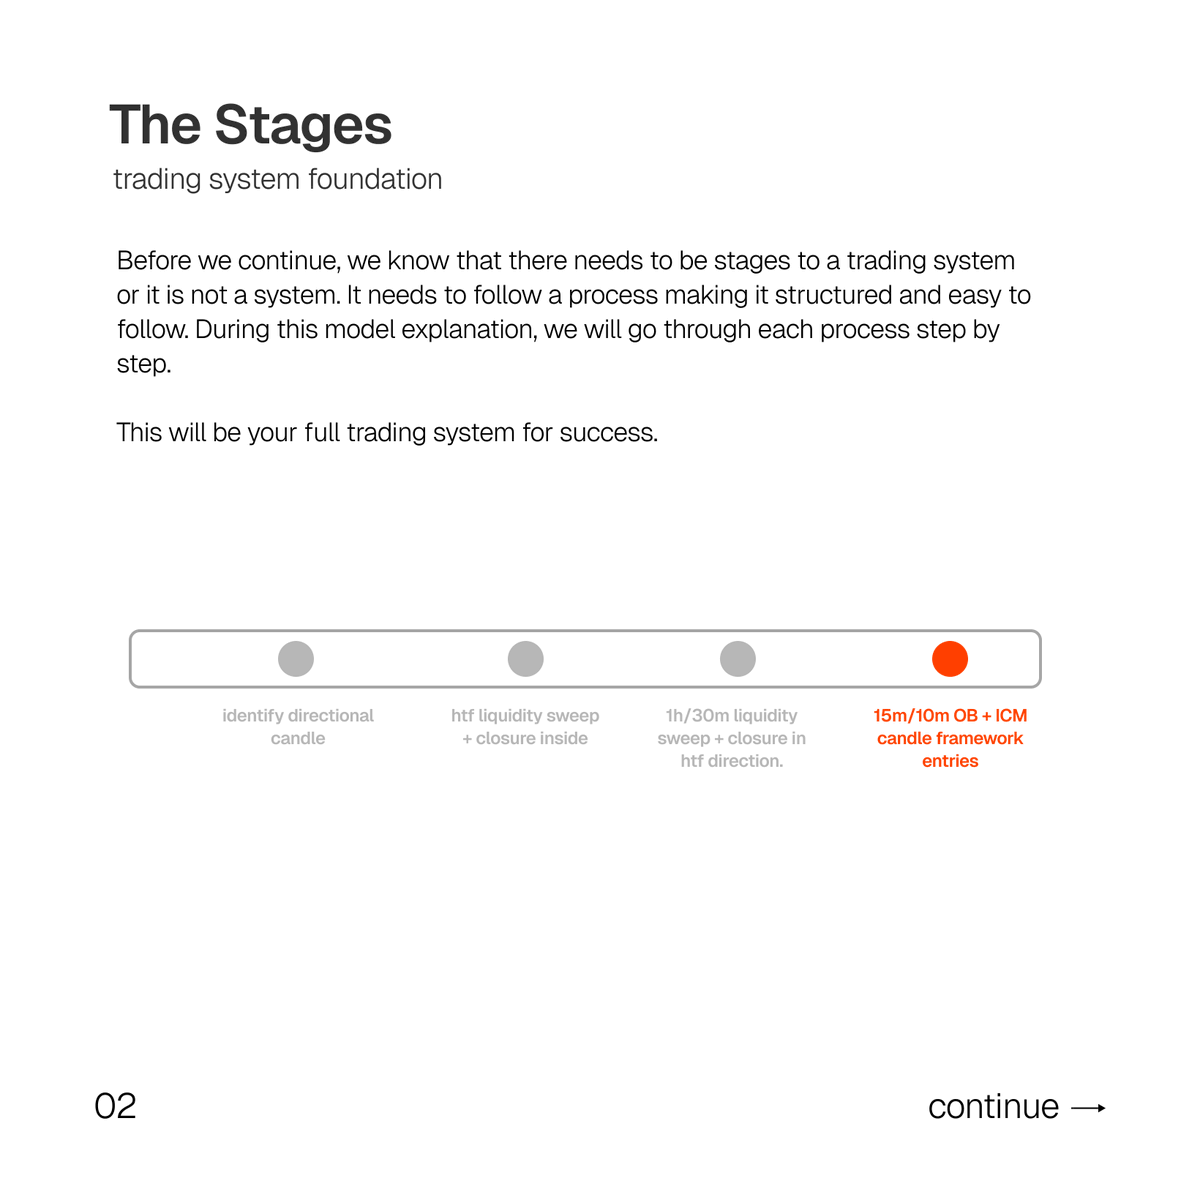
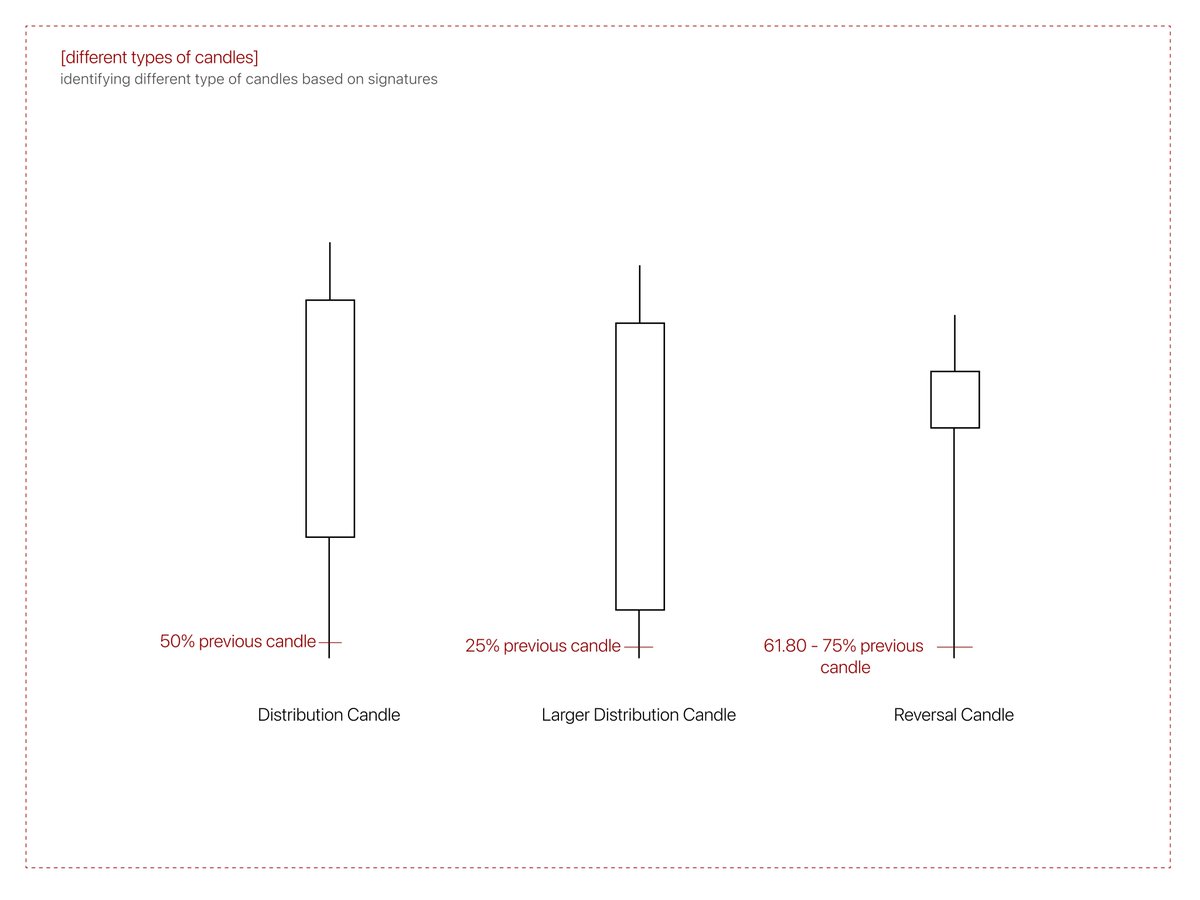
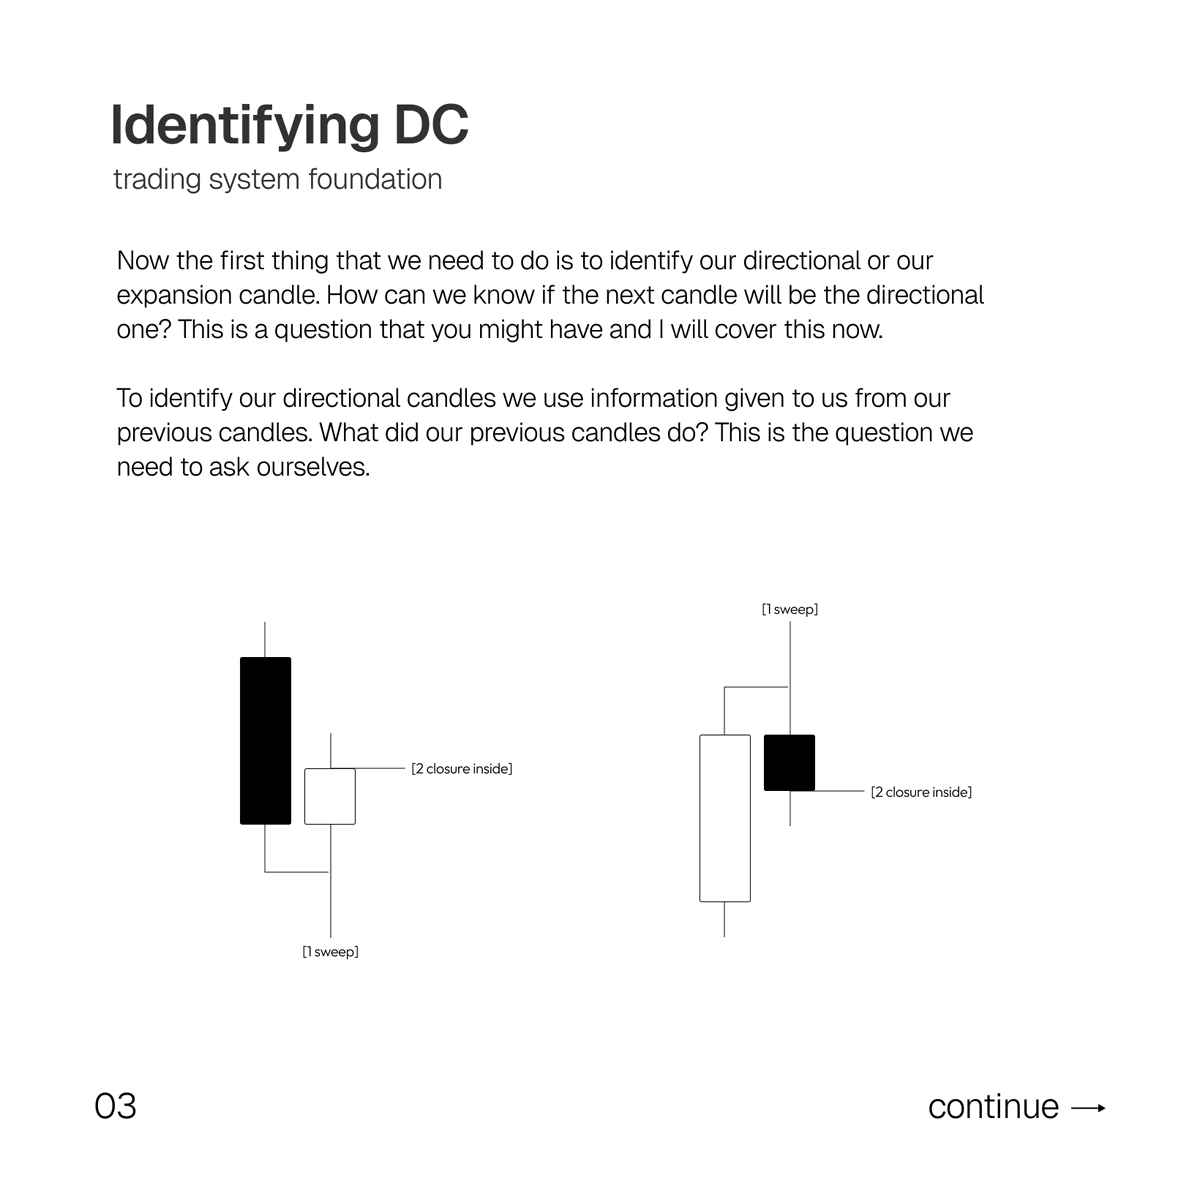
identifying distribution candles:
variable identification:

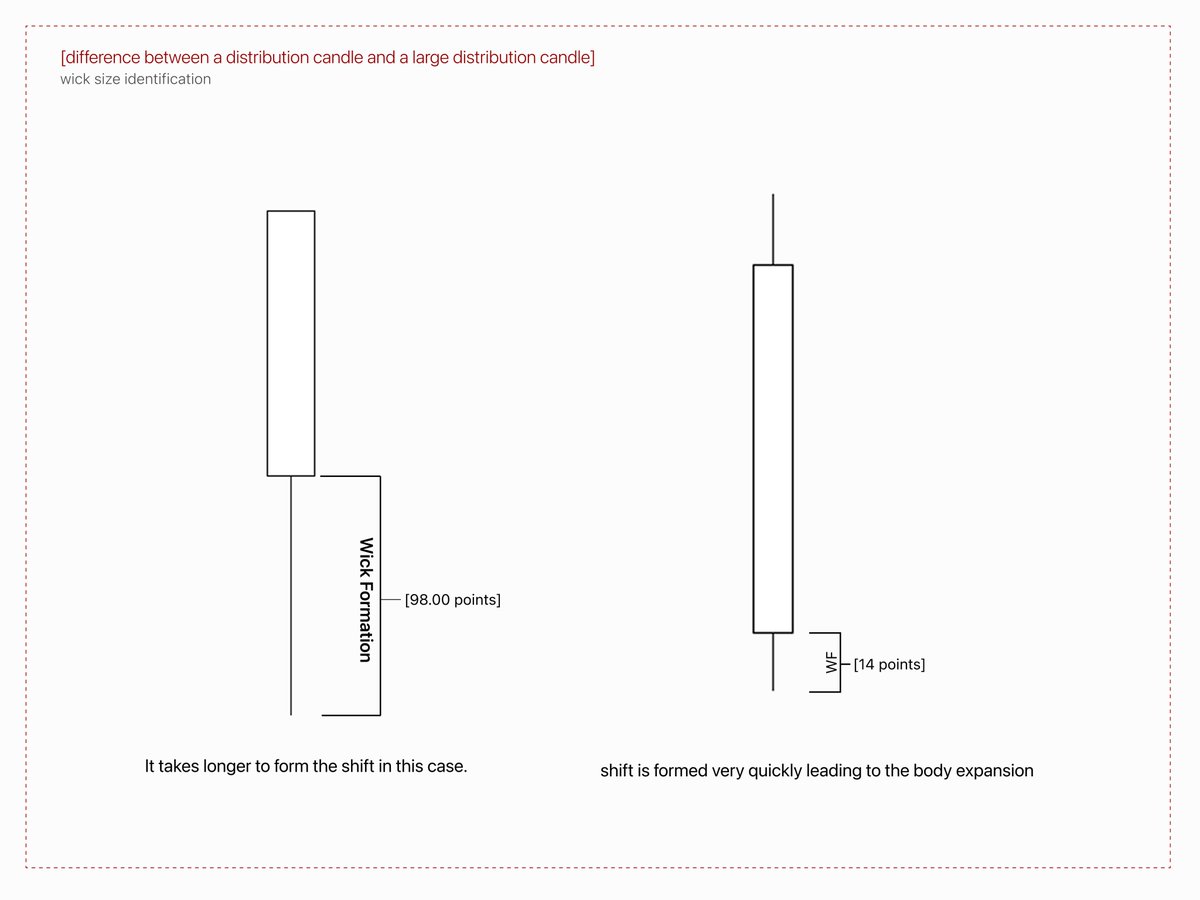
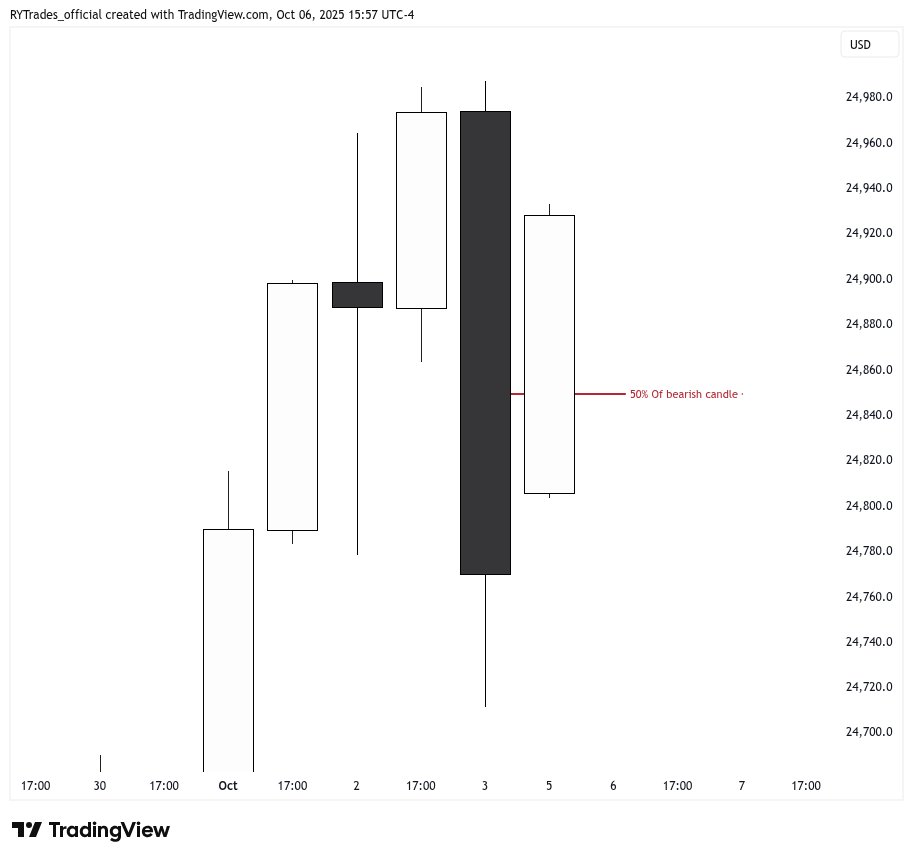
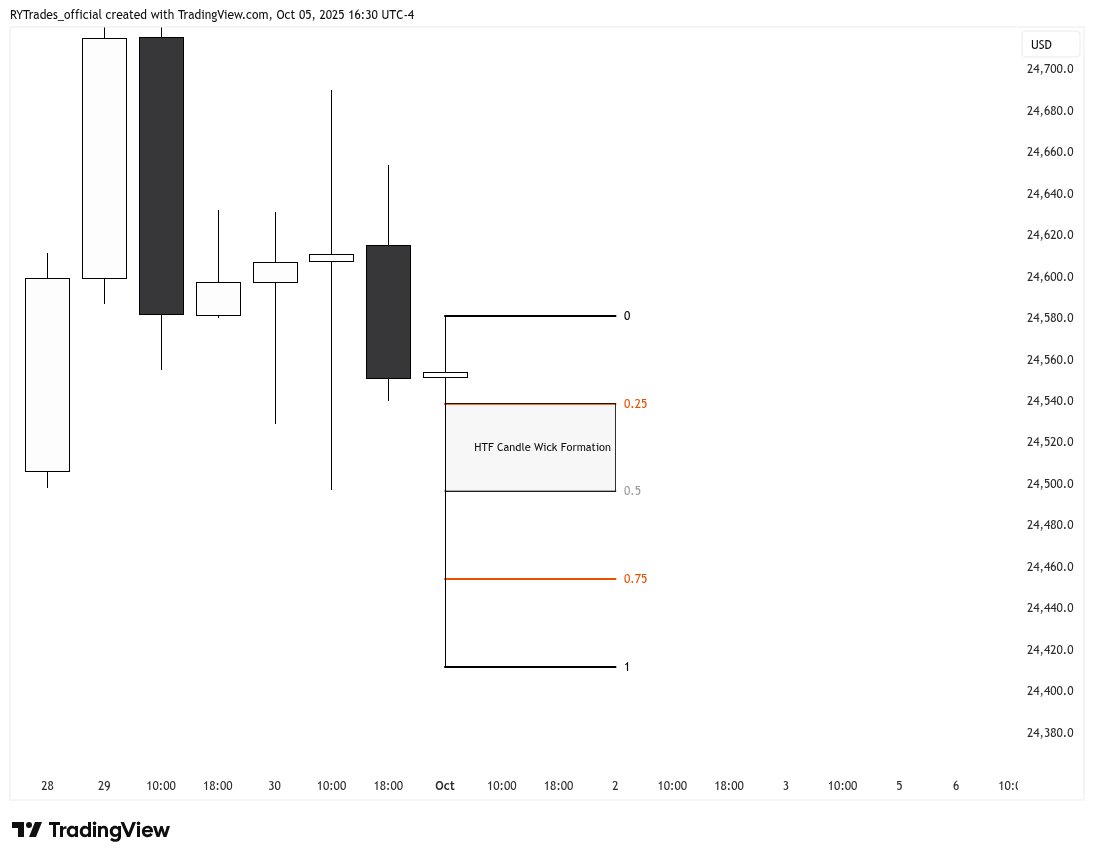
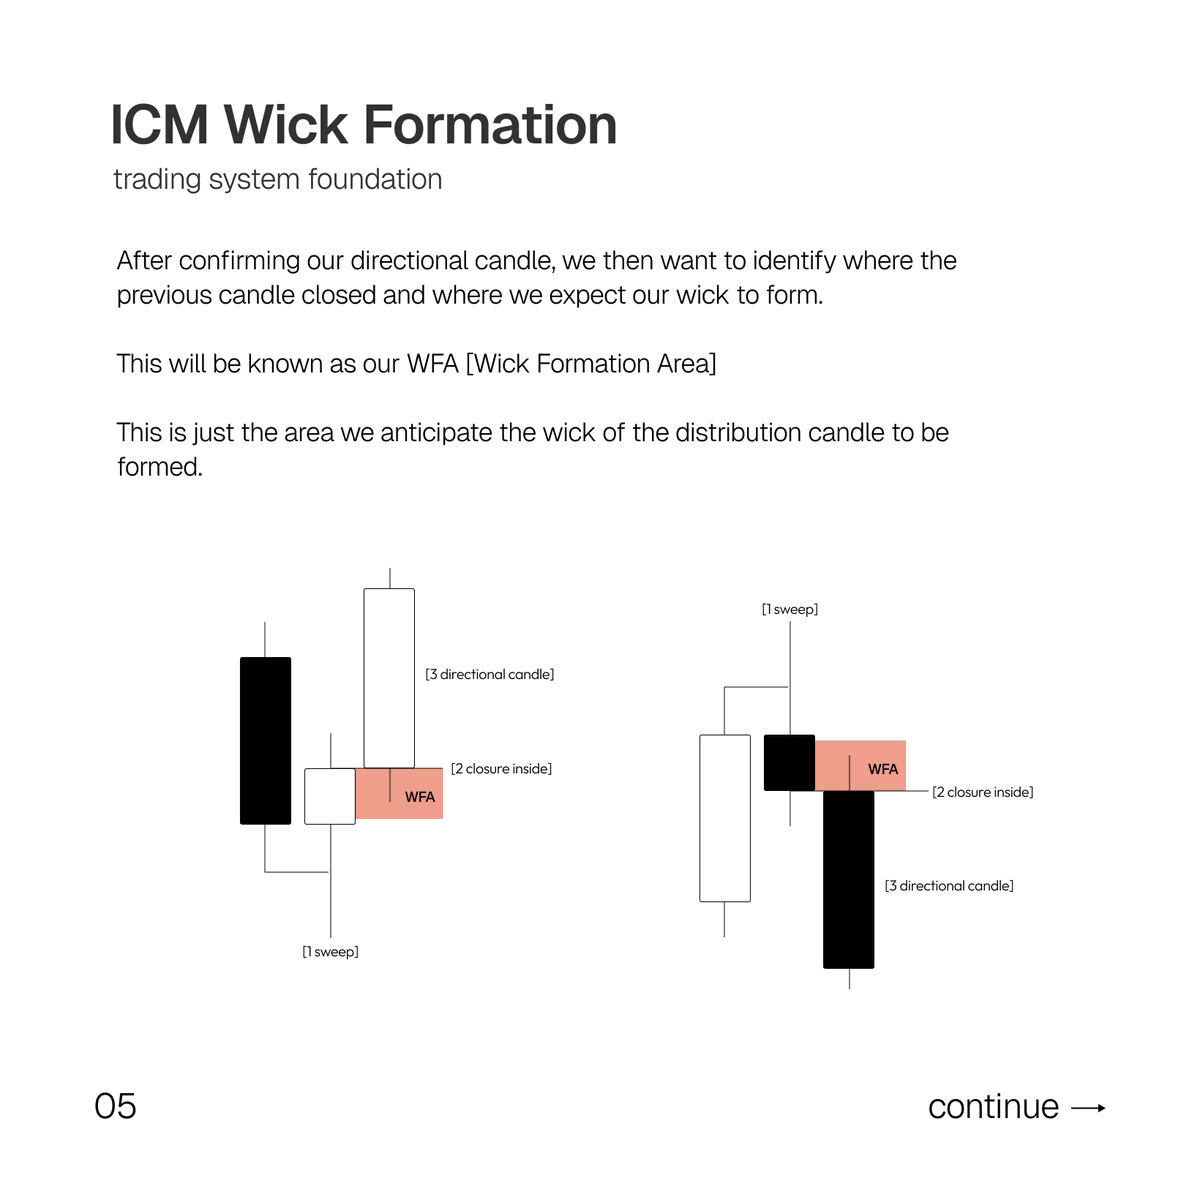
ICM wick formation framework:
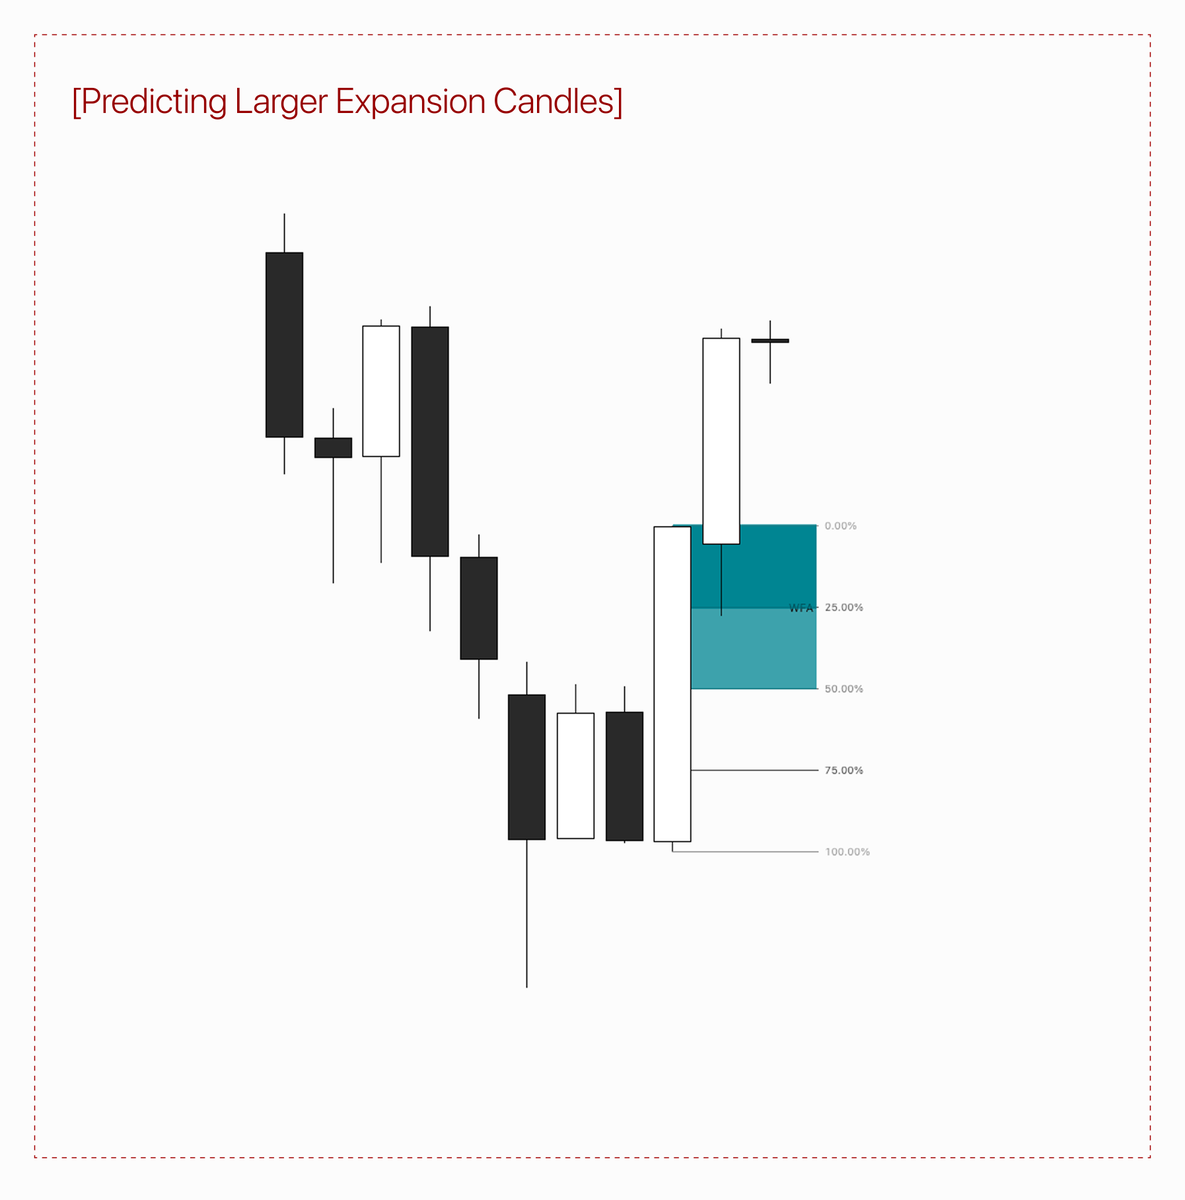
intermediate confirmation of HTF framework:

lower timeframe entry criteria [bullish]
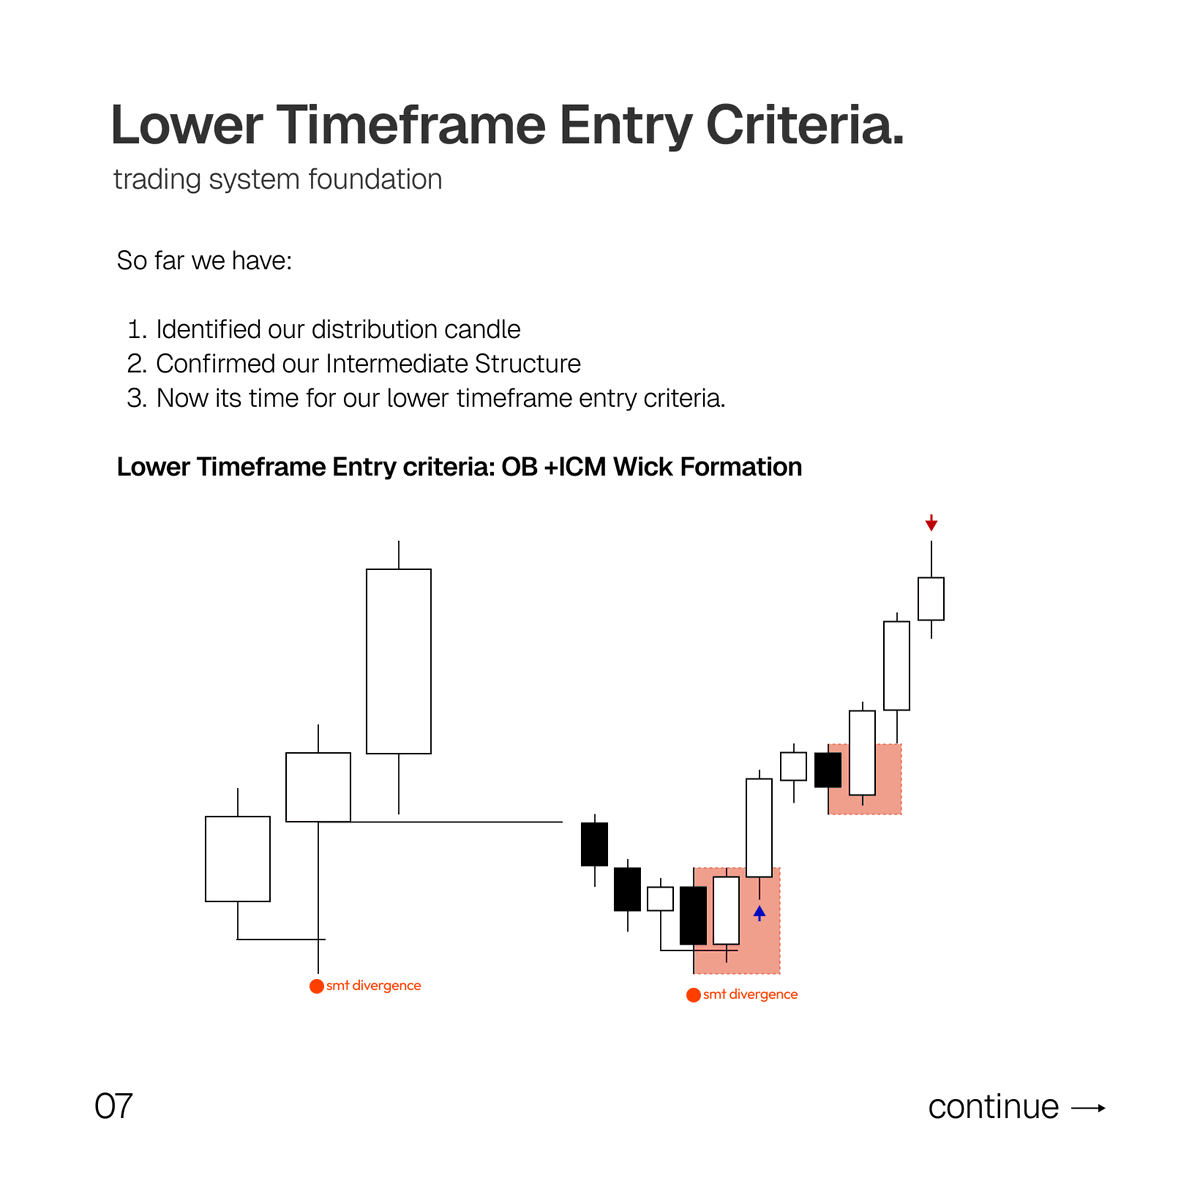
lower timeframe entry criteria [bearish]

conclusion:
make sure to follow if you want to see more of my model and how I implement it on a daily basis.
this model was created on a foundation of ICT + ICM and a few other concepts I learned in my years of trading.
you have done yourself a huge favor by reading, understanding and implementing this model. this is the simplest and fastest way to profitability.
hope you guys enjoy the read, feel free to share with others as well to help someone else.

• • •
Missing some Tweet in this thread? You can try to
force a refresh