RyTrades Profile picture
Oct 14 10 tweets 3 min read Read on X
I removed everything from my system

removed indicators, removed complexity, removed the noise.

what's left? the ICM model

one candle

15 minutes per day

I made $70,000 in September alone trading just this model.

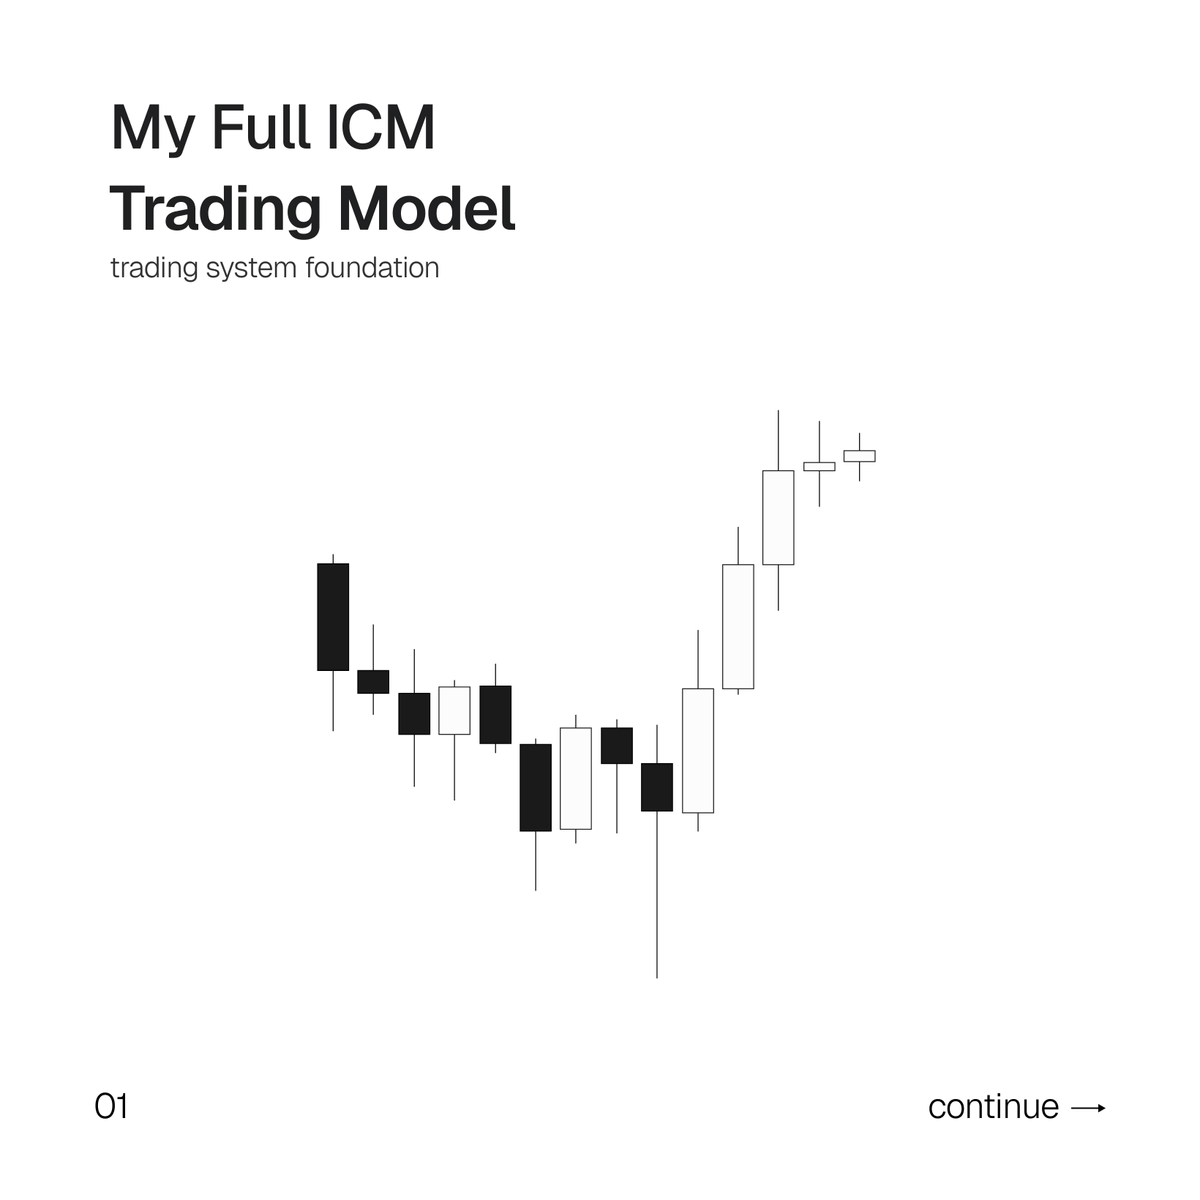
Here is my full ICM trading model🧵 Image
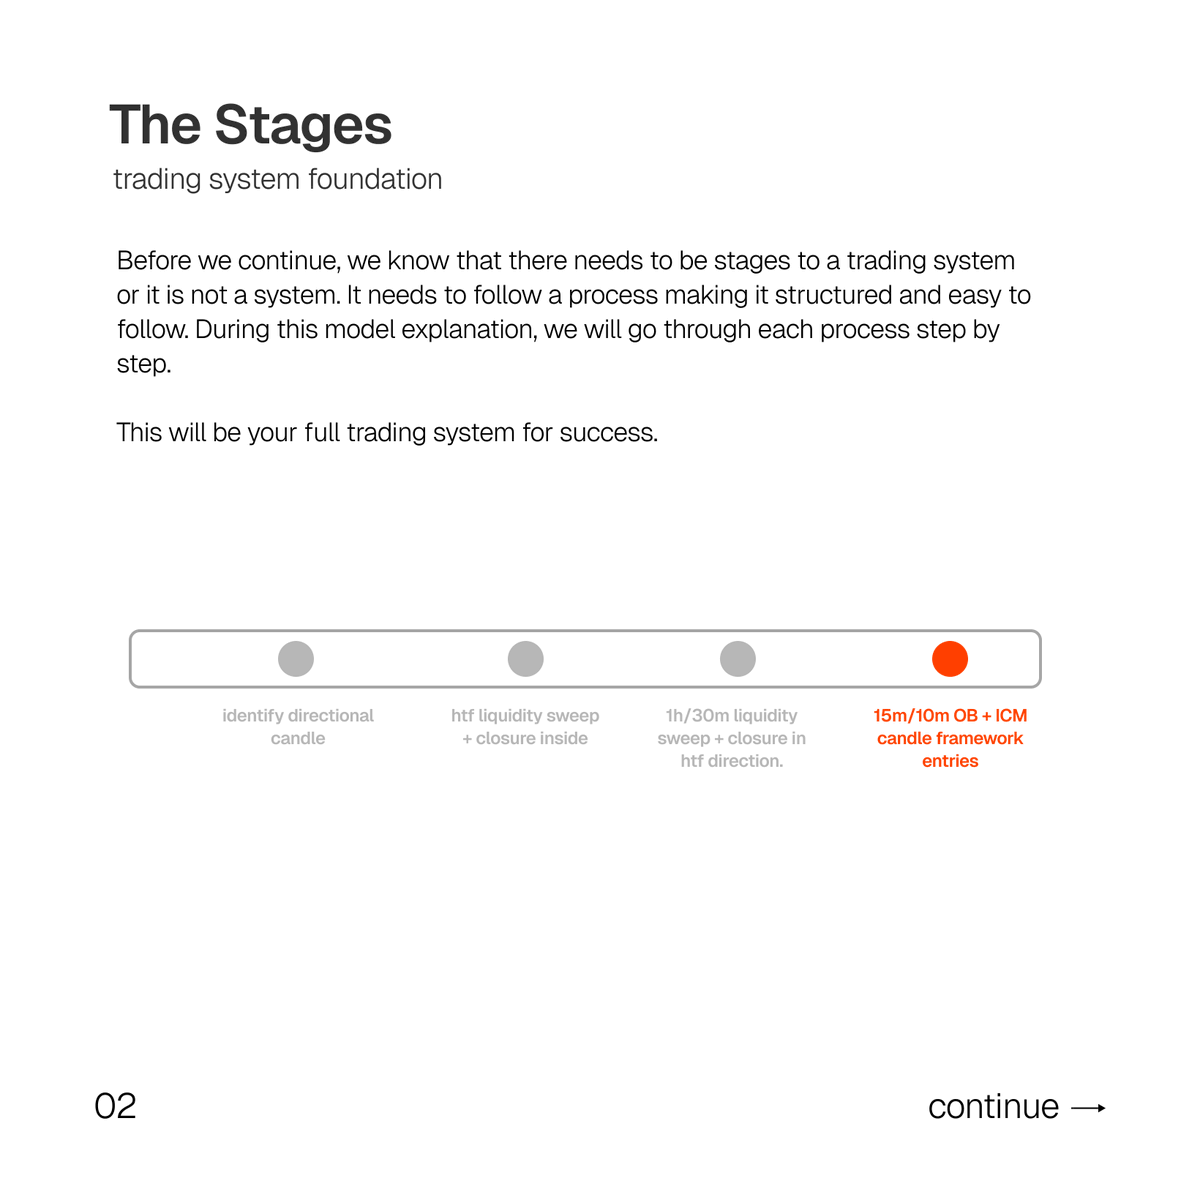
the stages of the trading system: Image
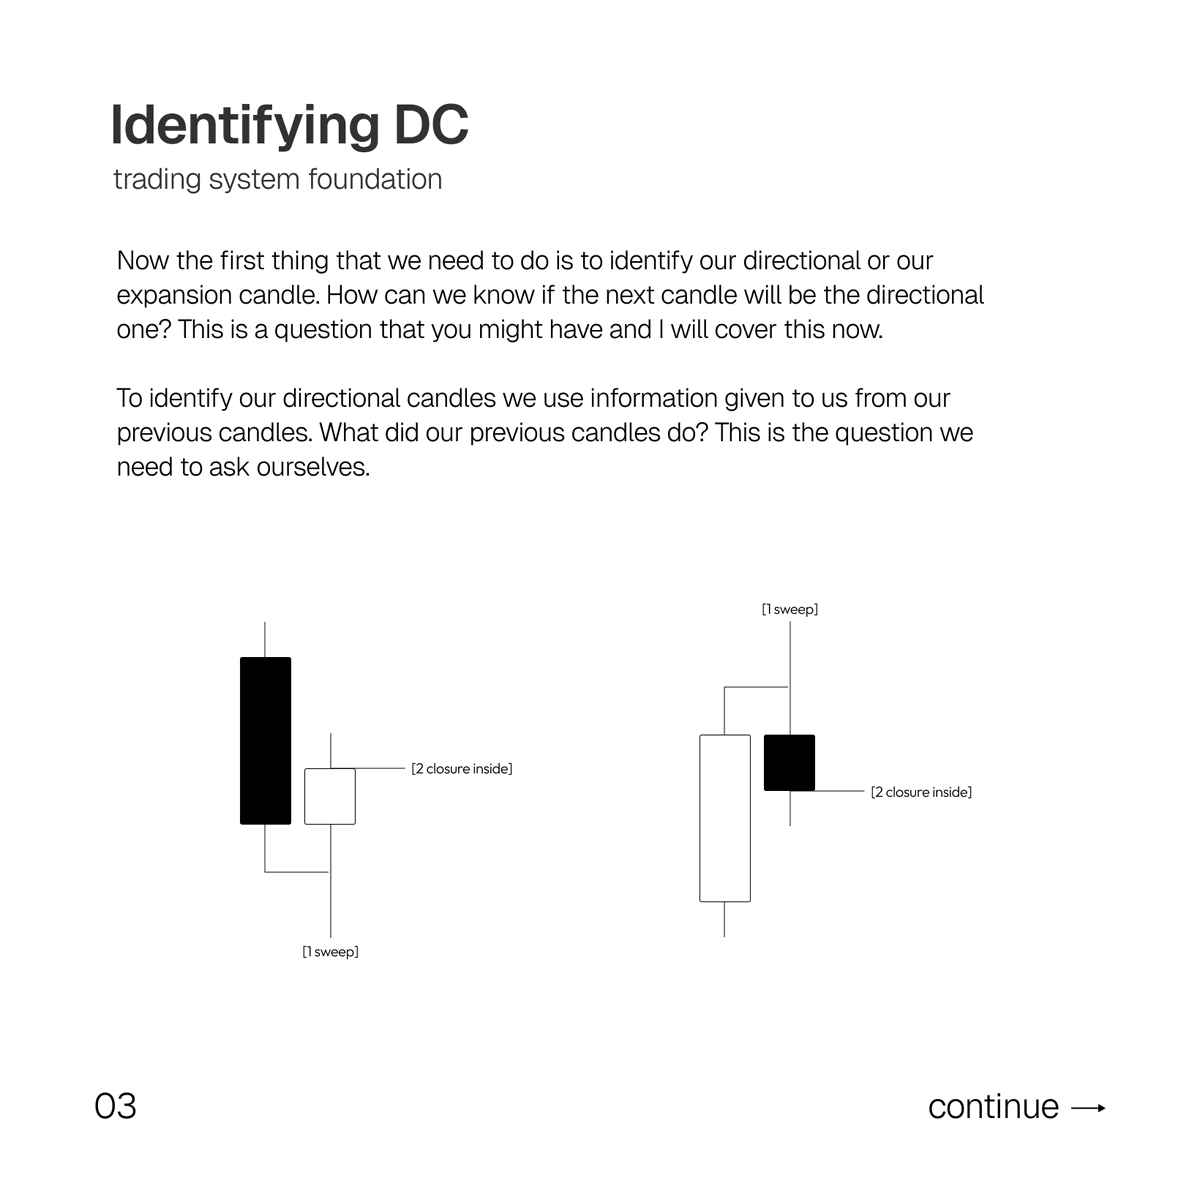
identifying distribution candles: Image
variable identification: Image
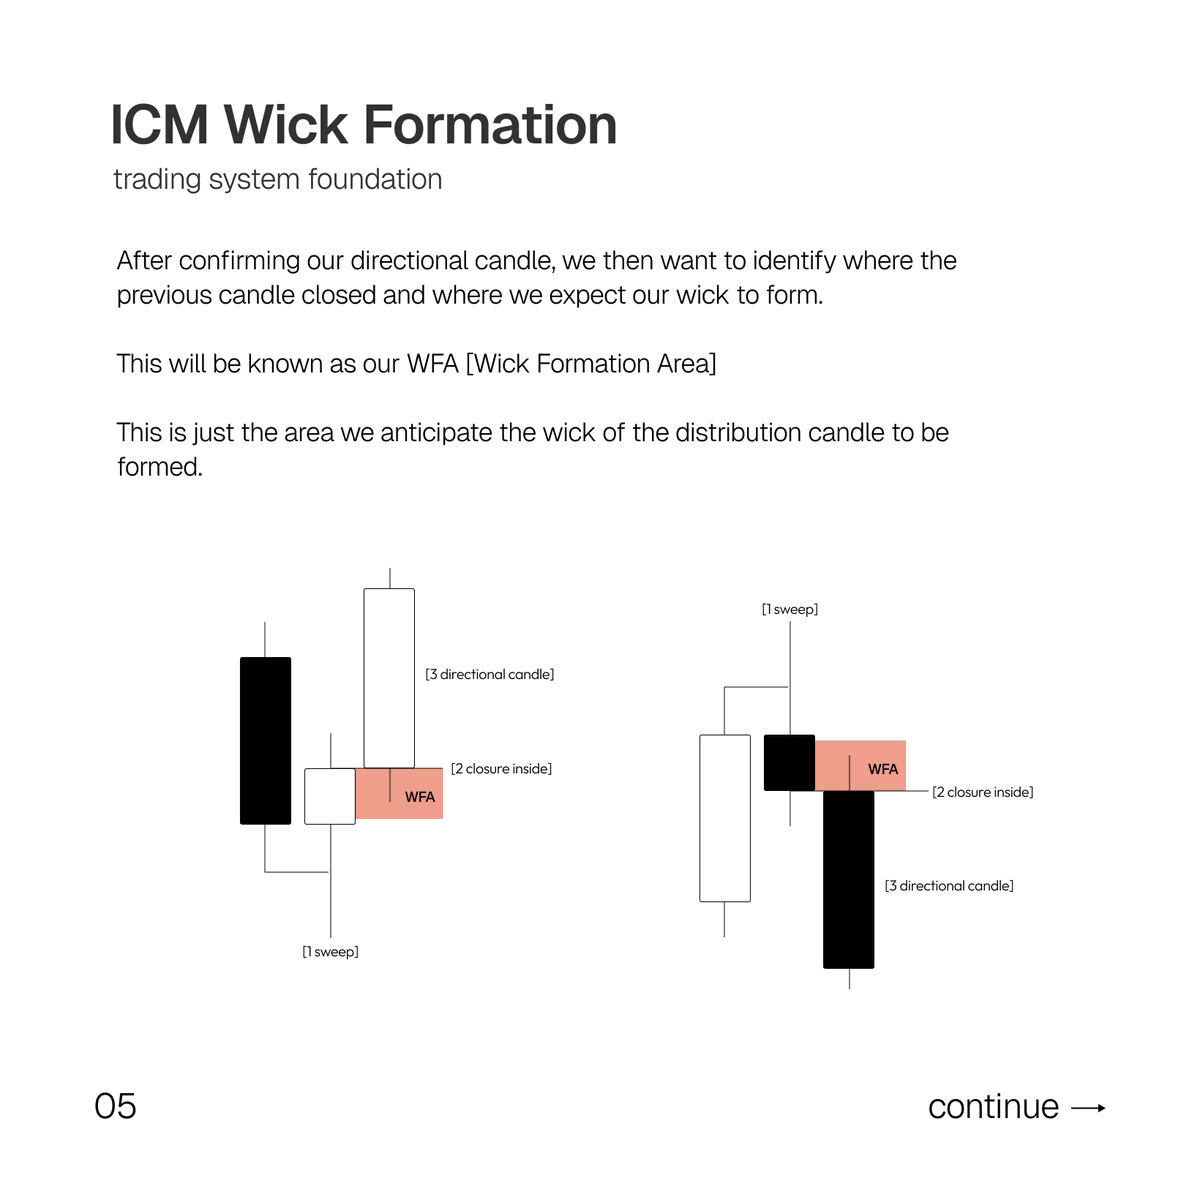
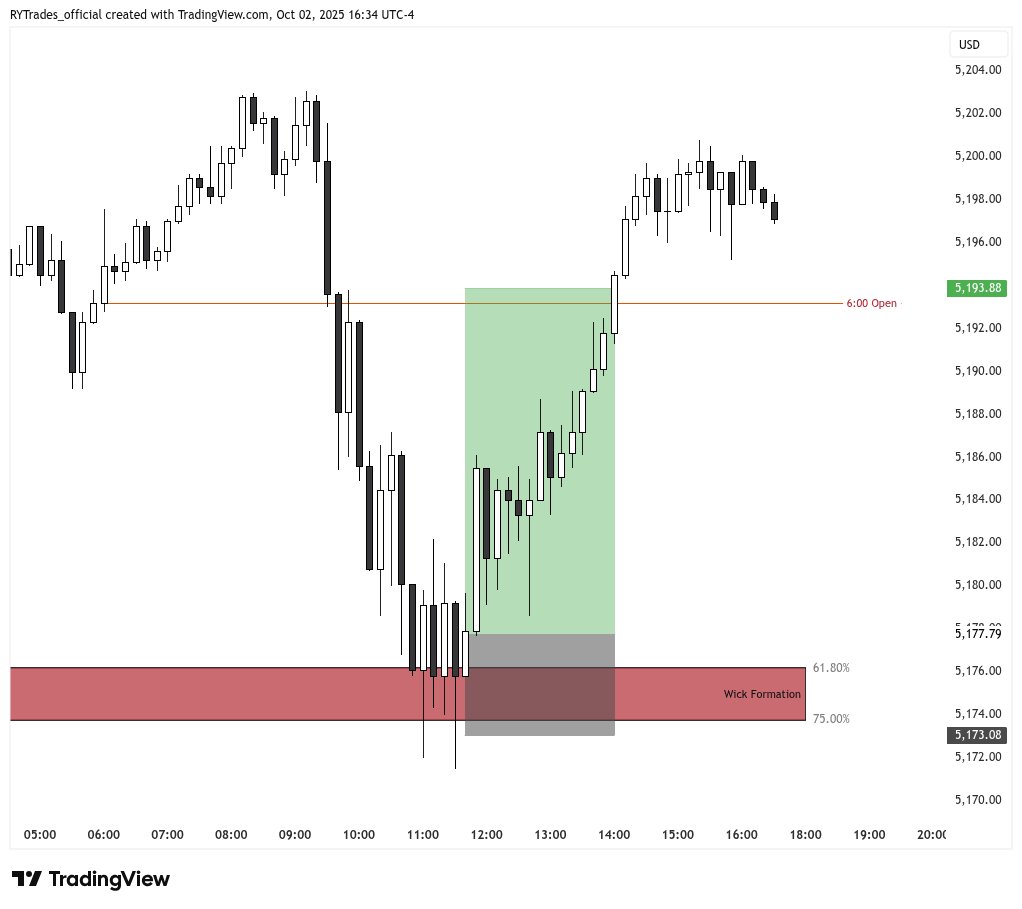
ICM wick formation framework: Image
intermediate confirmation of HTF framework: Image
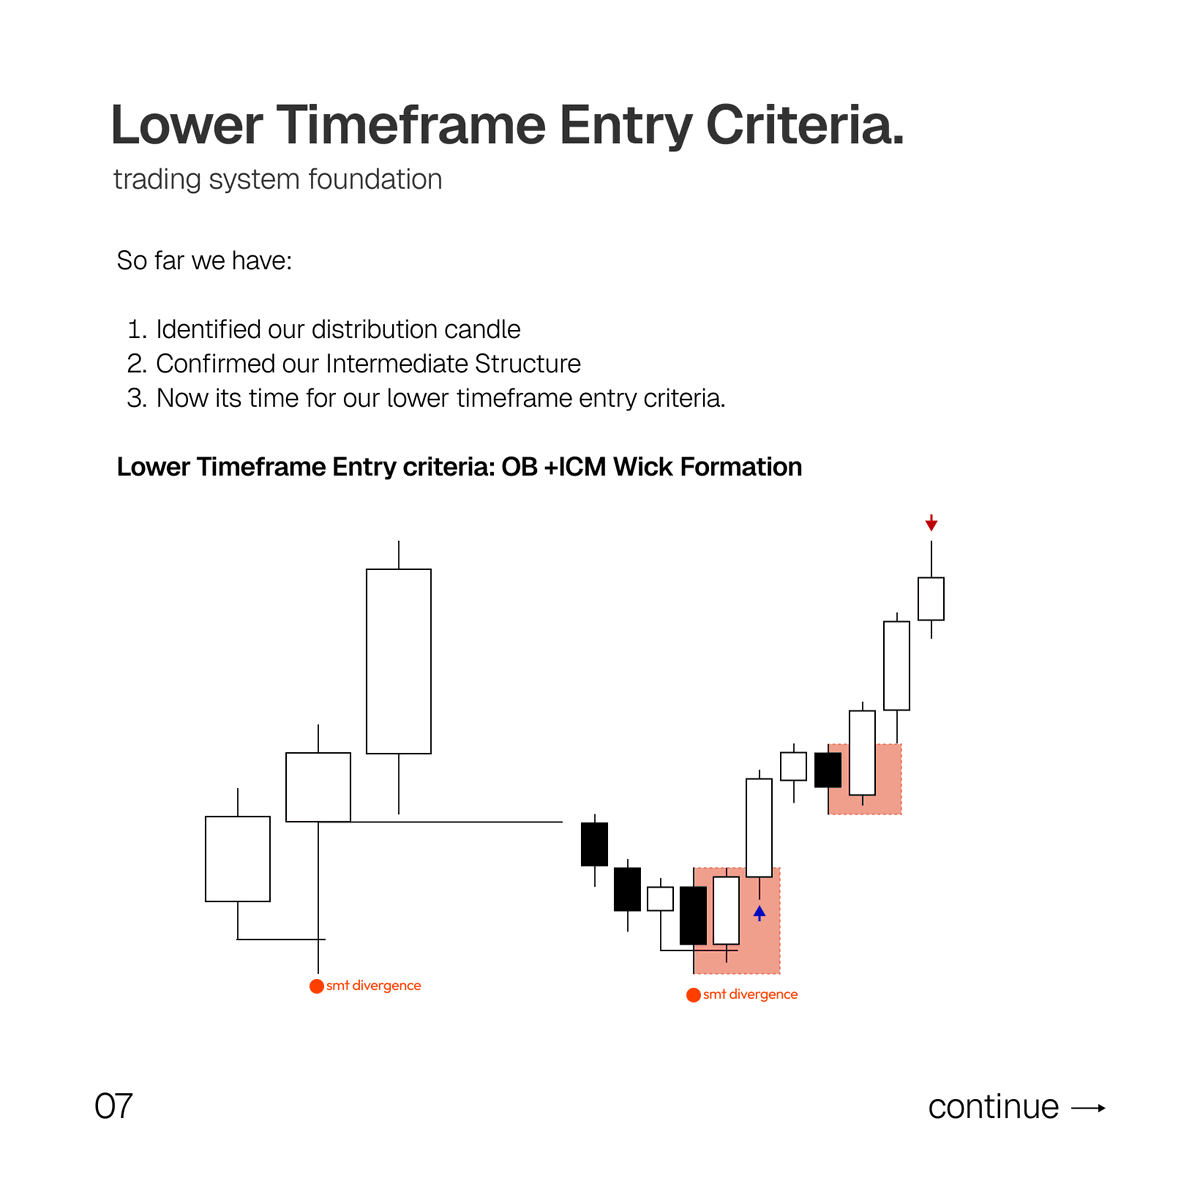
lower timeframe entry criteria [bullish] Image
lower timeframe entry criteria [bearish] Image
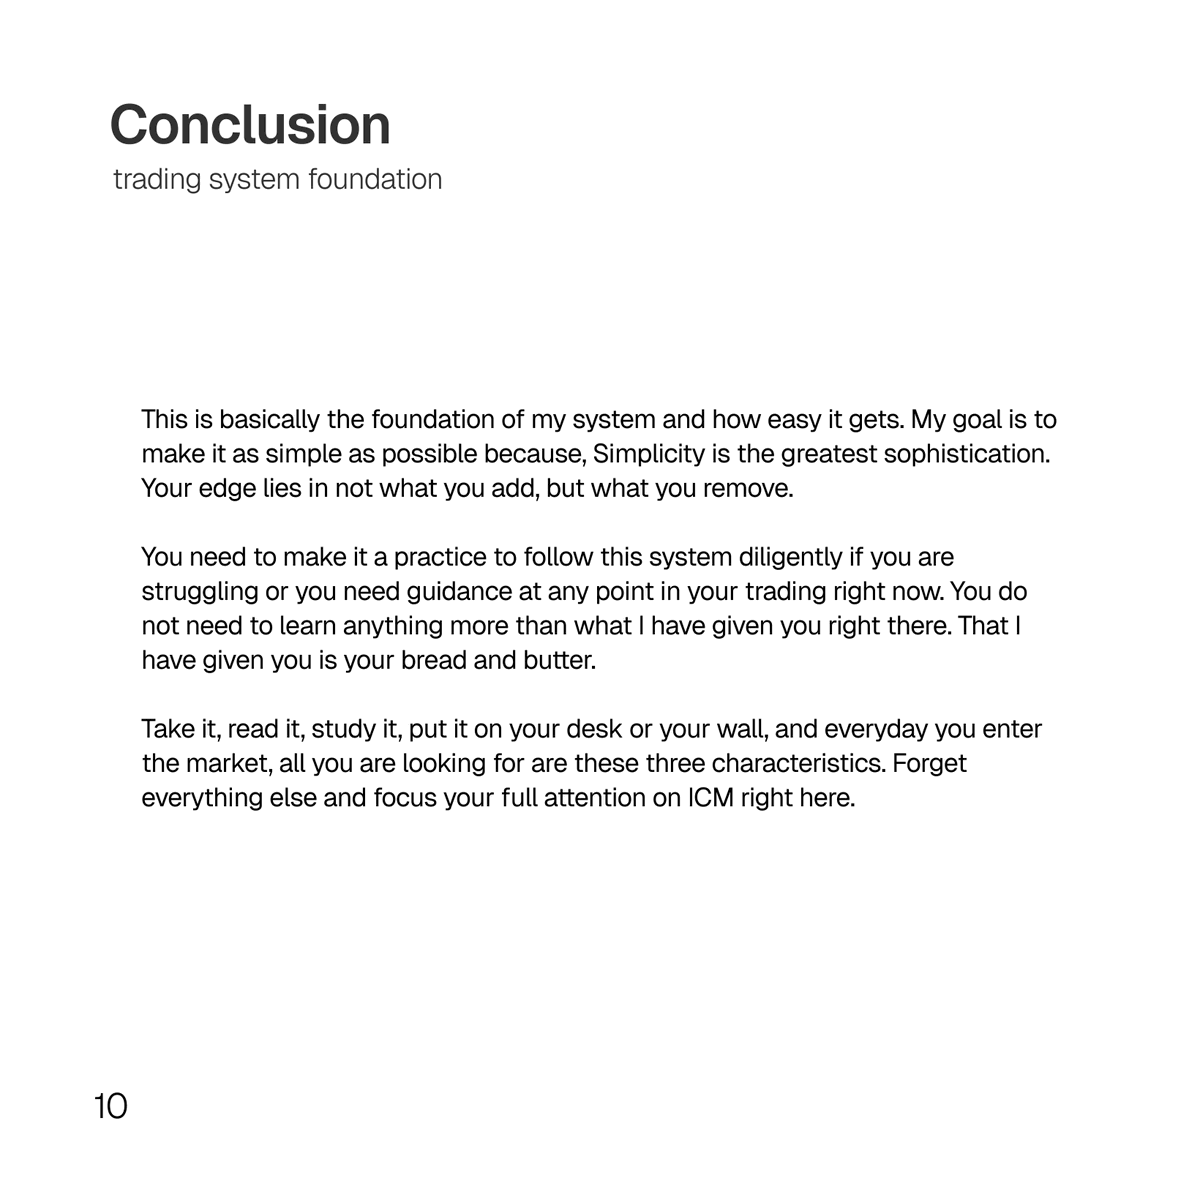
conclusion: Image
make sure to follow if you want to see more of my model and how I implement it on a daily basis.

this model was created on a foundation of ICT + ICM and a few other concepts I learned in my years of trading.

you have done yourself a huge favor by reading, understanding and implementing this model. this is the simplest and fastest way to profitability.

hope you guys enjoy the read, feel free to share with others as well to help someone else.Image

• • •

Missing some Tweet in this thread? You can try to force a refresh
 

Keep Current with RyTrades

RyTrades Profile picture

Stay in touch and get notified when new unrolls are available from this author!

Read all threads

This Thread may be Removed Anytime!

PDF

Twitter may remove this content at anytime! Save it as PDF for later use!

Try unrolling a thread yourself!

how to unroll video
  1. Follow @ThreadReaderApp to mention us!

  2. From a Twitter thread mention us with a keyword "unroll"
@threadreaderapp unroll

Practice here first or read more on our help page!

More from @ry_trades_

Oct 8
How to trade the right asset

Why is this important?

$NQ ICM Case Study

Thread🧵 Image
Why is trading the correct asset so important and why it applies not only to ES and YM and NQ but also to other correlating assets.

Here today I was offside with my bias. Was it a reason because the model didn't work? No it is not It was a human error.

Here you can see the difference between the US100 8h chart and the NQ 8h chart. based on the data I am collecting on CFDs and Futures I trade both.

What happened was I was so focused on US100 and I did not check the NQ to see the movement of price. What I failed to remember at that time was the US100 will form a new 8h candle at 9Am and that is the expansion for the AM session.

But the NQ will form its new 8h candle at 10AM providing better opportunity.Image
Looking at the US100 8h chart, was there any closure to invalidate my bearish narrative on the 8h chart? No there wasn't because the new candle forms at 9AM and trades until the new candle at 17:00

The only way I could confirm this would be by using the hourly 9AM candle as my anchor candle and then trading the expansion from that.

But I was not confident in that 1h framework as my narrative was not bullish, I wanted to see an 8h confirmation.Image
Read 5 tweets
Oct 7
How to trade against higher timeframe bias
ICM tape read $NQ

Thread🧵 Image
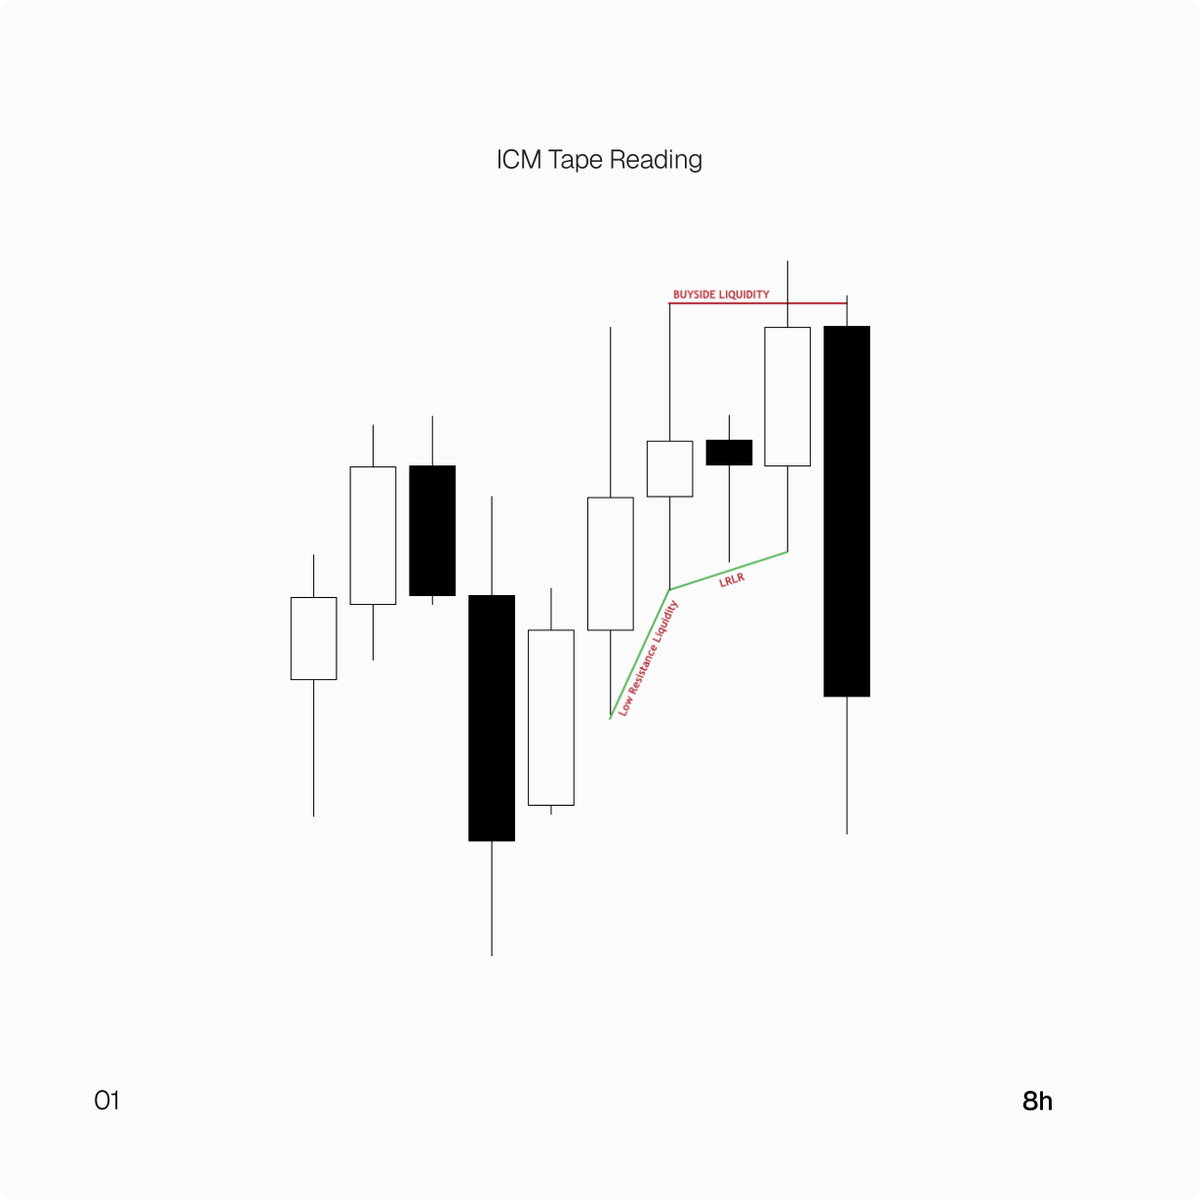
At first look on the 8h going into the 10AM candle, we can see that we had Low resistance liquidity lows.

Along with this we can also see that our draw on liquidity was met (PDH). From here our narrative would be to trade towards the low resistance lows.

But the market had not yet shifted to confirm bearishness, so we wait for that to be confirmed.Image
We then would use our framework for our ICM model. If we were going to move higher, then we would eventually form the in the upper portion of the previous candle.

If we break through the upper portion of the previous candle then that is first indication that the market is not looking to continue higher within our framework.

Once we break through the 50%, then we would be like to break lower. This is how we confirm reversals.Image
Read 5 tweets
Oct 6
How to confirm reversals using Internal Candle Modeling (ICM)

$NQ

Thread🧵 Image
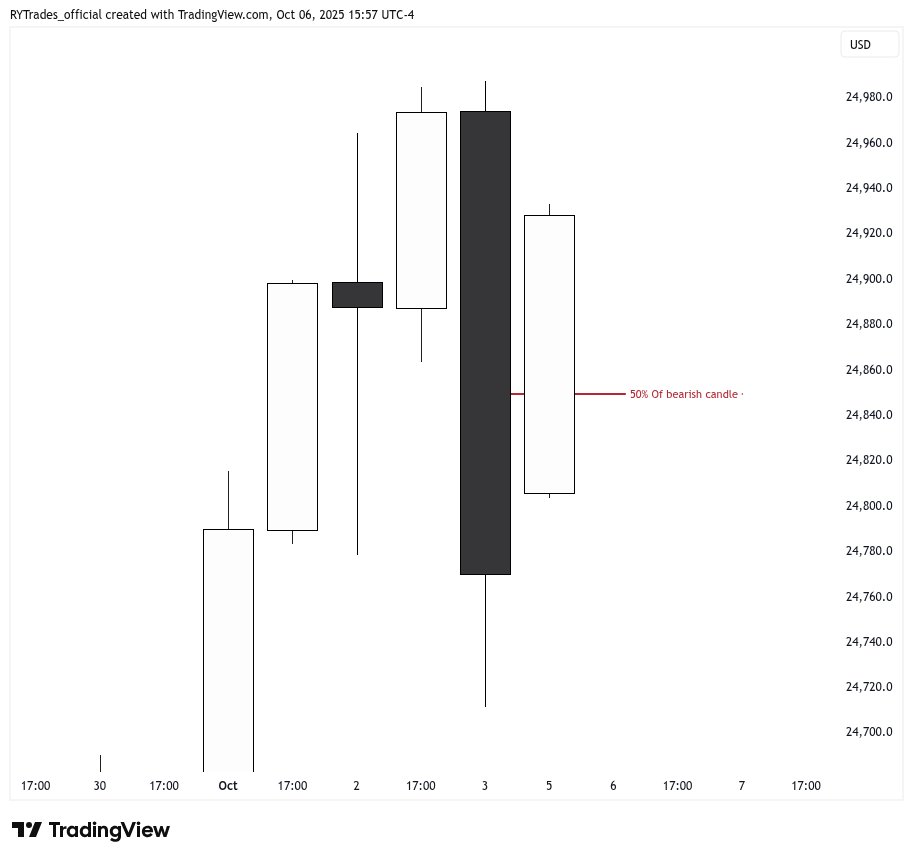
On the NQ today, the first thing we had in mind on the 12H chart was that there was a large bearish candle.

This model is not meant to be used as a pattern but as a framework for logic.

If we are expecting lower prices from that bearish candle, we want to see a respect of the wick formation area and most importantly a respect of the 50% of that bearish candle.Image
What happens if we break the 50% of the bearish candle?

A reversal would be in play right. But we need to break and close above that bearish candle before looking for higher prices.

I love using the 8H chart as my confirmation for this. So I don't need to wait on the 12h closure.
Read 9 tweets
Oct 5
How to predict wick formations
Case study $NQ

Thread🧵 Image
8H Chart

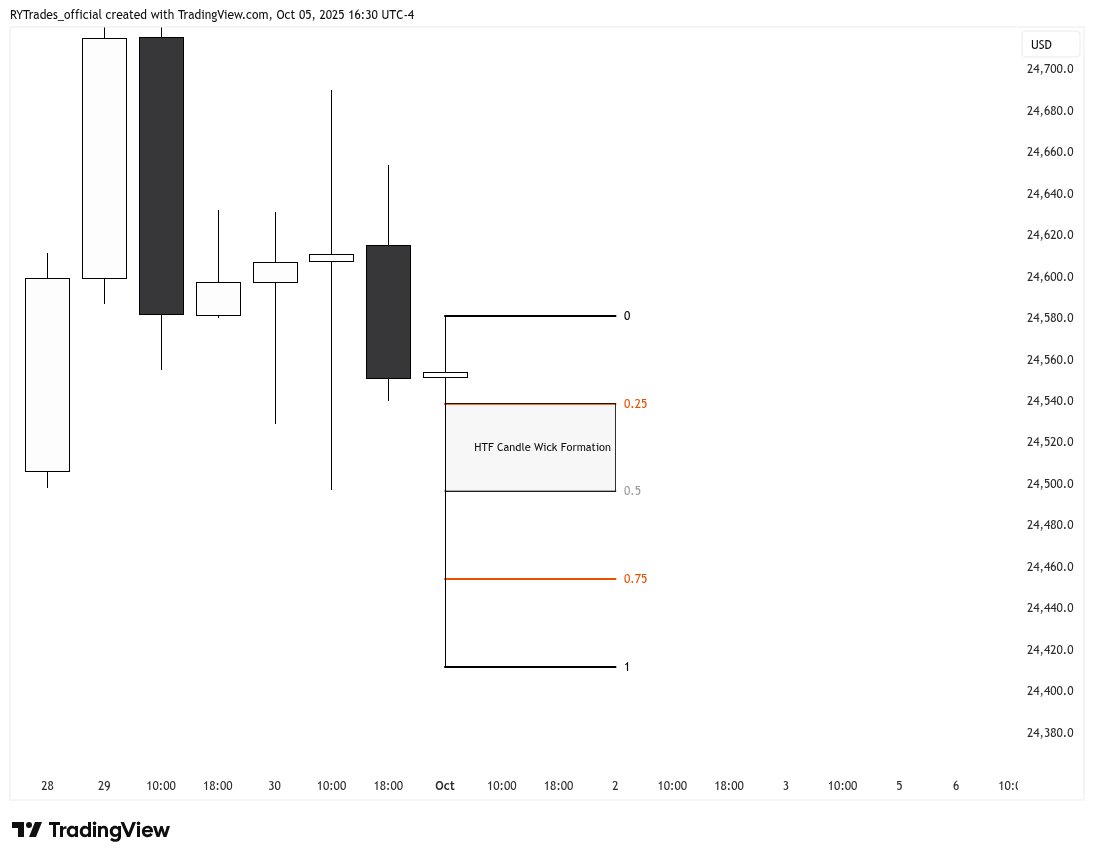
Here we can see that the market is currently reversing to the upside. We swept sellside liquidity and formed a reversal candle.

Within this reversal candle, we can grade this and we can know exactly where we can expect the wick of the next 8H candle to form.

Because we closed in such close proximity to the 25% level, we can anticipate a second quadrant wick formation.

Thats all we need to do here.Image
30 Min:

From the Higher timeframe, we have completed all the analysis and the next thing we need to do is align the lower timeframes with that narrative.

So we know that the next 8h candle will open at 10AM so with that in mind, we are being patient waiting for that 10AM candle to open and that wick to form.

So what we did was we measured the current 30Min candle and outlined the possible wick formation as well for the next 30 min candle (10AM candle).Image
Read 7 tweets
Oct 3
15 Minutes a day

1 Higher timeframe candle

Thats all you need to trade this trading model

Introduction to ICM trading Model

Thread🧵 Image
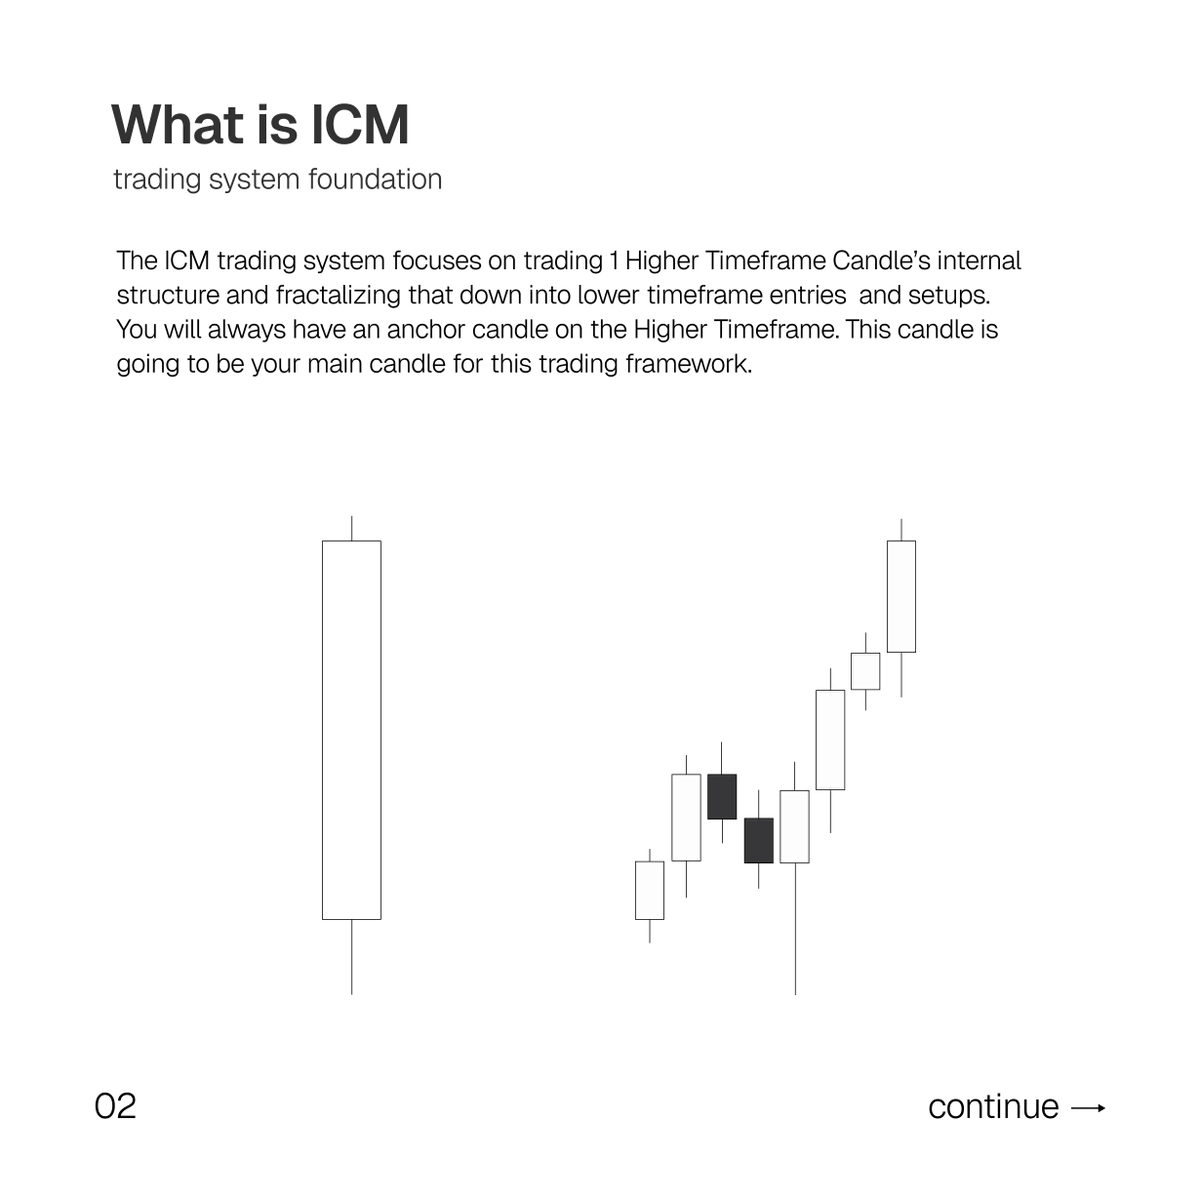
What is ICM: Image
Directional Candle framework: Image
Read 6 tweets
Oct 2
Imagine you could predict where the wick of every higher timeframe candle will form.

Not with indicators
Not with patterns
Just pure structure

Thats what ICM is about

it's so simple even a baby could understand it

Here's the secret:🧵 Image
Every HTF candle has natural retracement zones

Opening price. Closing price. 50%. High. Low. Quadrants

Price always return to these levels.

Always
When it does, that's where the wick forms

Thats where you enter

It's not prediction

It's reaction to structure that already exists.
Read 9 tweets

Did Thread Reader help you today?

Support us! We are indie developers!


This site is made by just two indie developers on a laptop doing marketing, support and development! Read more about the story.

Become a Premium Member ($3/month or $30/year) and get exclusive features!

Become Premium

Don't want to be a Premium member but still want to support us?

Make a small donation by buying us coffee ($5) or help with server cost ($10)

Donate via Paypal

Or Donate anonymously using crypto!

Ethereum

0xfe58350B80634f60Fa6Dc149a72b4DFbc17D341E copy

Bitcoin

3ATGMxNzCUFzxpMCHL5sWSt4DVtS8UqXpi copy

Thank you for your support!

Follow Us!

:(