As promised, a more thorough review.
The headline claim is a really disappointing word-squirm, because it shifts costs to expensive capital purchases (which are ignored) to reduce operating costs (bills).
But there are other deep problems with their price analytics. 1/
The headline claim is a really disappointing word-squirm, because it shifts costs to expensive capital purchases (which are ignored) to reduce operating costs (bills).
But there are other deep problems with their price analytics. 1/
https://twitter.com/GrattanInst/status/1977313663426916695
Firstly, what are they arguing for?
To introduce some explicit carbon pricing, because coal isn't leaving fast enough to reach our carbon emissions targets.
They say that coal is leaving for financial and ages reasons, but too slow. 2/
To introduce some explicit carbon pricing, because coal isn't leaving fast enough to reach our carbon emissions targets.
They say that coal is leaving for financial and ages reasons, but too slow. 2/

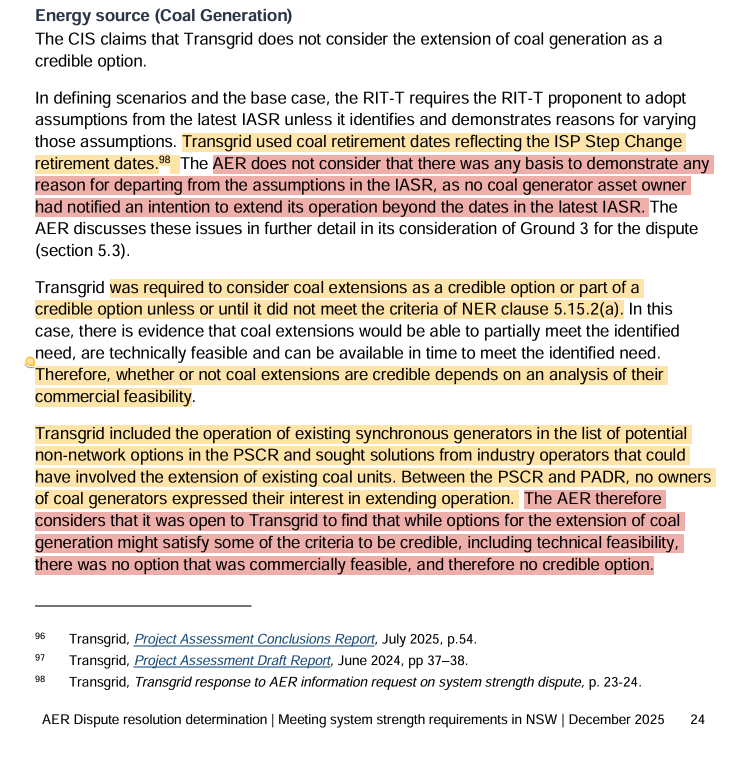
I actually disagree with the premise that coal will close for financial reasons.
In fact, coal is declining subsidies, in return for uncapped profits. With average prices soaring, their business case remains quite sound. 3/
In fact, coal is declining subsidies, in return for uncapped profits. With average prices soaring, their business case remains quite sound. 3/
https://x.com/FootnotesGuy/status/1918170714542358775
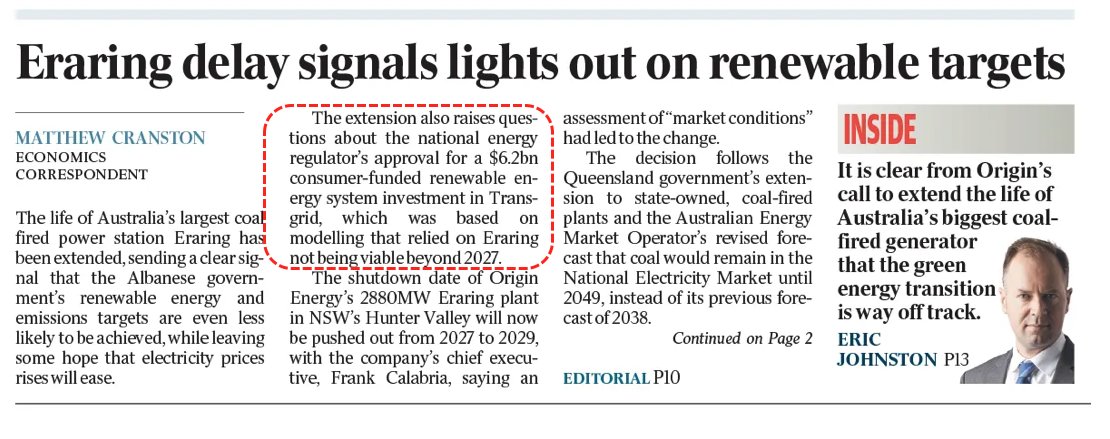
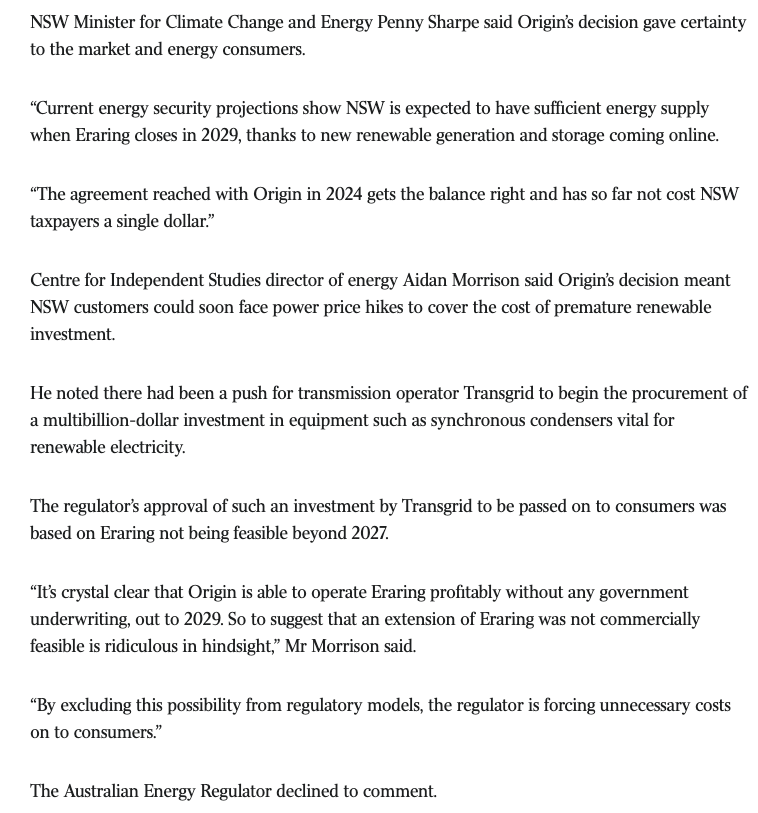
This is just in, confirming that Origin is still running a profitable operation at Eraring. 4/
reneweconomy.com.au/origin-hints-a…
reneweconomy.com.au/origin-hints-a…
So Grattan are right to say that you need to push coal out. They won't jump.
And their preferred mechanism is to make the Safeguard Mechanism (which applies to all heavy emitters) bite harder on electricity, where it currently has a special sector treatment. 5/
And their preferred mechanism is to make the Safeguard Mechanism (which applies to all heavy emitters) bite harder on electricity, where it currently has a special sector treatment. 5/

So they assume that coal will inevitably be replaced (at end of life, or sooner) by firmed renewable energy, because they're adamant that CSIRO confirms that that's the lowest cost of new built electricity generation.
Reference? the latest GenCost. 6/
Reference? the latest GenCost. 6/

This tacitly backs in a conclusion that CSIRO's own report and numbers don't support. Very disappointing. 7/
https://x.com/FootnotesGuy/status/1950041065001484661
Moreover, an understanding of the capacity factors involved in CSIRO's assumptions completely overturn this suggestion. Coal will be cheaper, new or old, for as long as we can see. 8/
https://x.com/FootnotesGuy/status/1970148263149146370
So the forcing mechanism that they propose is even more needed than they recognise.... But this is all pre-amble to the really, really important question.
What does that mean for system costs, and prices that hit business and households?
They conclude... not much. 9/
What does that mean for system costs, and prices that hit business and households?
They conclude... not much. 9/

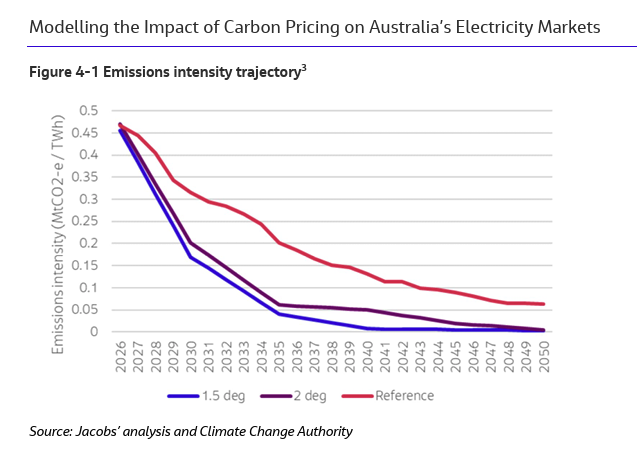
Now there are a bunch of clues as to why this is problematic. One of them is that they have an even tighter scenario, targeting 1.5 degrees.
Which costs... slightly less in the short term, more in the medium, and same in the long term. 10/
Which costs... slightly less in the short term, more in the medium, and same in the long term. 10/

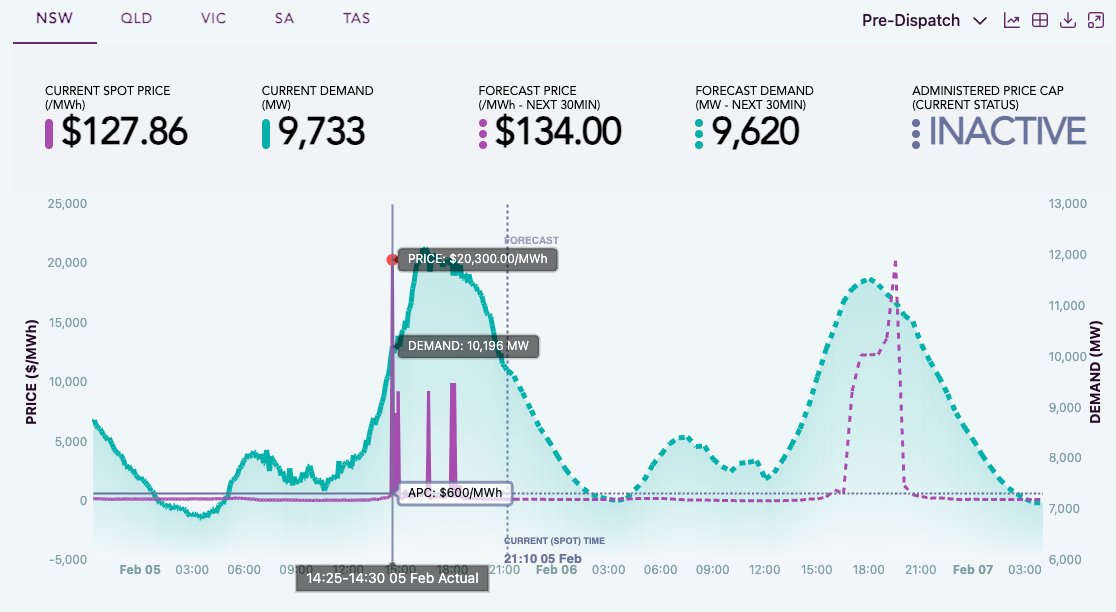
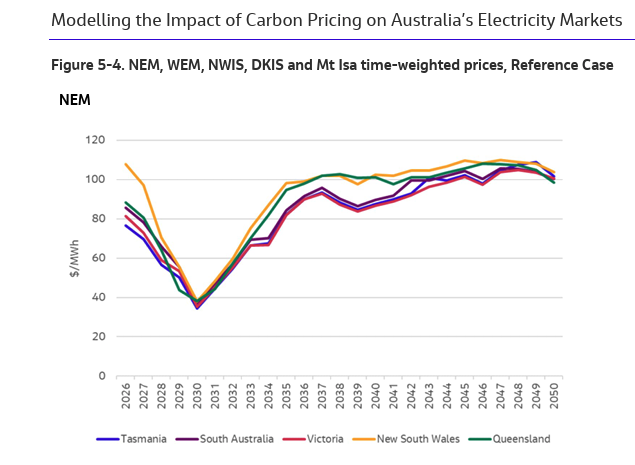
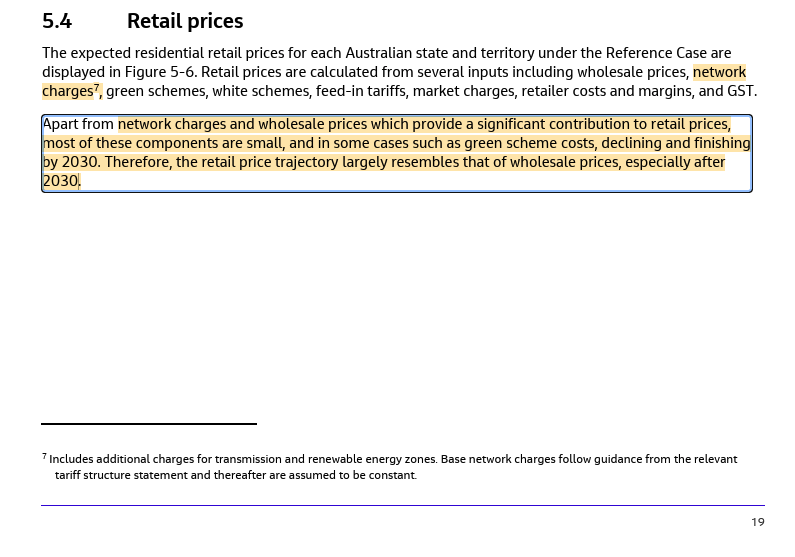
The other major clue is their projections on the wholesale prices of electricity, which clearly drive the bulk of the effects.
Two major observations.
1. the overall level, around $100/MWh
2. the short-term plunge, down to $50/MWh
11/
Two major observations.
1. the overall level, around $100/MWh
2. the short-term plunge, down to $50/MWh
11/


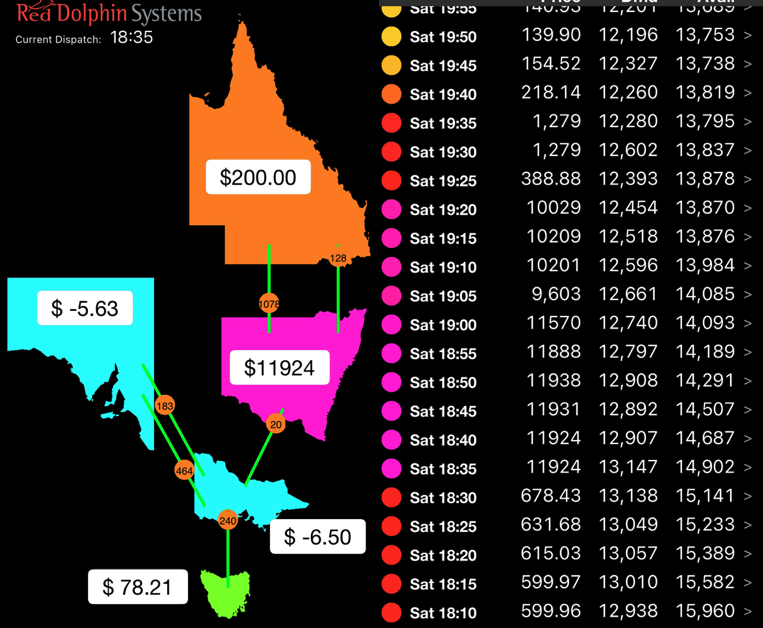
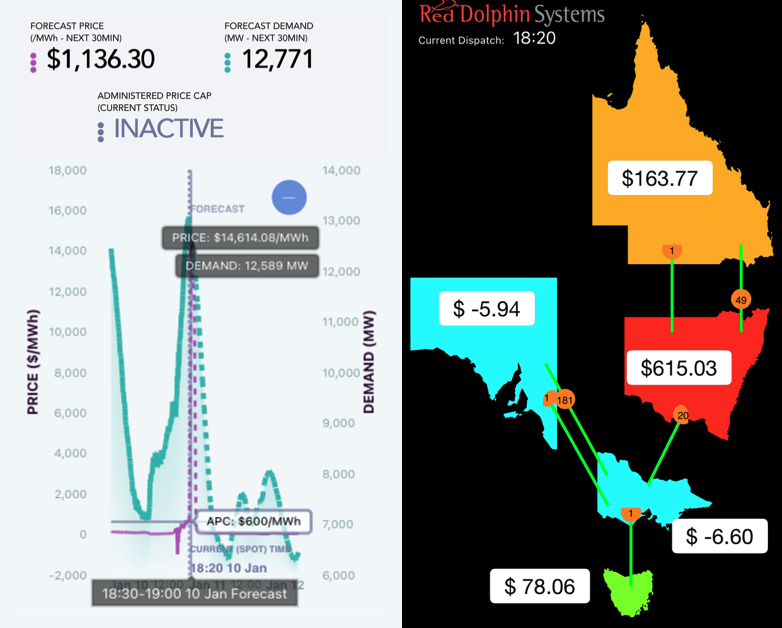
The overall level seems... a bit optimistic, but not wildly for the starting point. Averages in 2024 are above $100 across the NEM already. $150 in NSW.
$50/MWh has only been seen in Covid slumps, and before 2016.
12/
$50/MWh has only been seen in Covid slumps, and before 2016.
12/
https://x.com/FootnotesGuy/status/1970174406254305708
So how does one project a massive slump up to 2030, as we massively accelerate the roll-out?
We've seen this before by the AEMC. The trick is to model prices in abstraction from system costs, assuming subsidies force in a glut of renewables. 13/
We've seen this before by the AEMC. The trick is to model prices in abstraction from system costs, assuming subsidies force in a glut of renewables. 13/
https://x.com/QuixoticQuant/status/1864289012535713981
This phenomenon around the short-term glut driven by subsidies is explicitly confirmed in the Jacobs report which underpins all the Grattan price projections.
As is the dominance of wholesale costs. 14/
As is the dominance of wholesale costs. 14/

Another strange anomaly is that the wholesale cost here is assumed to be the time-weighted price, not the volume weighted price, which is what ends up driving consumer costs. 15/
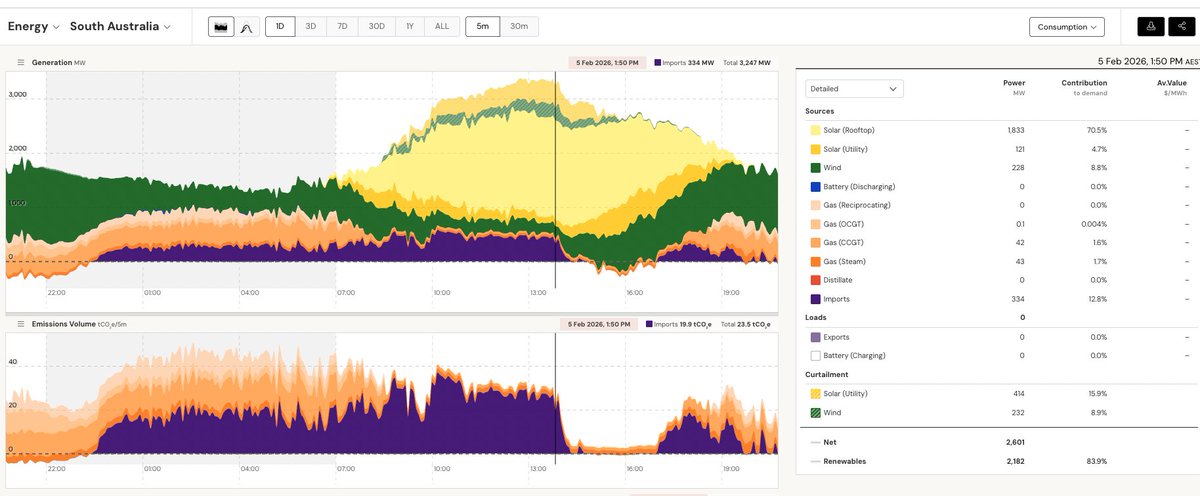
As we end up with vastly more rooftop solar in the system, it's inevitable that much less grid electricity will be consumed in the middle of the day, when prices are very low. So the volume-weighted average will diverge from the time-weighted. (Source AEMO ISP Appendix 4) 16/

The ISP assumes that a whole bunch of hydrogen production and EV charging helps fill in midday demand... and it looks like Jacobs (and Grattan) assume the same thing. They even say we're going to have a little hydrogen export powered by rooftop solar! 17/


I think any assumptions that include green hydrogen should be ditched altogether. The NSW government has just tabled legislation cutting their upcoming target tenfold. And they have the (only?) major project that might go ahead with subsidies (with Orica). 18/

The Jacobs report still assumes an absolutely massive amount of rooftop solar. So the gap between time-weighting and volume-weighting the wholesale cost could be large. 19/

They do explain how/why they model at least some limitation on negative prices widening that spread. Some rosy assumptions, like hour-long aggregation, nothing above average weather, and EV chargin in the day. 20/
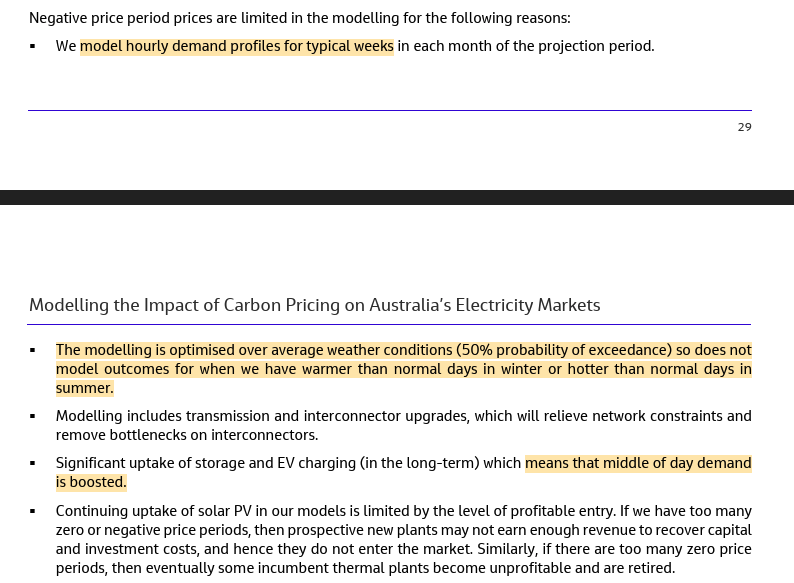
But the really big mystery, about why costs seem to be projected flat around $100, is explained here.
They make an assumption about bidding behaviour, which is "limited by the cost of new entry".
Crucial. 21/
They make an assumption about bidding behaviour, which is "limited by the cost of new entry".
Crucial. 21/

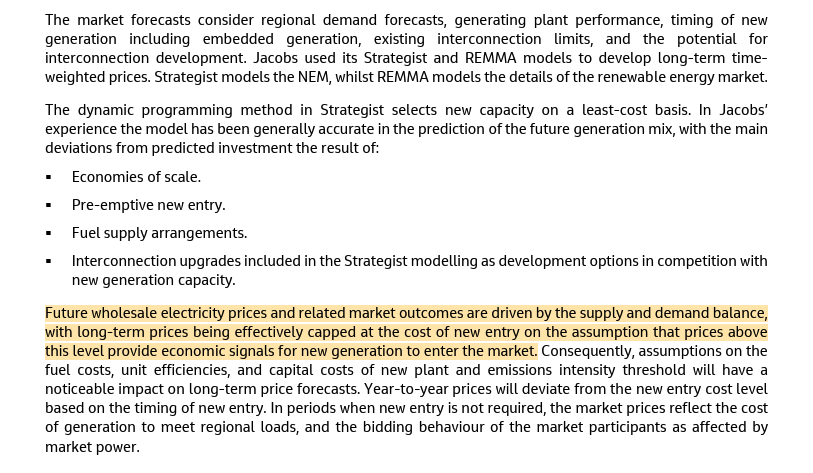
So the critical question is what they think the cost of new entry is. And whether the entrant can force down the wholesale price across the board (which unfirmed renewables certainly can't).
They argue a hybrid with gas can do this, for just over $100/MWh in 2024!
22/
They argue a hybrid with gas can do this, for just over $100/MWh in 2024!
22/
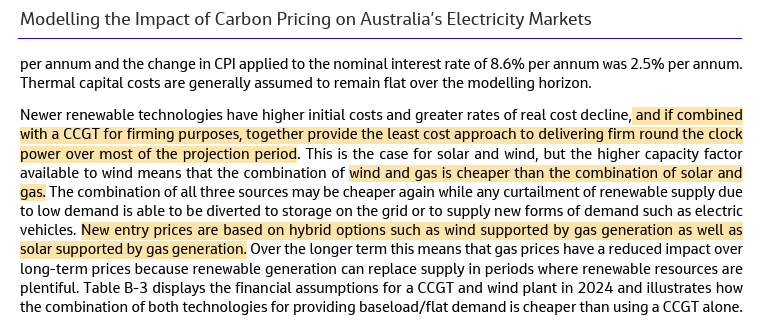
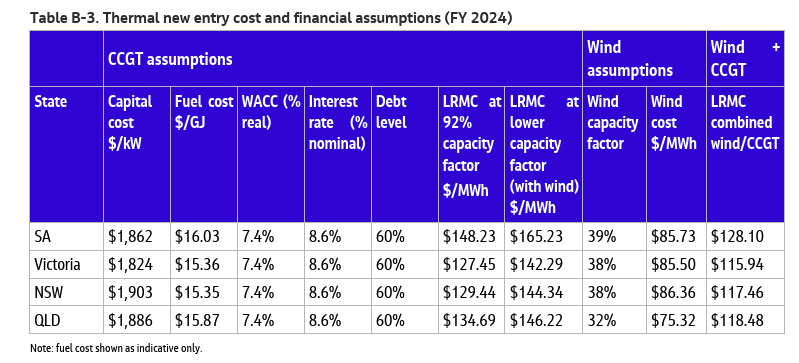
The other strange thing there is that they assume Combined Cycle Gast Turbine (CCGT). That's a gas turbine with a steam turbine powered by the exhaust. It's much more efficient than open-cycle (no steam). But the trade-off is higher capital costs, and much slower ramping. 23/
And this is where the assumptions seem to unravel badly. They assume the CCGT could operate best at 92% capacity factor. But it's efficient to blend in ~38% wind, which would push the gas cost up a bit, but pull the average down, because wind's overall cost is around $85.
24/
24/
Now because they take the GenCost costs from the 2023-34 GenCost, they assume that wind and solar costs will fall.

So it's easy to see how they conclude that the gas-wind combo keeps an average new entrant cost around $100 in the long term.
And that explains how their modelling of bidding capped by that stays so low.
But there's one, massive glaring contradiction. 26/
And that explains how their modelling of bidding capped by that stays so low.
But there's one, massive glaring contradiction. 26/
How do you push emissions down right the way to practically zero, if you still assume that all your new entrants will burn gas in a CCGT 62% of the time to provide a $100/MWh, firm solution with wind providing some fuel-saving just 38% of the time? 27/

So I just can't see how this absolute collapse in the emissions intensity of the grid is consistent with still using gas at ~60% capacity factor for a hybrid new entrant. 28/
In practice, if you want to reach net-zero, you'd have to go to faster ramping open-cycle gas turbines, with much, much lower capacity factors, and hence a much higher long-run marginal cost. They would set the price. This is a critical flaw in my eyes. 29/
I'm also absolutely shocked by the dismissal of network costs as being small, and not a driver of prices overall. This is another glaring omission. Network costs will definitely surge. 30/

And the rate of construction from the Capacity Investment Scheme is just.... Well I just don't think that will happen. And they explicitly rely upon that happening to create that slack in the wholesale market, which underpins everything. 31/


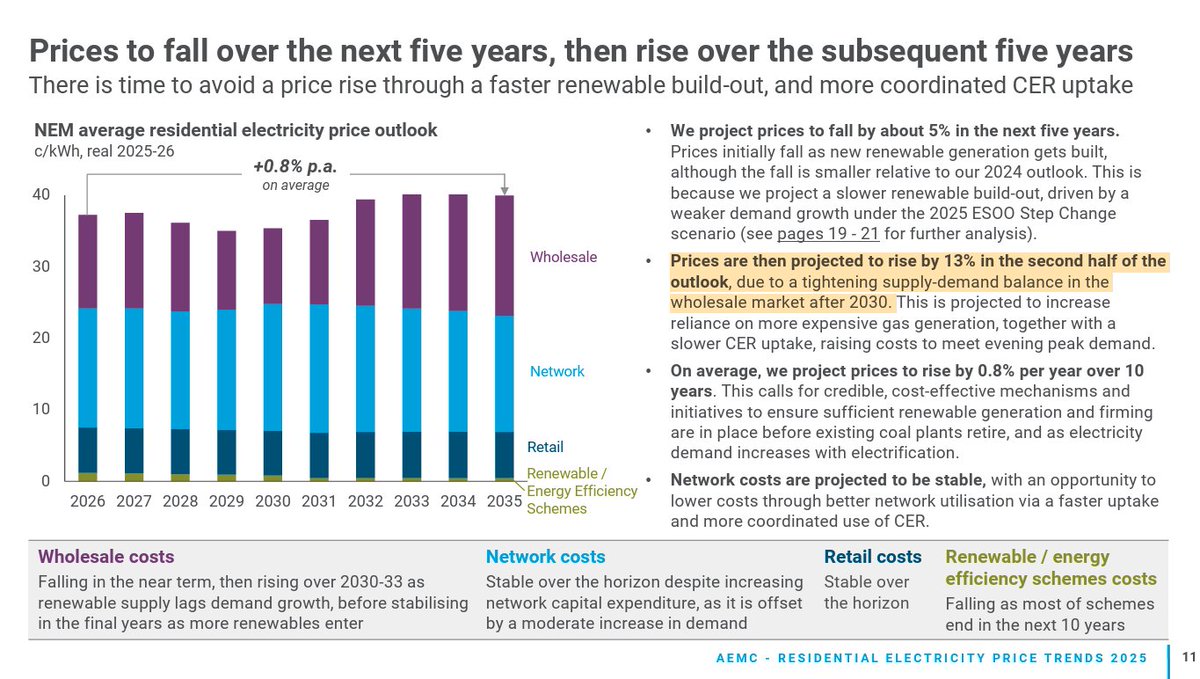
So going back to the Grattan conclusions... this is still the headline. Excluding consumer capital from costs is just silly. 32/
https://x.com/FootnotesGuy/status/1977611166391414797
The idea that consumer costs will decline overall rests on that capital exclusion fallacy.
And that idea is very important for their paper. 33/
And that idea is very important for their paper. 33/
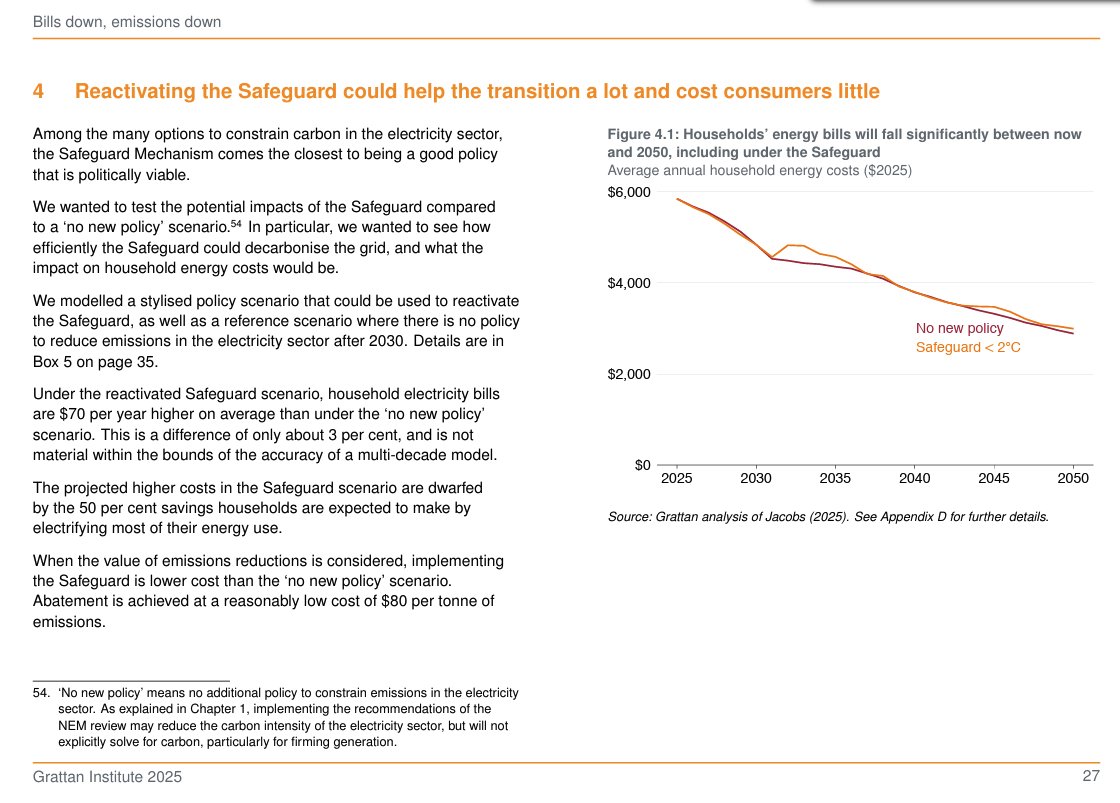
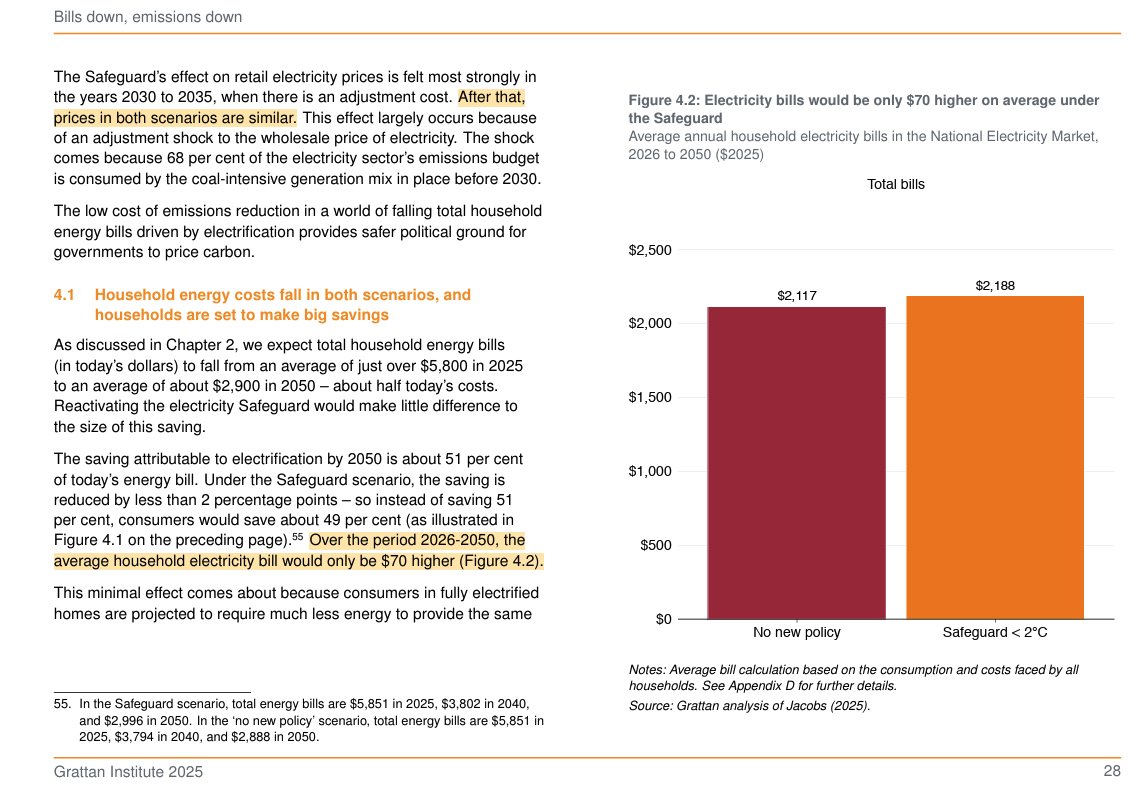
But they go a step further in saying that the actual prices of electricity won't change much either.
Just $70 per year, in fact.
I don't think the Jacobs report underpinning that is remotely sound. Wholesale and network costs will rise, and rise a lot, in both cases. 34/34
Just $70 per year, in fact.
I don't think the Jacobs report underpinning that is remotely sound. Wholesale and network costs will rise, and rise a lot, in both cases. 34/34
• • •
Missing some Tweet in this thread? You can try to
force a refresh