ASML 3Q25
- Revenue down -2% q/q & up 1% y/y to €7.52B (below mid pt guidance); CY25 on track for 15% growth
- Implied CY26 will be flat to up; €32-€33B backlog exiting 3Q25; Near 100% coverage for CY26 (at flat growth)
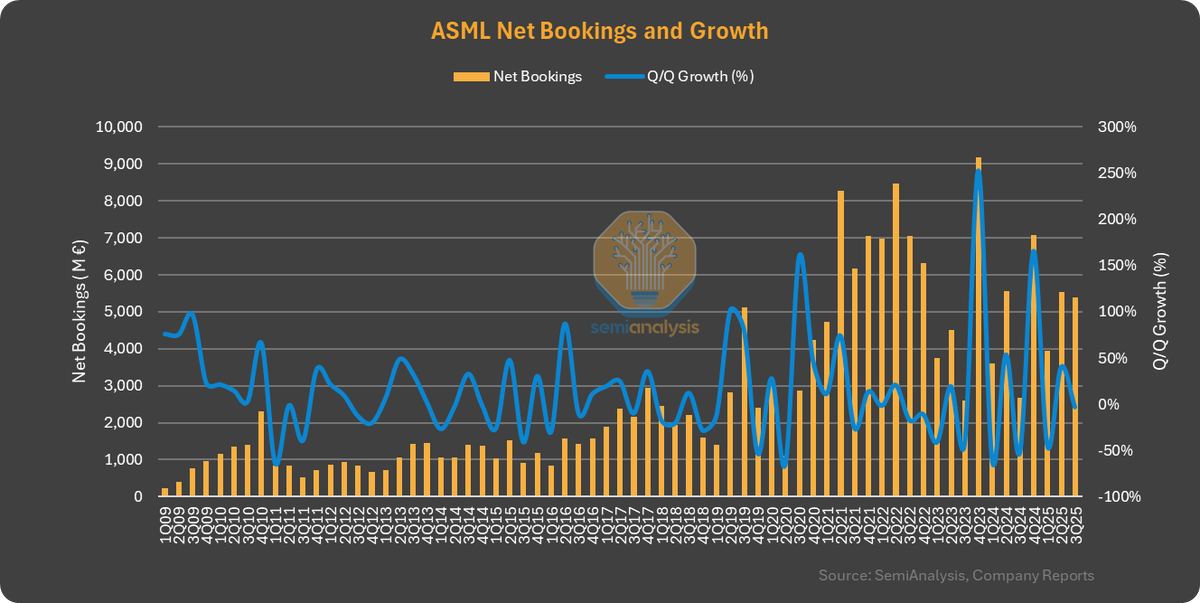
- Net bookings down -3% q/q but up 103% y/y to €5.4B; EUV booking up 57% q/q; DUV down -44%; Memory up 186% q/q
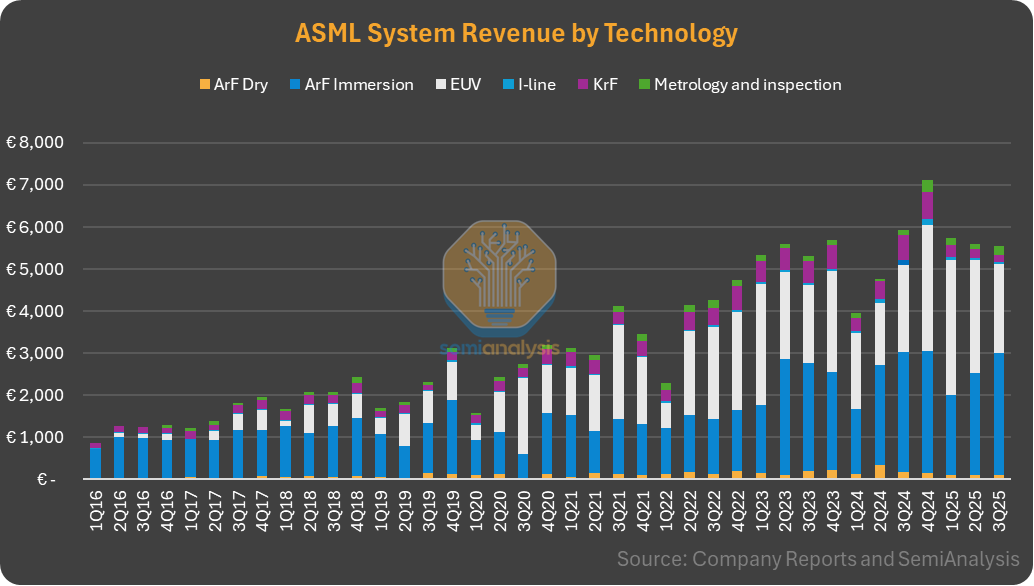
- EUV revenue down -21% q/q while DUV up 15%
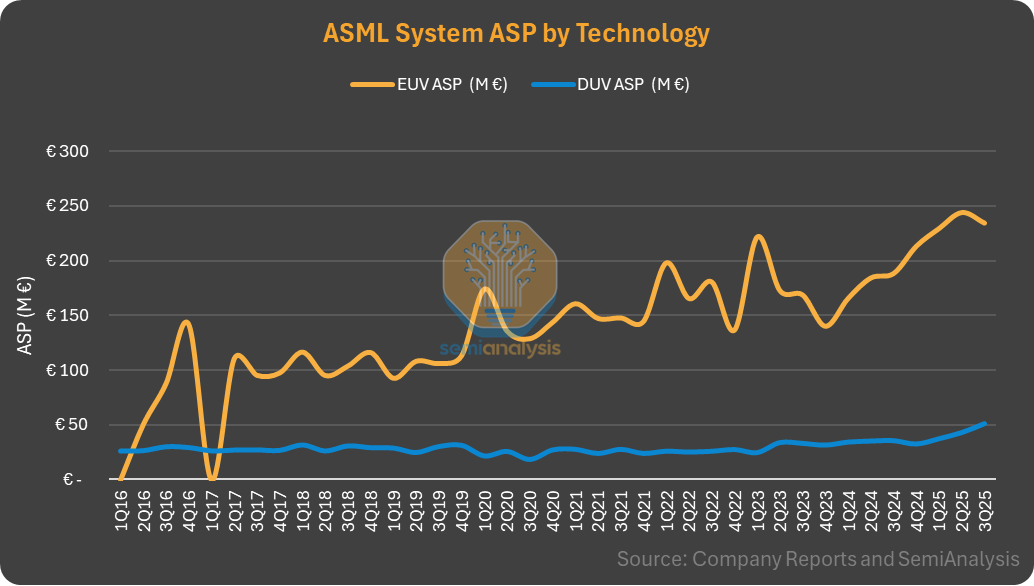
- EUV ASP down -4% q/q to €235M
- EUV system shipments down by 2 to 11
- 1 HNA rev rec in 3Q25
- Non-China DUV up 34% q/q
- 51.6% GM vs 50-52% guidance, likely driven by higher mix of 3800;
- 4Q25 revenue will grow 26% q/q & 3% y/y to €9.5B (mid pt); GM: 51-53%
- CY25: €32.5B rev (mid-pt of guidance) at >52% GM; CY26 will be flat to up; trends looking positive
- CY30 guidance of €44-€60B at 56-60% GM remains intact
- China up 54% q/q after 3 quarters of -ve growth; But China will decelerate in 2026;
- Taiwan and Korea down q/q; US down -40% q/q; Japan down -80% q/q
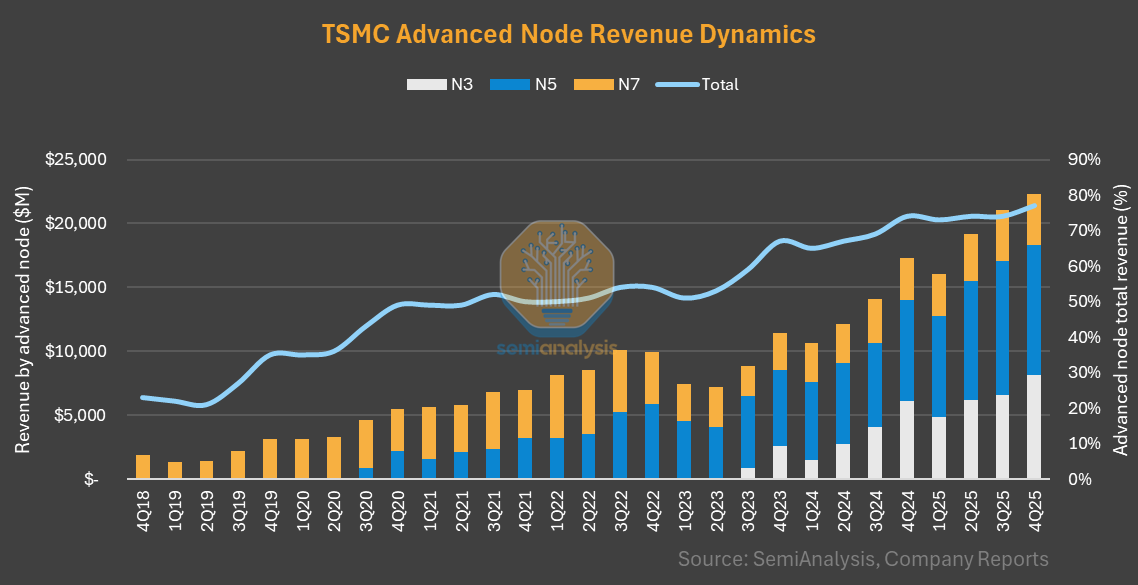
- Leading-edge logic a key driver in CY25; Memory strong too; CY26 to be driven by EUV with China DUV dragging down overall DUV
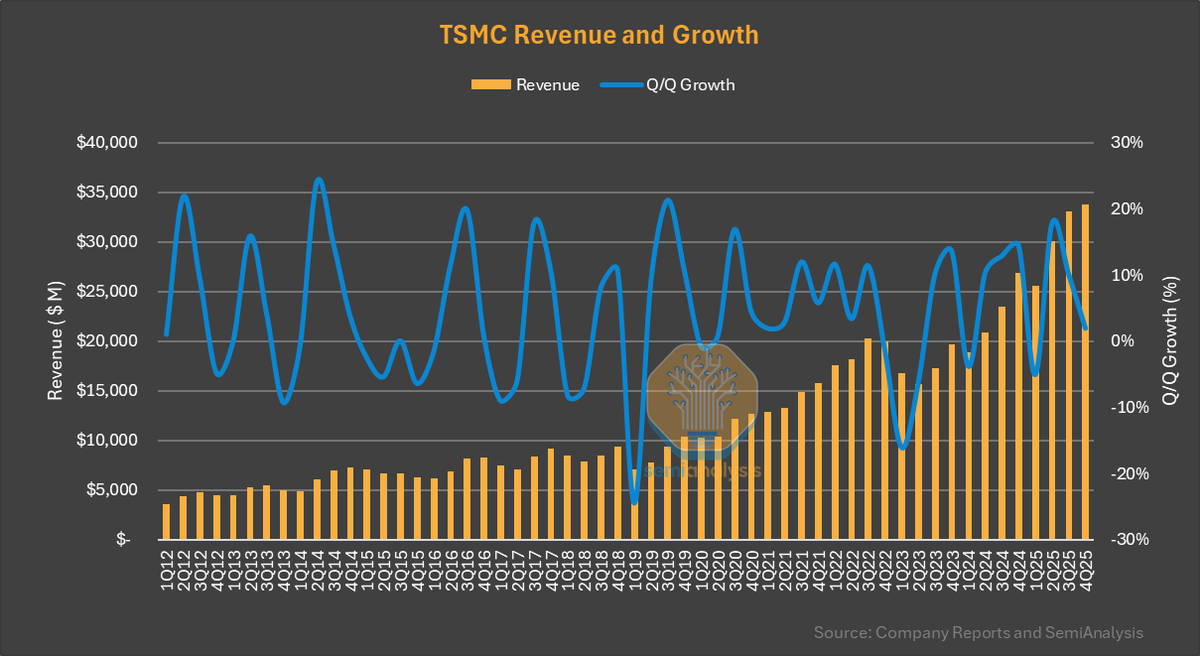
- ASML's logic revenue down -6% q/q while memory up 10%; its primary customer TSMC's revenue grew 10% q/q
• • •
Missing some Tweet in this thread? You can try to
force a refresh
TSMC 4Q25: Revenue, GM and OPM all beat high-end guidance.
4Q25 vs 4Q24: Revenue: $33.73B (+2% q/q & +26% y/y) Gross Margin: 62.3% (59%)
Operating Margin: 54% (49%)
Capex for CY25: $40.9B (+38%)
Wafer Shipments: 3.961 m (+16%)
Wafer ASP: $7324 (+7%)
Revenue up y/y double-digit for 8 consecutive quarters. Will grow DD% y/y in 1Q26 too. Finishes CY25 with $122.4B (first $100B year) with 35.9% y/y growth.
Advanced nodes now 77% of revenue. N3 drives $1.5B incremental q/q revenue. N5 holds steady at $10B quarterly run-rate. After 12 quarters, N7 hits $4B run-rate again.
MediaTek 3Q25: $4.7B+ revenue. GM of 46.5% below mid point guidance of 47%. Likely driven by flagship smartphone chips.
Every $1 of TWD appreciation vs USD reduces MTK's TWD revenue by 1%. USD revenue at the high end guidance, driven by better than expected Dimensity 9500 demand.
Reitarates ASIC revenue target of $1B in CY26 and multiple billions in CY27. More complex follow on project is expected to generate revenue from '28 and beyond.
Advanced node revenue (N7 and below) up 10% q/q and 51% y/y to $21.3B. N3: +5% q/q; N5:+13%; N7: +10%. Android drove N3 despite Apple seasonality.
All end markets up DD% q/q. Smartphones drove $1.8B incremental rev while HPC drove almost $0.8B. Smartphone drove 60% of incremental rev and up 14% q/q and 18% y/y. Auto all-time-high for the 3nd straight quarter.
TSMC 2Q25; Beats the high-end of rev guidance, despite FX impact, GM close to high-end of the guidance and OPM > high-end guidance.
2Q25 vs 2Q24
Revenue: $30.070B (+44%)
Gross Margin: 58.6% (53.2%)
Operating Margin: 49.6% (42.5%)
CapEx: $9.6B (+51%)
Wafer Shipments: 3.718 m (+19%)
Wafer ASP: $7027 (+21%)
Advanced node revenue (N7 and below) up 19% q/q and 59% y/y to $19.3B. N3: +29% q/q; N5:+18%; N7: +10%. Android drove N3 despite Apple seasonality.
All end markets up. HPC drove $3B incremental rev while smartphone drove almost $1B. HPC drove 67% of incremental rev and up 20% q/q and 67% y/y. Auto all-time-high for the 2nd straight quarter.
TSMC monthly revenue trend observations.
- October is the greenest and Feb is the reddest when it comes to monthly revenue weights
- Aug to Dec above average in terms of revenue weight while Feb to May below average
- 45/55 split between 1H/2H (last 5 yr average)
- In terms of month on month growth, March and August often see strong DD % growth
- December inevitably sees MSD% m/m decline despite as shipments cool off
- In the last 5 years, on ana average January saw 9% month on month growth
2Q is the reddest quarter. While 3Q is the greenest. Some anomalies exist like 2009-14 when Q2 was the greenest.
NVIDIA's forward days of inventory stand at 69 days (healthy) by the end of 3QFY25, meaning it can flush the current inventory on hand quickly (no surprise). Its outstanding inventory purchase & long-term supply obligations inched up again to $29B. This is where HBM procurement sits. Prepaid supply & capacity agreements stood at $5.2B. Multi-yr cloud service agreements grew 15% q/q to $11.3B.
DC revenue grew q/q for every single quarter since 1QFY15 (except for 3 quarters). Networking is down this quarter but will be up next quarter.
China revenue hit a record high (+48% q/q & +34% y/y). +34% vs previous peak.