It would be fair to say that builders have a higher-than-normal number of "empty lots they are sitting on".
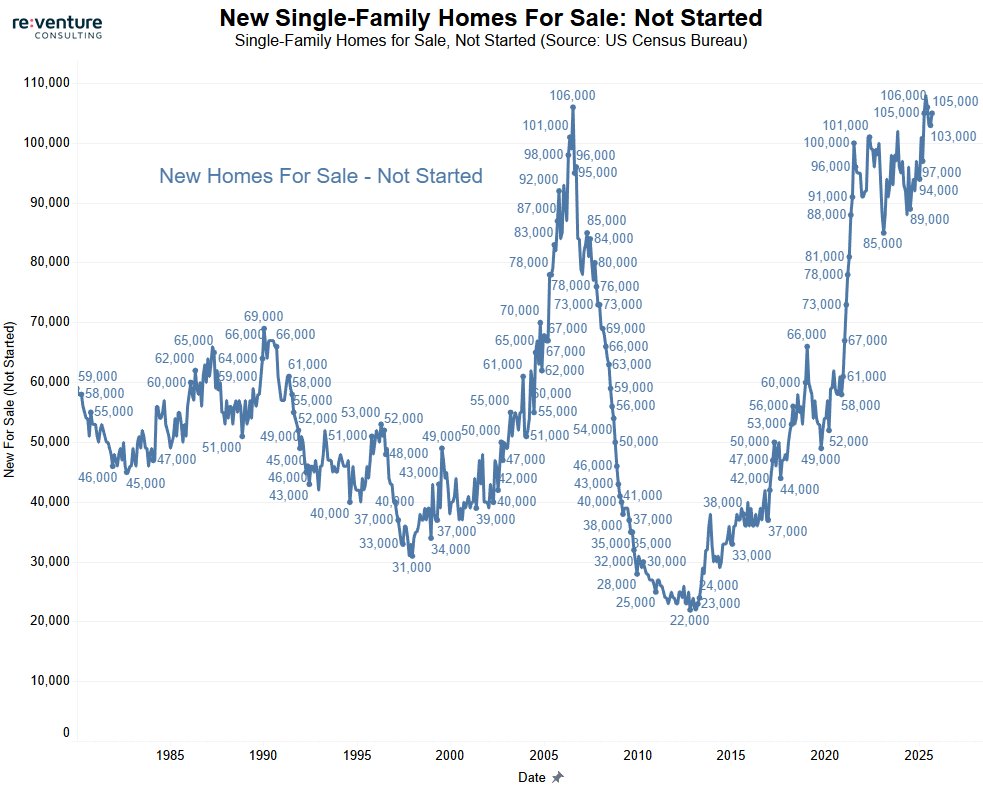
According to Census Bureau, there are 105,000 homes listed for sale from builders that they haven't started construction on.
There's also 134,000 homes permitted by builders that haven't been started.
Both are near records.
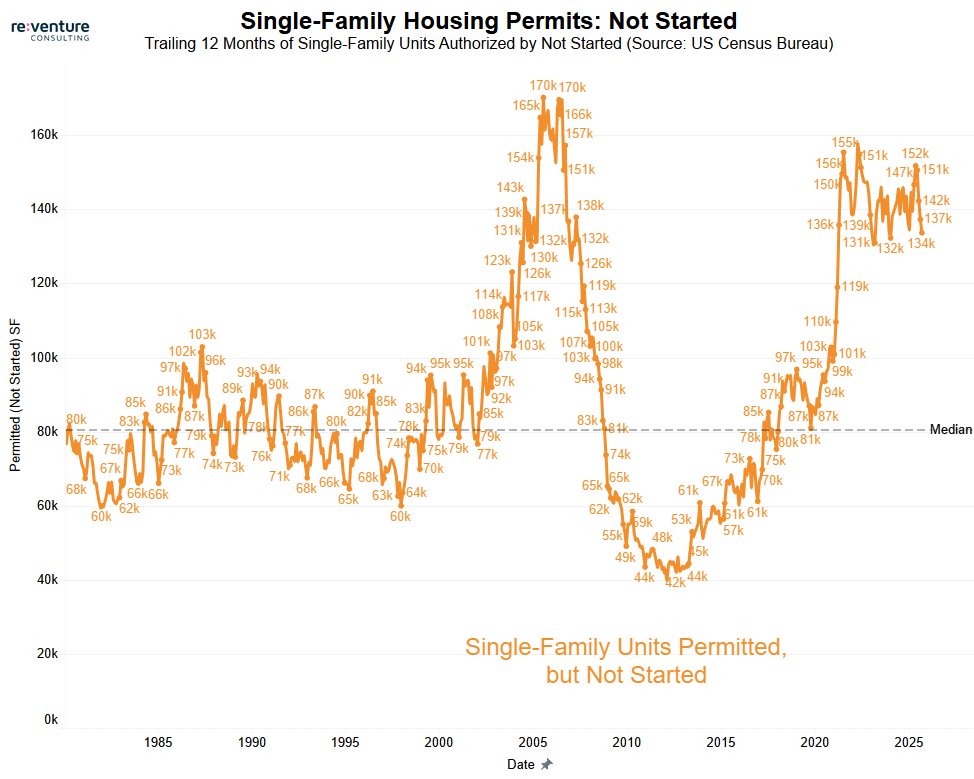
1) The permitted but not yet started metric looks similar.
There's 134,000 single-family units that builders have pulled a permit for, but haven't started.
This is down slightly from the cycle peak and is off from the 2006 high.
But is still about 70% above the long-term average.
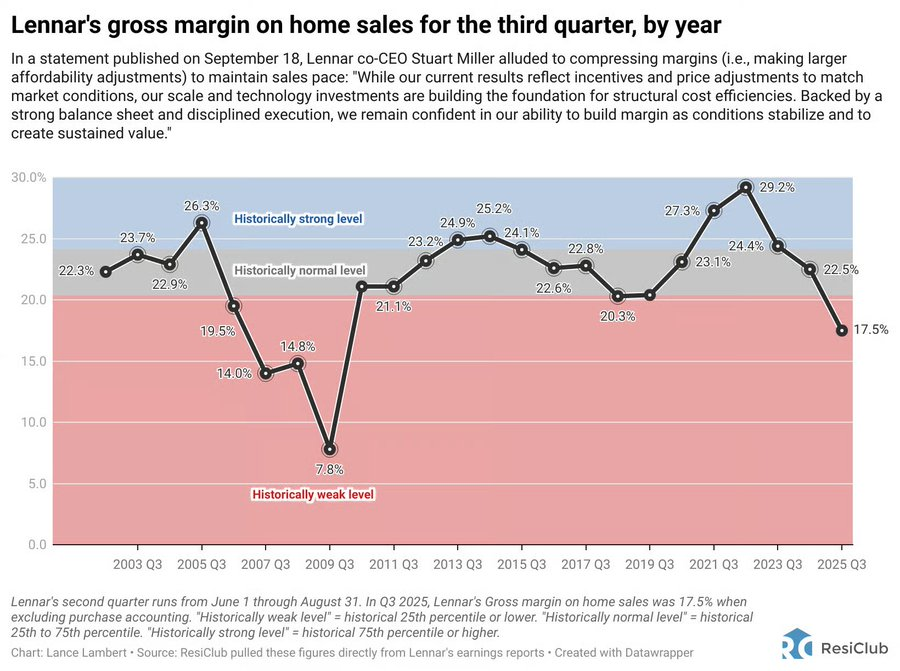
2) But the reason builders are balking at building these homes is because they aren't going to make as much selling them.
According to a graph from @NewsLambert, builder margins are being compressed, particularly Lennar, whose gross margin on selling houses is down to a 16-year low.
• • •
Missing some Tweet in this thread? You can try to
force a refresh
Home builders have 26.8% of all the homes currently listed for sale on the U.S. housing market.
The long-term average is only 15%.
While it would be great for builders to build more, we really need more existing owners to sell.
Particularly investors.
1) Home builder inventory is actually near a record high in 2025, while existing inventory is not even close to a record.
In fact, existing home inventory is not yet back to its 2019 levels.
2) Any push to get more homes listed for sale, and to sustainably increase inventory needs to focus on investors.
For instance, investors own over 15 million single-family homes in the U.S. according to the Census Bureau, while there are only 1 million homes listed for sale.
If only 10% of investors sold their houses, inventory would theoretically double.
Is anyone else concerned that the U.S. economy, and consumer spending, is now almost entirely reliant on the 2nd largest stock market bubble on record?
Long-term average Shiller P/E Ratio is 17.8x
Today we're at 39.8x.
Only time that stock market valuations were richer was in 1999.
1) Rising stock market valuations are continuing to drive consumer spending in America, with the Top 10% of U.S. households by income now driving nearly 50% of Consumer spending, according to Moody's.
2) This chart from Bloomberg shows how much the situation in spending has changed from the 1990s.
Back then, the Top 10% of Income households only accounted for 36% of consumer spending.
Today it's 50%. Meaning the U.S. economy is becoming increasingly reliant on a small share of consumers to support it.
Lennar is showing you what has to happen in the housing market to drive sales.
They've cut prices 22%. And are now below pre-pandemic pricing.
The result? Sales orders have spiked.
Lennar's margins have compressed to 17.5% as a result of the price cuts. But that's just how it goes in a housing recession - to move inventory, and sell homes, you need to accept less.
Existing home sellers would be wise to take note.
1) Lennar's new order book is 2x bigger than it was prior to the pandemic, and they're gaining a massive amount of market share.
They're essentially showing everyone in the housing market what has to happen to bring sales back.
Most people still aren't paying attention, though.
2) Most of the conventional narrative surrounding housing suggests that "prices won't drop meaningfully".
Anyone still holding onto that notion isn't paying attention to what's actually going on in the housing market.
Homebuyers are on strike. And won't be returning until they get big discounts.