🧩 Part 3 – Why you usually can’t move one curve without the other
1️⃣
So far, we’ve treated the cardiac and venous return curves as two lines that meet.
In theory, you can move one without the other – and sometimes that’s true.
But in physiology, they almost always move together – because they share the same inlet.
1️⃣
So far, we’ve treated the cardiac and venous return curves as two lines that meet.
In theory, you can move one without the other – and sometimes that’s true.
But in physiology, they almost always move together – because they share the same inlet.
2️⃣
Both curves hinge on the same gateway: the inlet to the heart.
That’s where Ivr – inlet impedance – lives.
Any change in relaxation, stiffness, or pericardial pressure alters Ivr, so both curves tend to shift together.
Both curves hinge on the same gateway: the inlet to the heart.
That’s where Ivr – inlet impedance – lives.
Any change in relaxation, stiffness, or pericardial pressure alters Ivr, so both curves tend to shift together.
3️⃣RVR vs Ivr – Anderson’s key insight:
RVR assumes static pipe resistance (captures geometry, compression but ignores compliance & timing).
Ivr represents dynamic inlet impedance (stiffness, relaxation, pericardial coupling).
RVR treats veins as plumbing; Ivr treats them as a living inlet.
When the heart stiffens or relaxes, Ivr changes – and both curves move.
4️⃣ When VR curves can move independently
↑ Pms (fluids, venoconstriction): More stressed volume → VR curve up/right, cardiac unchanged → ↑ CO, RAP unchanged initially then ↑
↑ Ivr (IVC compression / obstruction): Narrowed or occluded inlet upstream of the heart → VR curve flattens, cardiac unchanged → ↓ CO, RAP unchanged or slight ↓.
↑ Pms (fluids, venoconstriction): More stressed volume → VR curve up/right, cardiac unchanged → ↑ CO, RAP unchanged initially then ↑
↑ Ivr (IVC compression / obstruction): Narrowed or occluded inlet upstream of the heart → VR curve flattens, cardiac unchanged → ↓ CO, RAP unchanged or slight ↓.

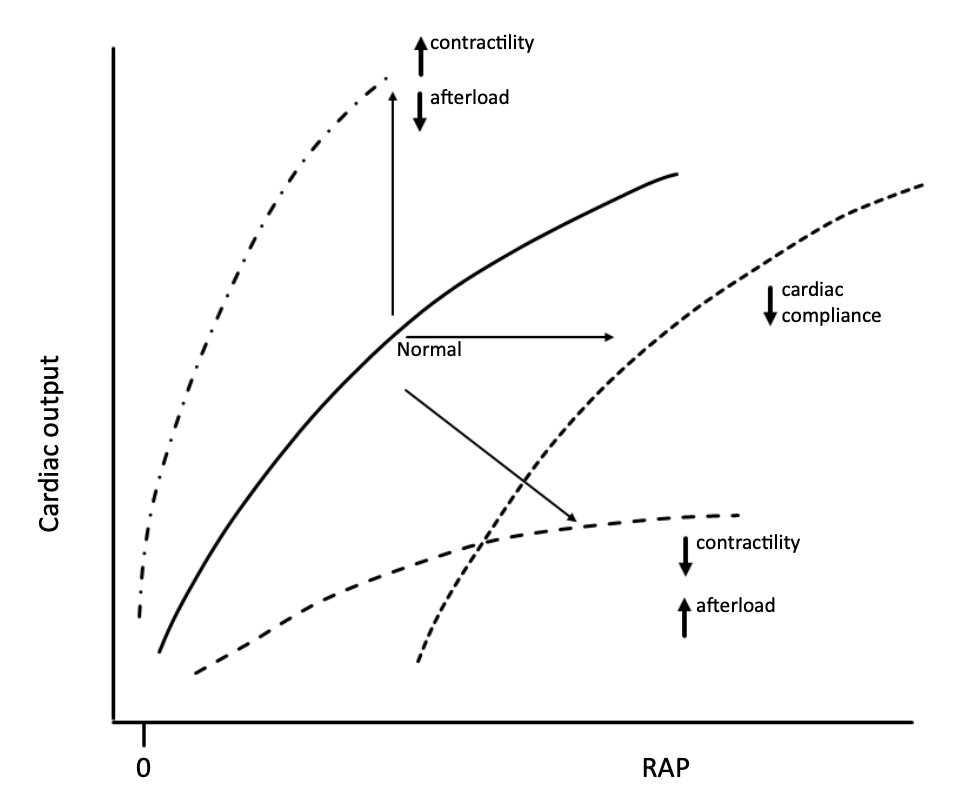
5️⃣ When curves move together (coupling)
↑ Contractility/relaxation → ↓ Ivr → Cardiac curve up, VR curve up → ↑ CO, RAP unchanged or ↓
↑ External pressure (PEEP, tamponade) → ↑ Ivr (inlet compression, reduced compliance) → Cardiac curve down, VR curve down → ↓ CO, ↑ RAP.
↓ Compliance / failure / extreme HRs and arrhythmias → ↑ Ivr → Cardiac curve down, VR curve down → ↓ CO, ↑ RAP.
6️⃣ Sympathetic stimulation — the classic example
Exercise or stress raises Pms through venoconstriction and lowers Ivr by improving relaxation, rate, and contractility.
Both curves shift upward together – higher flow, nearly constant RAP.
That’s why cardiac output can double or triple in exercise without a rise in filling pressure.
Exercise or stress raises Pms through venoconstriction and lowers Ivr by improving relaxation, rate, and contractility.
Both curves shift upward together – higher flow, nearly constant RAP.
That’s why cardiac output can double or triple in exercise without a rise in filling pressure.
7️⃣ The small caveat — cardiac performance and Ivr
It’s often taught that “contractility determines cardiac output,” but the truth is almost the opposite.
In a healthy heart, flow is set peripherally by Pms, assuming constant Ivr.
Still, improved cardiac performance – better contractility, relaxation, or rate – reduces Ivr, making the inlet easier to fill.
So output can rise slightly even without an increase in Pms.
That’s why inotropes or modest tachycardia can nudge CO upward in health – not because the heart is “pushing harder,” but because it’s easier to fill and empty each beat.
8️⃣ The deeper message
The two-curve diagram is a simplification.
In reality, the circulation behaves as a single coupled system.
The intersection – where the curves meet –
is where RAP settles as a dependent variable, automatically adjusting so inflow = outflow.
RAP doesn’t drive venous return; it reflects the balance between Pms and Ivr.
(More on that in a coming thread)
9️⃣ Clinical meaning
No intervention truly changes only Pms, afterload, or contractility – and that’s why there’s so much confusion about what really determines cardiac output.
In practice, each change also alters Ivr, shifting both curves at once.
So it’s easy to mistake correlation for causation – to think the heart “drove” a change that actually began peripherally.
That’s why fluids, vasopressors and inotropes behave differently depending on ventricular state: they reshape the inlet.
🔟 Take-home
Static diagrams make this look complex – two lines crossing, shifting, labelled with variables.
But the real system isn’t two lines at all – it’s one dynamic loop constantly finding balance.
Pms drives flow, Ivr resists it, and the heart only limits output when it can’t accept more return.
That’s the whole story.
The rest is just how the system re-equilibrates around that simple truth.
(Next time – more on why RAP doesn’t determine cardiac output.)
Start here ⬇️
https://x.com/icmteaching/status/1978755648570433999
• • •
Missing some Tweet in this thread? You can try to
force a refresh