Ancient genomes from eastern Kazakhstan reveal dynamic genetic legacy of Inner Eurasian hunter-gatherers
🧵
science.org/doi/10.1126/sc…
🧵
science.org/doi/10.1126/sc…
Archaeological site of Koken.
(A) Koken is a multiperiod site occupied since the Epipaleolithic in Abai region of eastern Kazakhstan (inset, green). The basemaps used in (A) are in the public domain and accessible through the Natural Earth website (naturalearthdata.com/downloads/10m-…; last accessed 3 March 2022). (B) Koken is situated in a semiarid steppe zone along the northern foothills of the Kokentau Mountains, and it falls within a biodiverse ecosystem of steppe grasslands, seasonal streams, birch and juniper groves, marshland, and mineral outcrops. (C) Excavation photograph of Burial 13 (KKBR13), a representative MLBA Andronovo culture cist grave surrounded by a stone fence containing the remains of individual KKN090. (D) Calibrated radiocarbon dates for individuals at Koken, showing 95.4% probability. The burials date broadly within the EN (green) and MLBA (yellow) periods. Dates were calibrated with OxCal v4.4.4 (99) using atmospheric data from Reimer et al. (55) (Photo Credit: P.D.D., Nazarbayev University).
(A) Koken is a multiperiod site occupied since the Epipaleolithic in Abai region of eastern Kazakhstan (inset, green). The basemaps used in (A) are in the public domain and accessible through the Natural Earth website (naturalearthdata.com/downloads/10m-…; last accessed 3 March 2022). (B) Koken is situated in a semiarid steppe zone along the northern foothills of the Kokentau Mountains, and it falls within a biodiverse ecosystem of steppe grasslands, seasonal streams, birch and juniper groves, marshland, and mineral outcrops. (C) Excavation photograph of Burial 13 (KKBR13), a representative MLBA Andronovo culture cist grave surrounded by a stone fence containing the remains of individual KKN090. (D) Calibrated radiocarbon dates for individuals at Koken, showing 95.4% probability. The burials date broadly within the EN (green) and MLBA (yellow) periods. Dates were calibrated with OxCal v4.4.4 (99) using atmospheric data from Reimer et al. (55) (Photo Credit: P.D.D., Nazarbayev University).
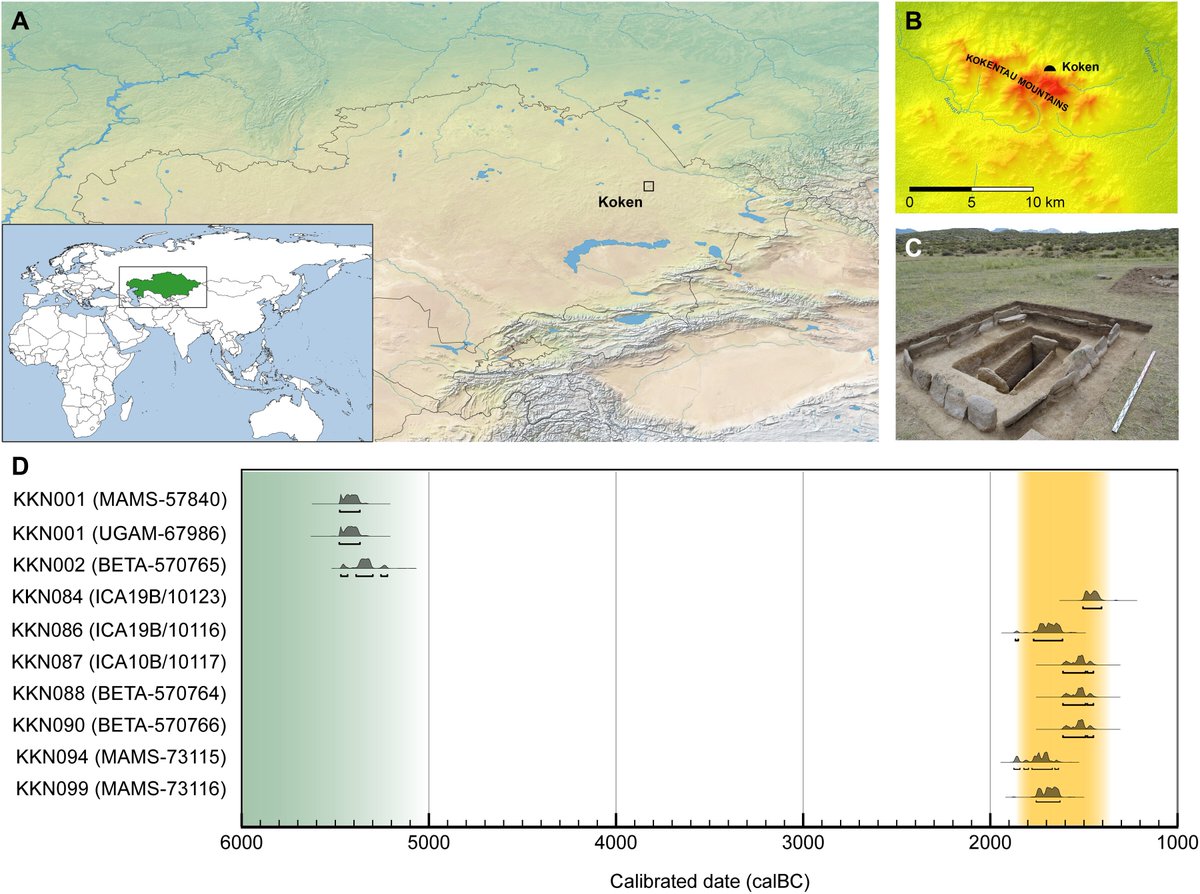
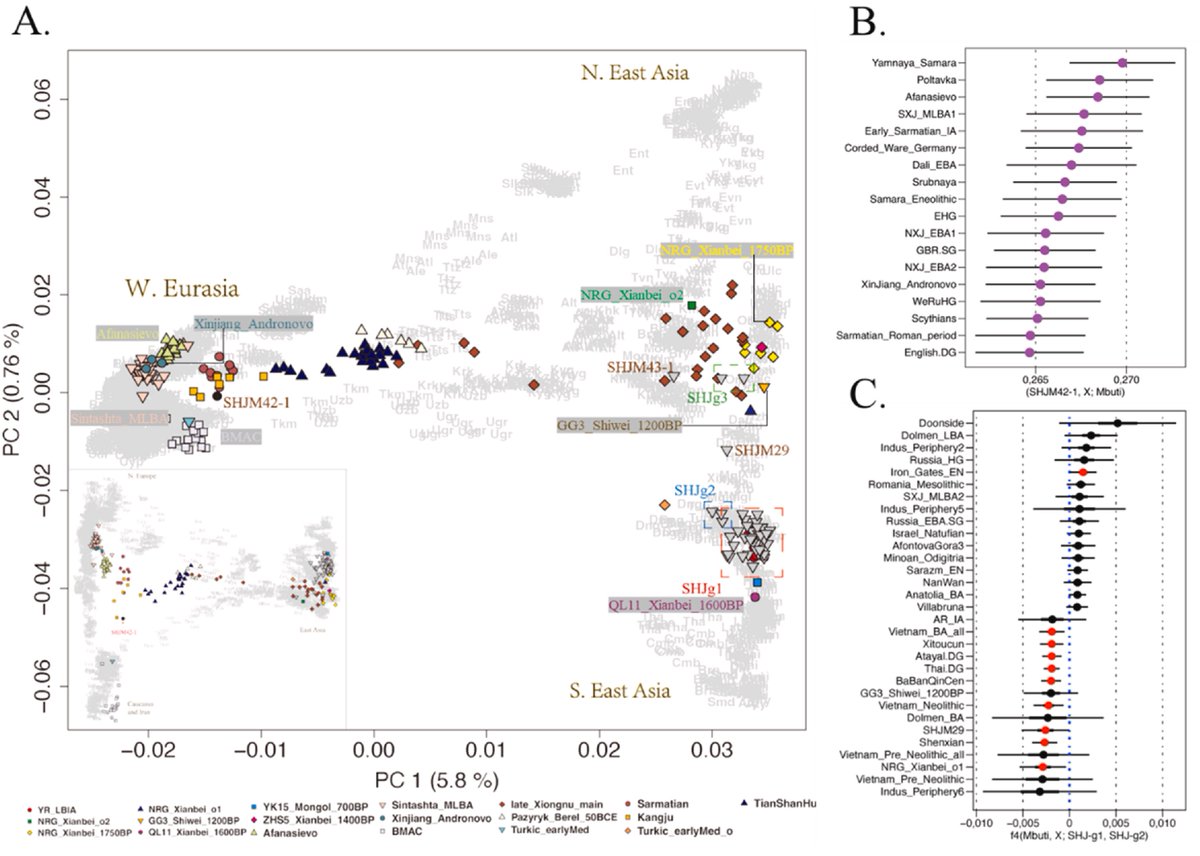
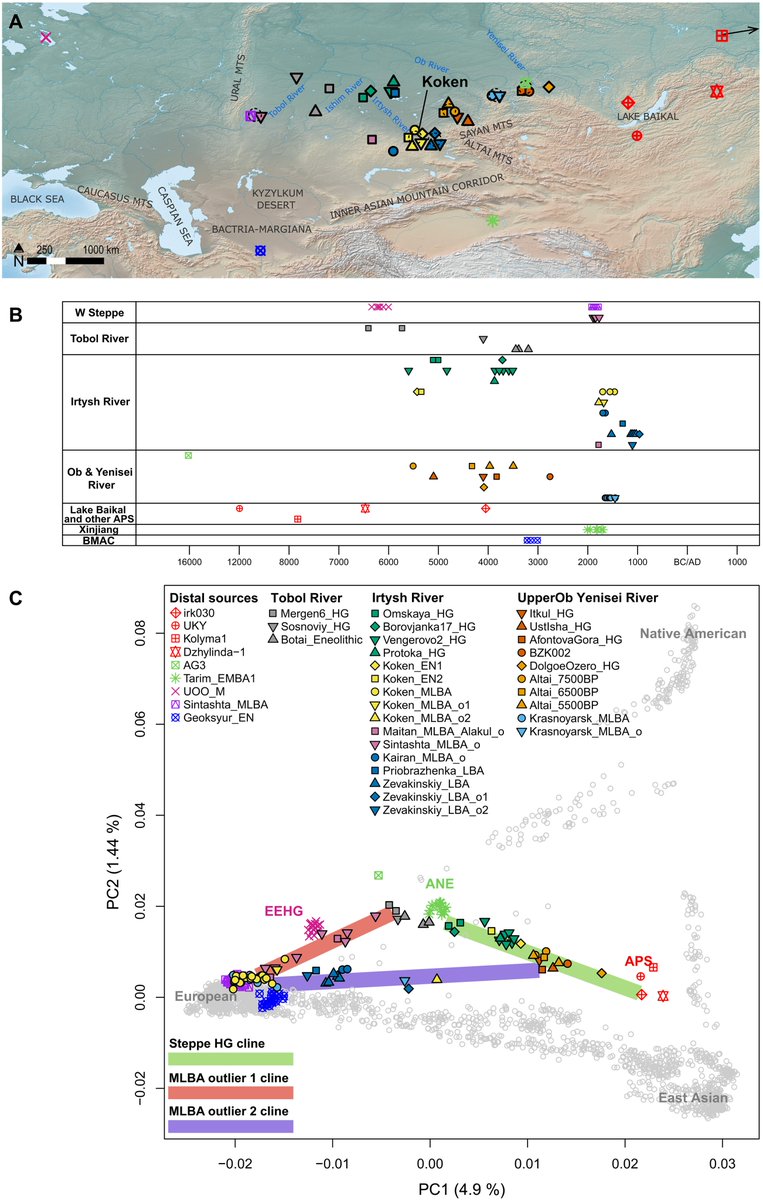
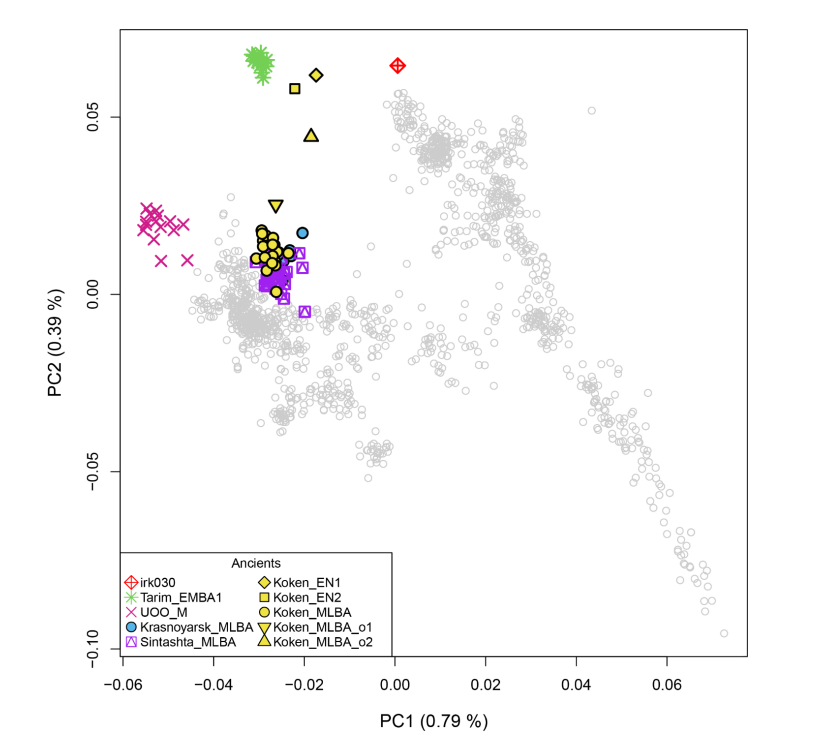
Fig. 2. Archaeological information and genetic profiles of Siberian forest-steppe hunter-gatherers analyzed in this study.
(A) Map showing locations of key ancient individuals whose genomes were analyzed in this study. The individual Kolyma_M lies beyond the geographic scope of the map; its approximate location is indicated by an arrow. The basemap used in (A) is in the public domain and accessible through the Natural Earth website (naturalearthdata.com/downloads/10m-…; last accessed 3 March 2022). (B) Radiocarbon dates of Koken and other ancient individuals analyzed in this study. BMAC, Bactria-Margiana Archaeological Complex. (C) Top two PCs were calculated from 2270 present-day Eurasian and American individuals. Gray circles mark present-day individuals used for calculating PCs. Ancient individuals, marked by color-filled symbols, were projected onto the calculated PCs. The green line marks the genetic admixture cline of prepastoralist steppe hunter-gatherers, stretching between the ANE and APS populations. The red and purple lines mark the distribution of MLBA genetic outliers, each suggesting a mixture with a distinct local population who resemble Tobol_HG (e.g., Mergen6_HG) and Irtysh_HG_2 (e.g., BZK002), respectively. Color-filled symbols used in (A) and (B) are listed in the legend in (C).
(A) Map showing locations of key ancient individuals whose genomes were analyzed in this study. The individual Kolyma_M lies beyond the geographic scope of the map; its approximate location is indicated by an arrow. The basemap used in (A) is in the public domain and accessible through the Natural Earth website (naturalearthdata.com/downloads/10m-…; last accessed 3 March 2022). (B) Radiocarbon dates of Koken and other ancient individuals analyzed in this study. BMAC, Bactria-Margiana Archaeological Complex. (C) Top two PCs were calculated from 2270 present-day Eurasian and American individuals. Gray circles mark present-day individuals used for calculating PCs. Ancient individuals, marked by color-filled symbols, were projected onto the calculated PCs. The green line marks the genetic admixture cline of prepastoralist steppe hunter-gatherers, stretching between the ANE and APS populations. The red and purple lines mark the distribution of MLBA genetic outliers, each suggesting a mixture with a distinct local population who resemble Tobol_HG (e.g., Mergen6_HG) and Irtysh_HG_2 (e.g., BZK002), respectively. Color-filled symbols used in (A) and (B) are listed in the legend in (C).
Genetic ancestry of the EN Koken individuals
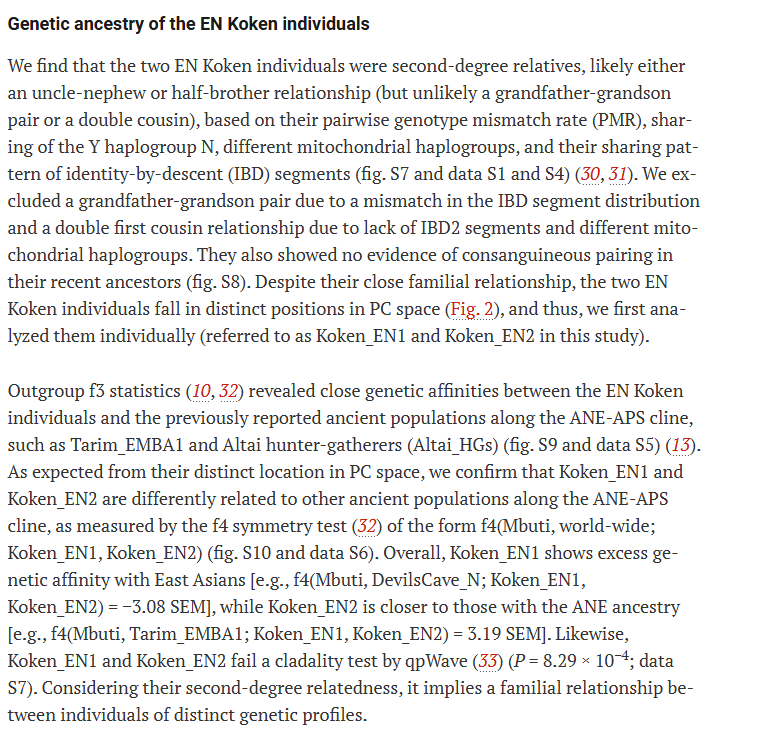
Reflecting their close kinship but distinct genetic profiles, we find that Koken_EN1 and Koken_EN2 provide a suitable proxy for the major source of each other’s admixture modeling using qpAdm

Population dynamics of Siberian forest-steppe hunter-gatherers
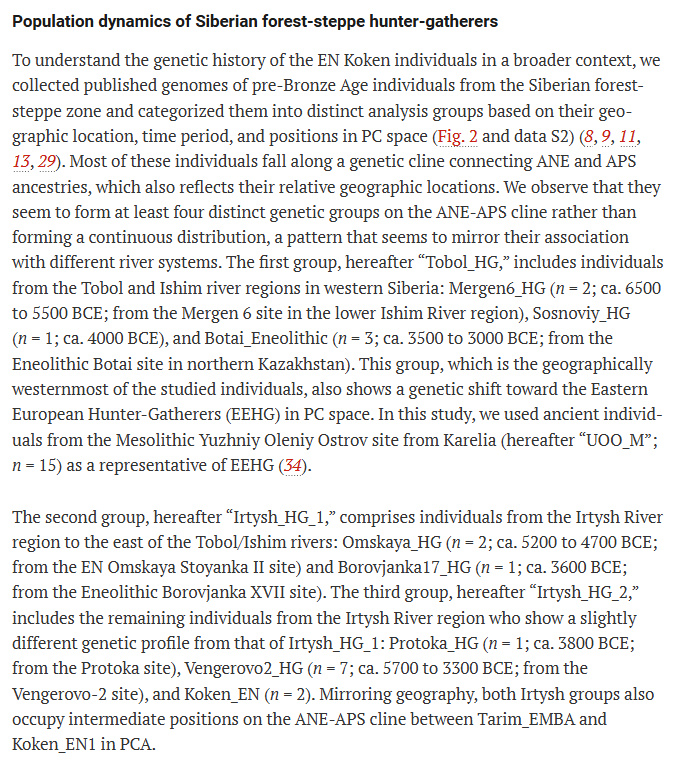
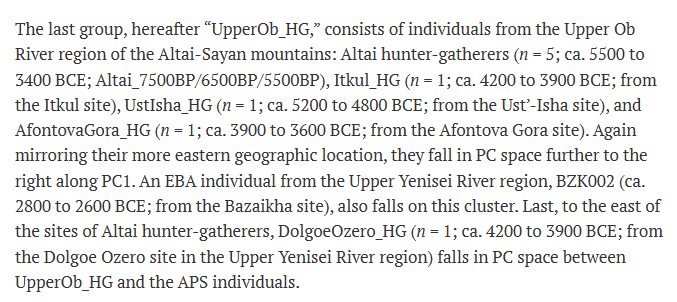
The last group, hereafter “UpperOb_HG,” consists of individuals from the Upper Ob River region of the Altai-Sayan mountains
Distal admixture modeling using qpAdm, modeling each individual as a mixture of ANE, EEHG, and APS ancestries (Fig. 3 and data S7)

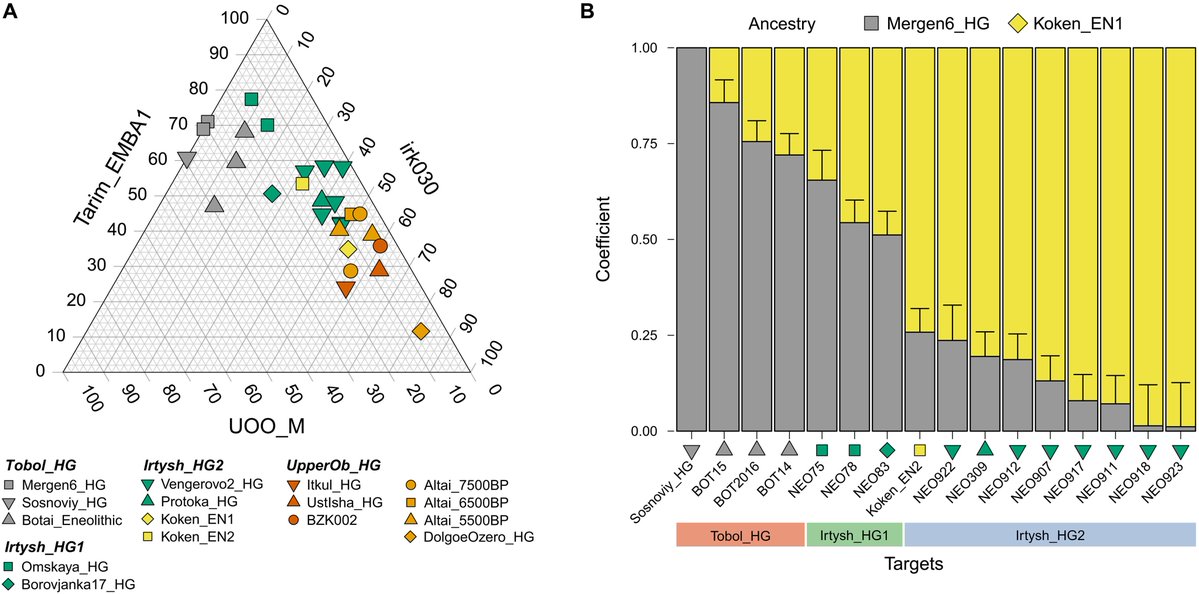
Fig. 3. QpAdm modeling of the genetic profiles of ancient Siberian forest-steppe hunter-gatherers.
(A) Distal three-way qpAdm admixture models of ancient Siberian forest-steppe hunter-gatherers from Tobol, Ishim, Irtysh, and Yenisei River regions (data S7D). Ancestry proportions attributed to ANE (Tarim_EMBA1), APS (irk030), and EEHG (UOO_M) were presented in the triangle plot. Three Tobol_HG individuals produced negative APS coefficients and were therefore plotted using reduced two-way models, ANE + EEHG. (B) Proximal two-way qpAdm models for Tobol and Irtysh hunter-gatherers (data S7F). The Sosnoviy_HG individual, which yielded a negative ancestry coefficient for Koken_EN1, was plotted using a reduced one-way qpAdm model with Mergen6_HG as the sole source. Vertical lines represent 5 cM block jackknifing standard error measures (SEM) associated with the estimated ancestry proportion. To improve visual clarity, SEM bars are displayed only on the Koken_EN1 side
(A) Distal three-way qpAdm admixture models of ancient Siberian forest-steppe hunter-gatherers from Tobol, Ishim, Irtysh, and Yenisei River regions (data S7D). Ancestry proportions attributed to ANE (Tarim_EMBA1), APS (irk030), and EEHG (UOO_M) were presented in the triangle plot. Three Tobol_HG individuals produced negative APS coefficients and were therefore plotted using reduced two-way models, ANE + EEHG. (B) Proximal two-way qpAdm models for Tobol and Irtysh hunter-gatherers (data S7F). The Sosnoviy_HG individual, which yielded a negative ancestry coefficient for Koken_EN1, was plotted using a reduced one-way qpAdm model with Mergen6_HG as the sole source. Vertical lines represent 5 cM block jackknifing standard error measures (SEM) associated with the estimated ancestry proportion. To improve visual clarity, SEM bars are displayed only on the Koken_EN1 side
Selected proxies
Since Koken_EN1 is the oldest genome without EEHG ancestry among Irtysh_HG_2 and Mergen6_HG is the oldest genome among Tobol_HG
Two distinct admixture trajectories during the Middle/Late Bronze Age dispersal of herders

Using qpAdm, central steppe_MLBA groups can be adequately modeled by Sintashta_MLBA + local hunter-gatherers with around 5% contribution from the latter (data S8B).
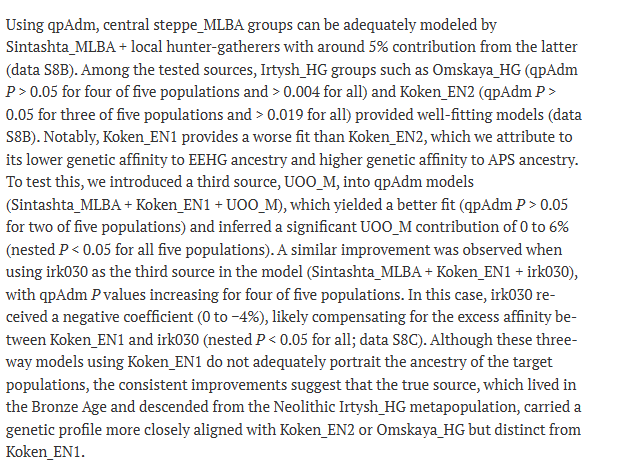
The two genetic outliers among the MLBA Koken individuals show that steppe_MLBA herders mixed with local populations along their dispersal routes to a small degree.
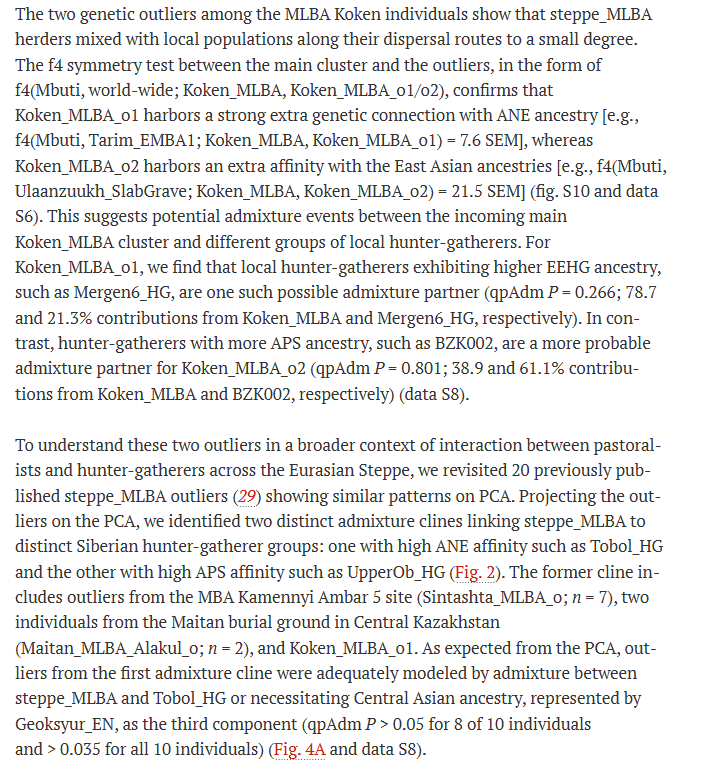
Fig. 4. Admixture patterns observed among MLBA genetic outliers.
(A) QpAdm admixture models for MLBA outliers, using subsets of six source populations marked by color-filled symbols with gray outlines. The geographic locations of the modeled MLBA outliers were marked by the color-filled symbols or the color-filled hexagons (for sites with multiple individuals; for these, site location is indicated by a hexagon, and the corresponding individuals are bounded by a box). In most cases, the extra genetic ancestry in these outliers was modeled as a mixture of either Tobol_HG (e.g., Mergen6_HG) or UpperOb_HG (e.g., BZK002). The basemap used in (A) is in the public domain and accessible through the Natural Earth website (naturalearthdata.com/downloads/10m-…; last accessed 3 March 2022). (B) Admixture dates of MLBA groups estimated by DATES. The orange-colored rectangles represent the archaeological date range, set as the union of 95.4% confidence intervals of calibrated radiocarbon dates of individuals in each group. The color-filled circles and the associated vertical lines represent the admixture date estimates and ±2 SEM estimated by the leave-one-chromosome-out approach. The admixture date was marked from the center of the archaeological date range. Orange blocks attached to the top and bottom of the ±2 SEM intervals of the admixture dates correspond to the half of the archaeological date range to portrait the total uncertainty of the admixture date estimates.
(A) QpAdm admixture models for MLBA outliers, using subsets of six source populations marked by color-filled symbols with gray outlines. The geographic locations of the modeled MLBA outliers were marked by the color-filled symbols or the color-filled hexagons (for sites with multiple individuals; for these, site location is indicated by a hexagon, and the corresponding individuals are bounded by a box). In most cases, the extra genetic ancestry in these outliers was modeled as a mixture of either Tobol_HG (e.g., Mergen6_HG) or UpperOb_HG (e.g., BZK002). The basemap used in (A) is in the public domain and accessible through the Natural Earth website (naturalearthdata.com/downloads/10m-…; last accessed 3 March 2022). (B) Admixture dates of MLBA groups estimated by DATES. The orange-colored rectangles represent the archaeological date range, set as the union of 95.4% confidence intervals of calibrated radiocarbon dates of individuals in each group. The color-filled circles and the associated vertical lines represent the admixture date estimates and ±2 SEM estimated by the leave-one-chromosome-out approach. The admixture date was marked from the center of the archaeological date range. Orange blocks attached to the top and bottom of the ±2 SEM intervals of the admixture dates correspond to the half of the archaeological date range to portrait the total uncertainty of the admixture date estimates.
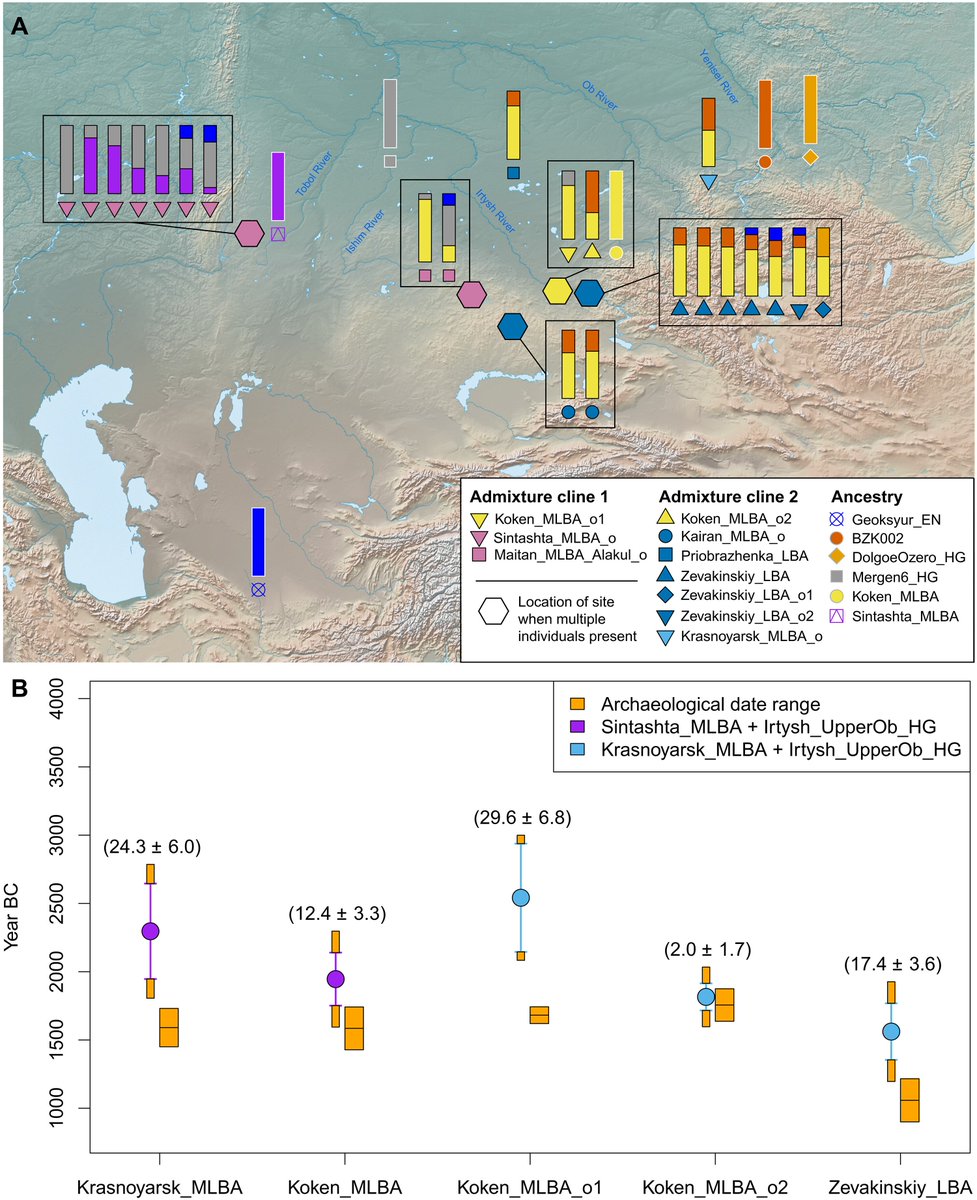
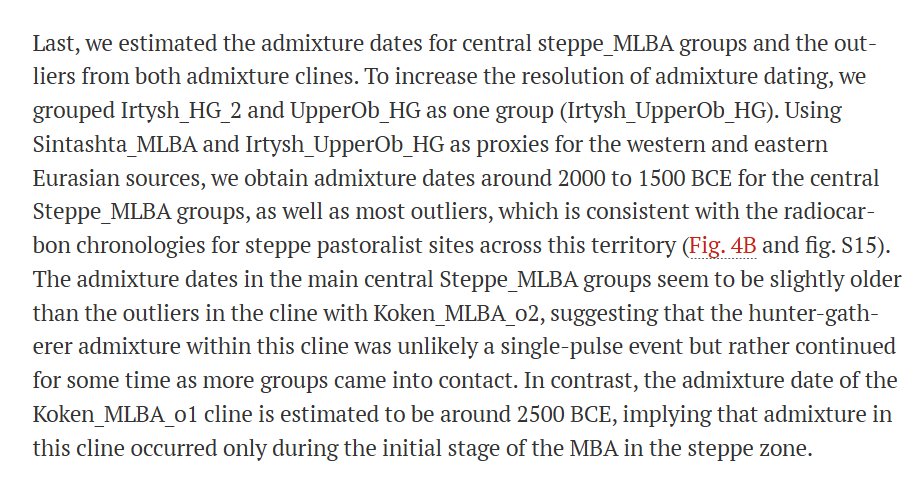
Estimated the admixture dates for central steppe_MLBA groups and the outliers from both admixture clines
Koken samples are just like Sintashta/Andronovo
• • •
Missing some Tweet in this thread? You can try to
force a refresh