Good morning ☕
Another busy week of price discovery as indices tried to recover and find direction.
Time to zoom out and get perspective with the 📈Weekly Charts📉
Another busy week of price discovery as indices tried to recover and find direction.
Time to zoom out and get perspective with the 📈Weekly Charts📉
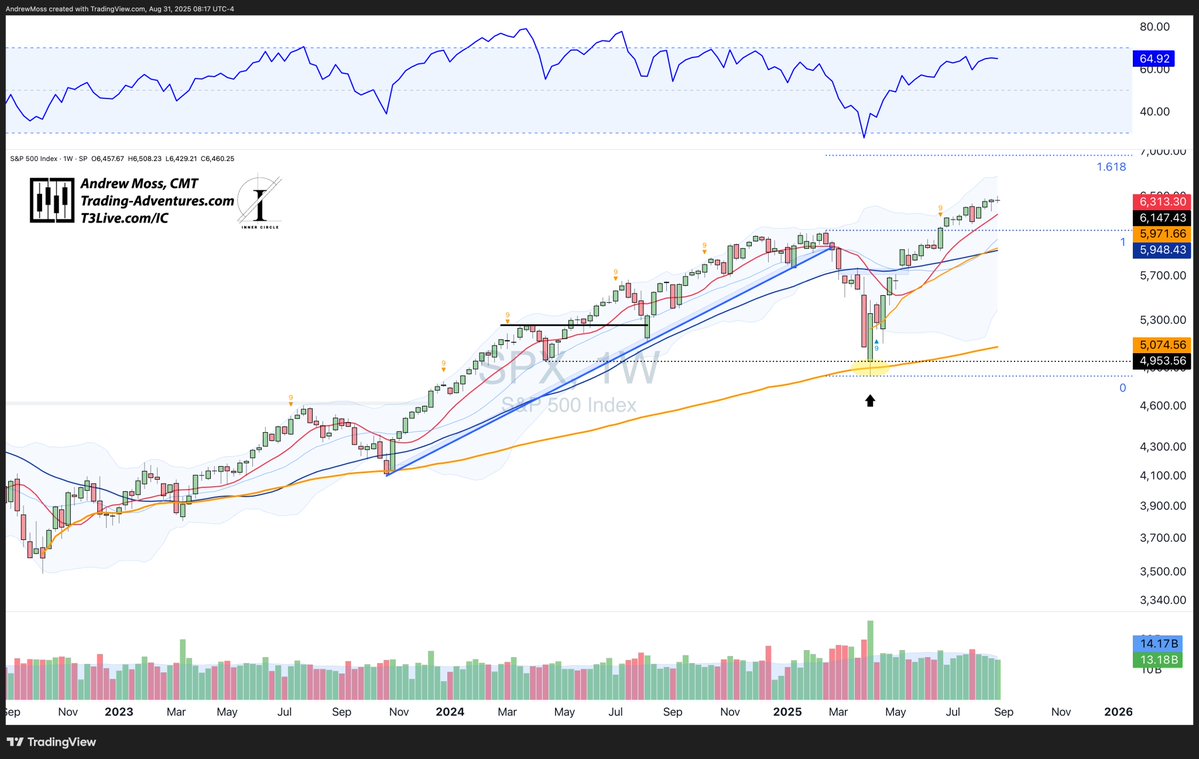
$SPX - tapped the 10-week MA early, bounced, and closed above both the new 4-week MA and the AVWAP🟠 from its last 10-week test.
🔸Still mid-range but holding firm.
🔸Volume right in line with the 20-week average.
🔸Still mid-range but holding firm.
🔸Volume right in line with the 20-week average.

$DIA
🔹More of the same — steady but uninspiring.
🔹Still hugging the 4- and 10-week MAs.
🔹Volume was very heavy this week.
🔹More of the same — steady but uninspiring.
🔹Still hugging the 4- and 10-week MAs.
🔹Volume was very heavy this week.

$IWM
🔹Led early, made a new high, but couldn’t hold it.
🔹Closed right on the 4-week MA.
🔹Volume slightly above average — leadership attempt faded into Friday.
🔹Led early, made a new high, but couldn’t hold it.
🔹Closed right on the 4-week MA.
🔹Volume slightly above average — leadership attempt faded into Friday.

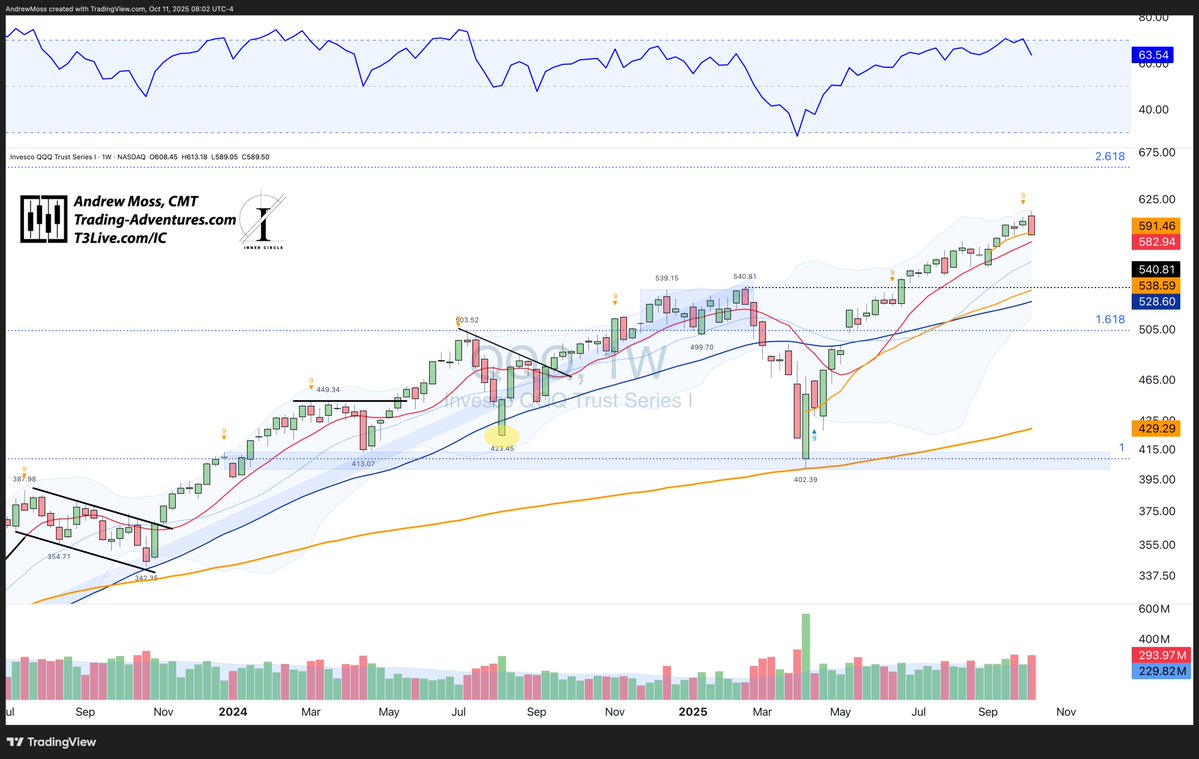
$QQQ
🔹Closed the week at a new all-time high by 75¢.
🔹Traded higher early, reversed, then finished strong.
🔹Volume slightly heavier than average.
🔹Closed the week at a new all-time high by 75¢.
🔹Traded higher early, reversed, then finished strong.
🔹Volume slightly heavier than average.

Quick note - yes, the 4-week MA is a new addition to the charts. 4-week = 20-days. It's the thin black line.
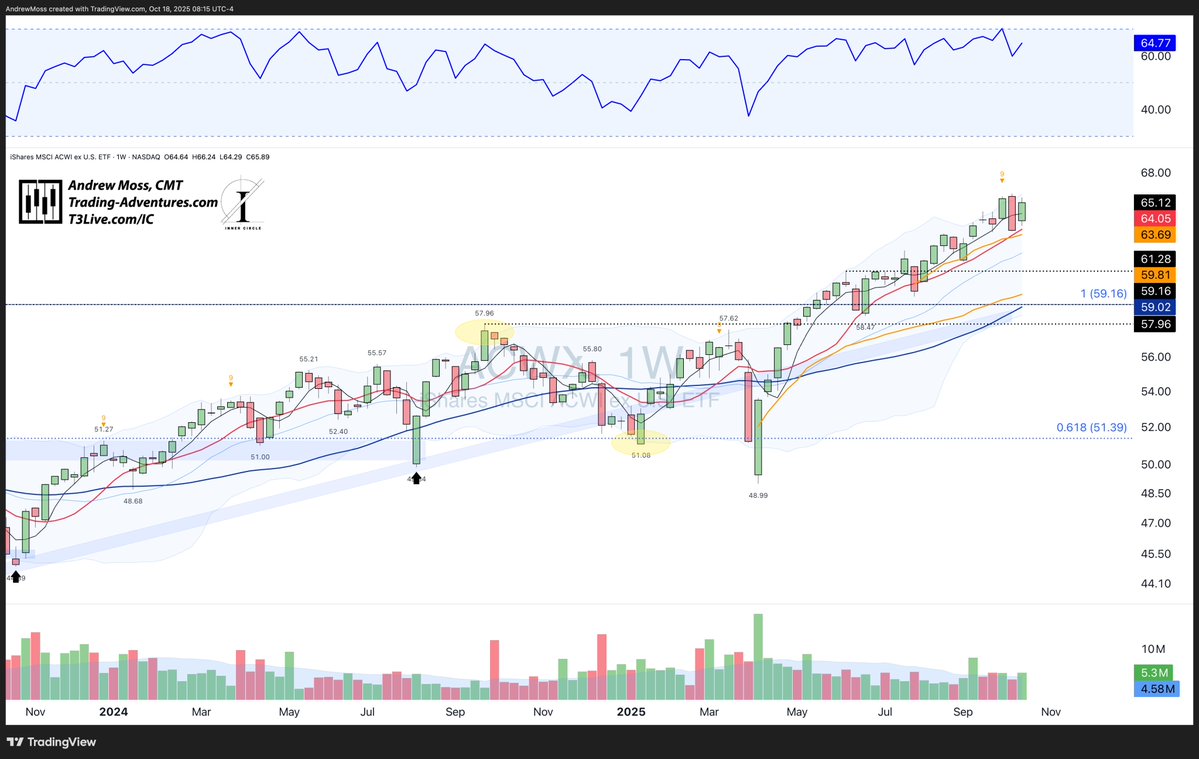
$ACWX
The Rest of the World repaired much of last week’s damage, moving back near recent highs on rising volume back above its 20-week average.
The Rest of the World repaired much of last week’s damage, moving back near recent highs on rising volume back above its 20-week average.
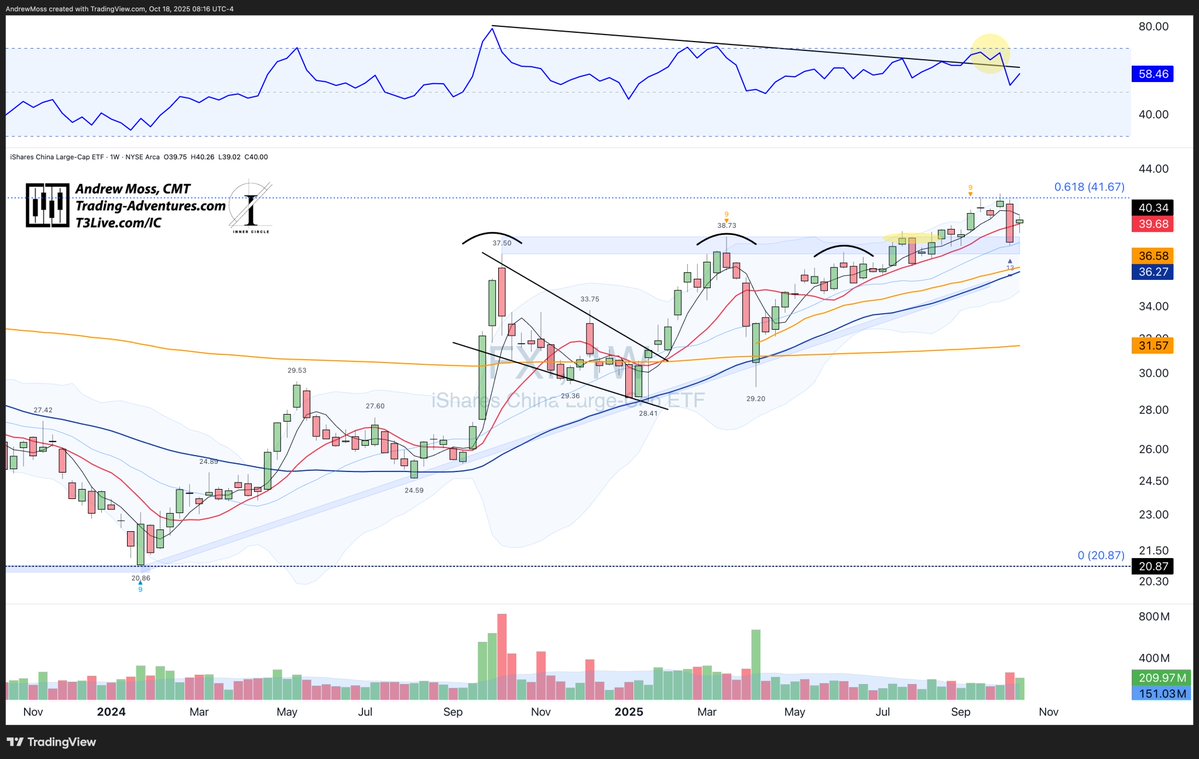
$FXI
Printed a spinning-top doji (indecision) between the 4- and 10-week MAs — right in the middle of last week’s selloff range.
Volume roughly 2× average.
Printed a spinning-top doji (indecision) between the 4- and 10-week MAs — right in the middle of last week’s selloff range.
Volume roughly 2× average.
Bonds
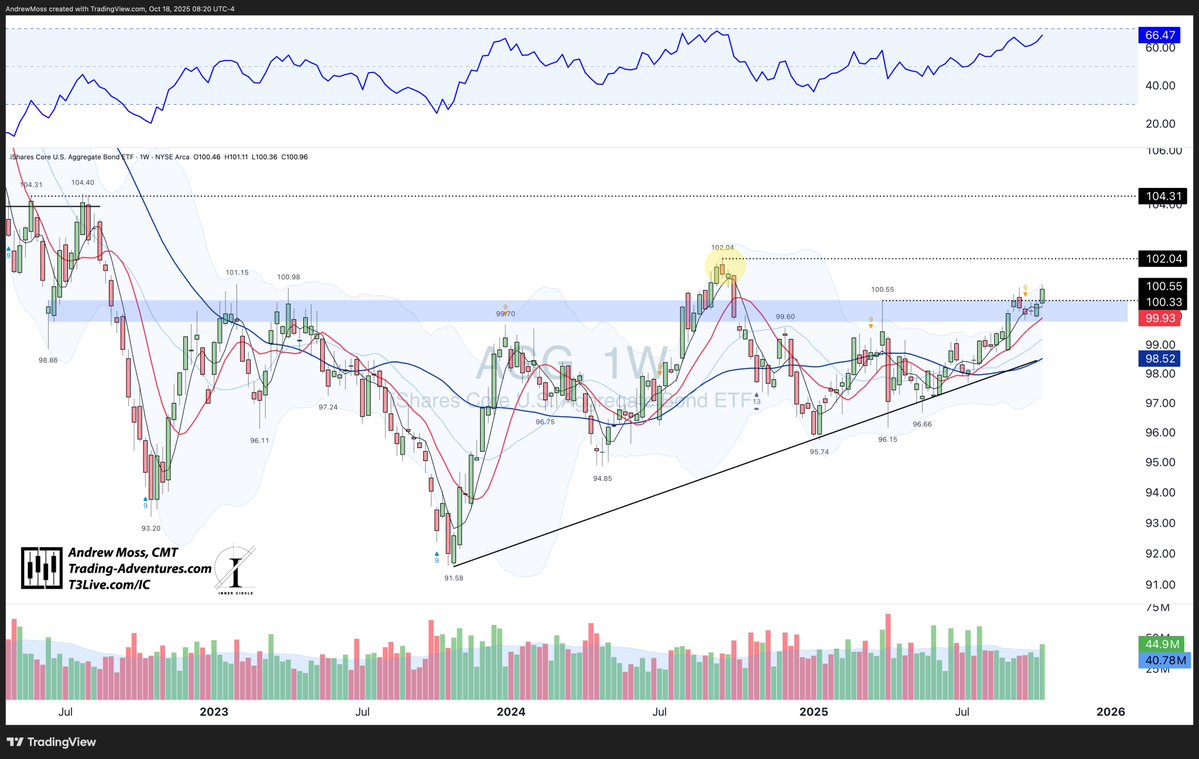
$AGG broke higher from consolidation.
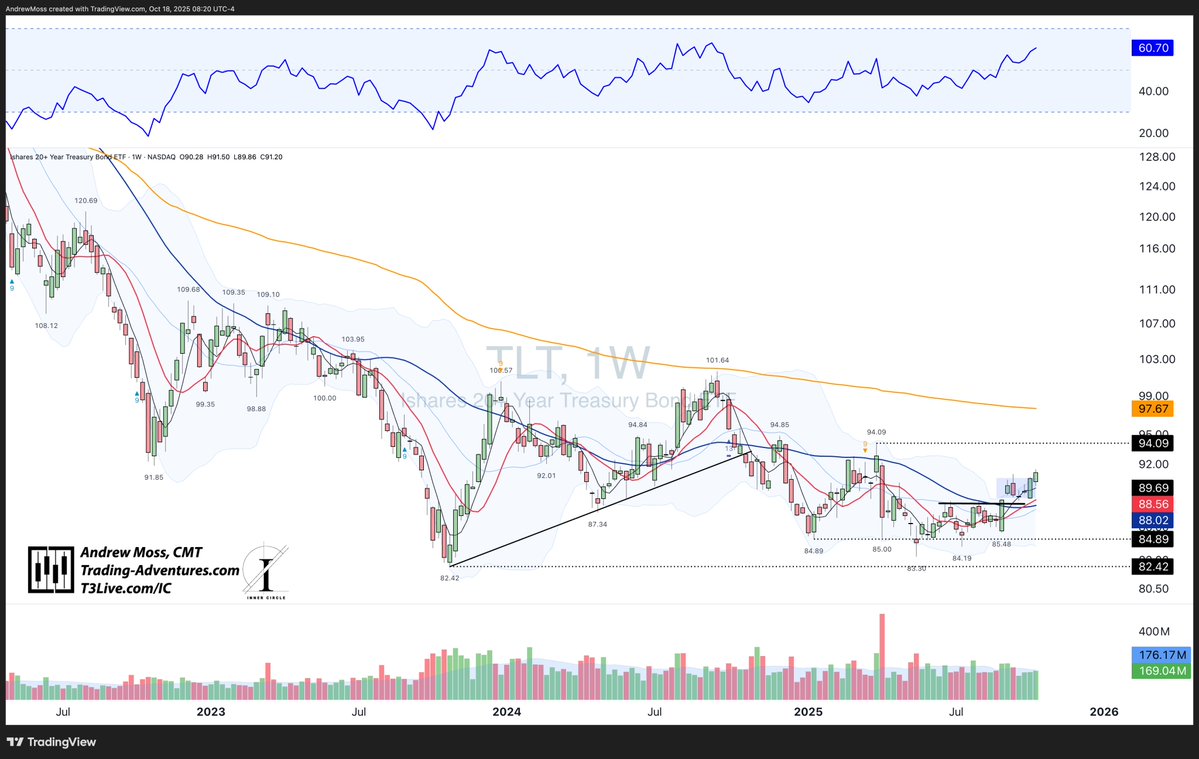
$TLT followed — up and out, though not as far.
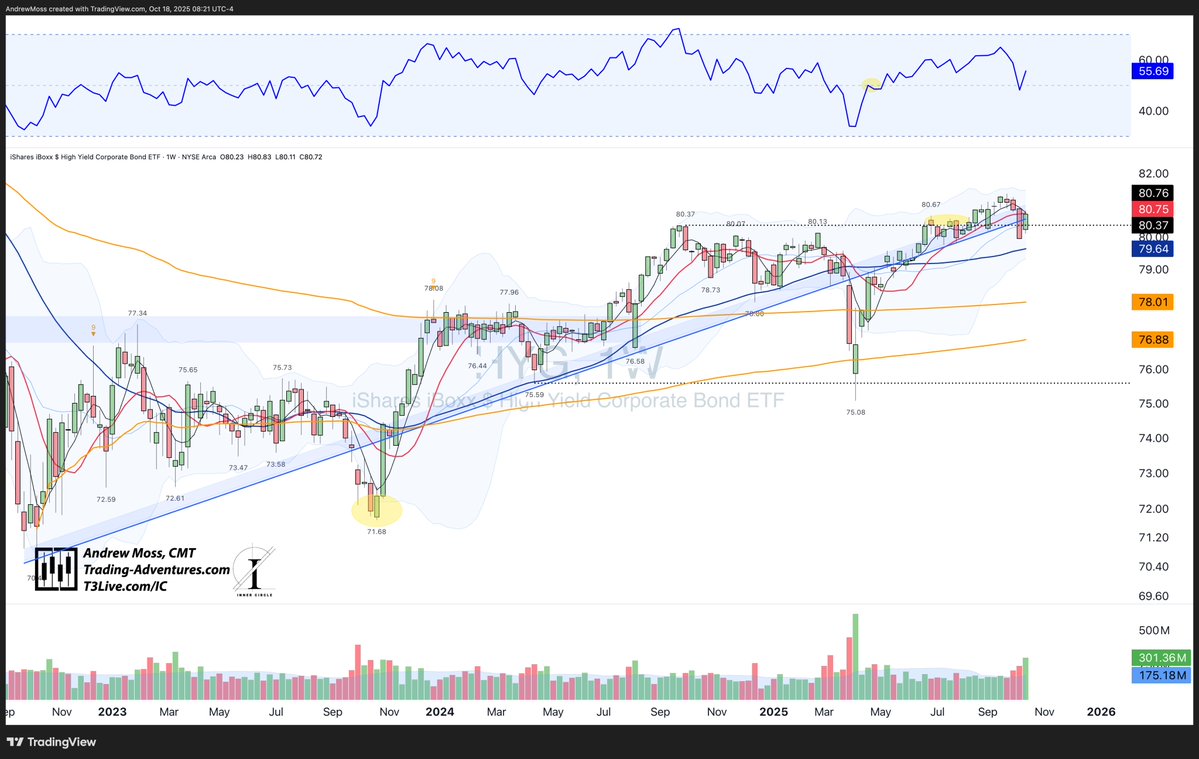
$HYG recovered most of last week’s losses but finished just under the 10-week MA.
$AGG broke higher from consolidation.
$TLT followed — up and out, though not as far.
$HYG recovered most of last week’s losses but finished just under the 10-week MA.
$DXY / U.S. Dollar
Spent another week testing resistance at 99.25, while also visiting its 10-week MA below.
Spent another week testing resistance at 99.25, while also visiting its 10-week MA below.

Crypto
$BTC hit its 40-week MA and Fib extension near 103K, bounced to $107K
$ETH retesting pivot-low anchored VWAP — bull flag is still there, but getting old and weak.
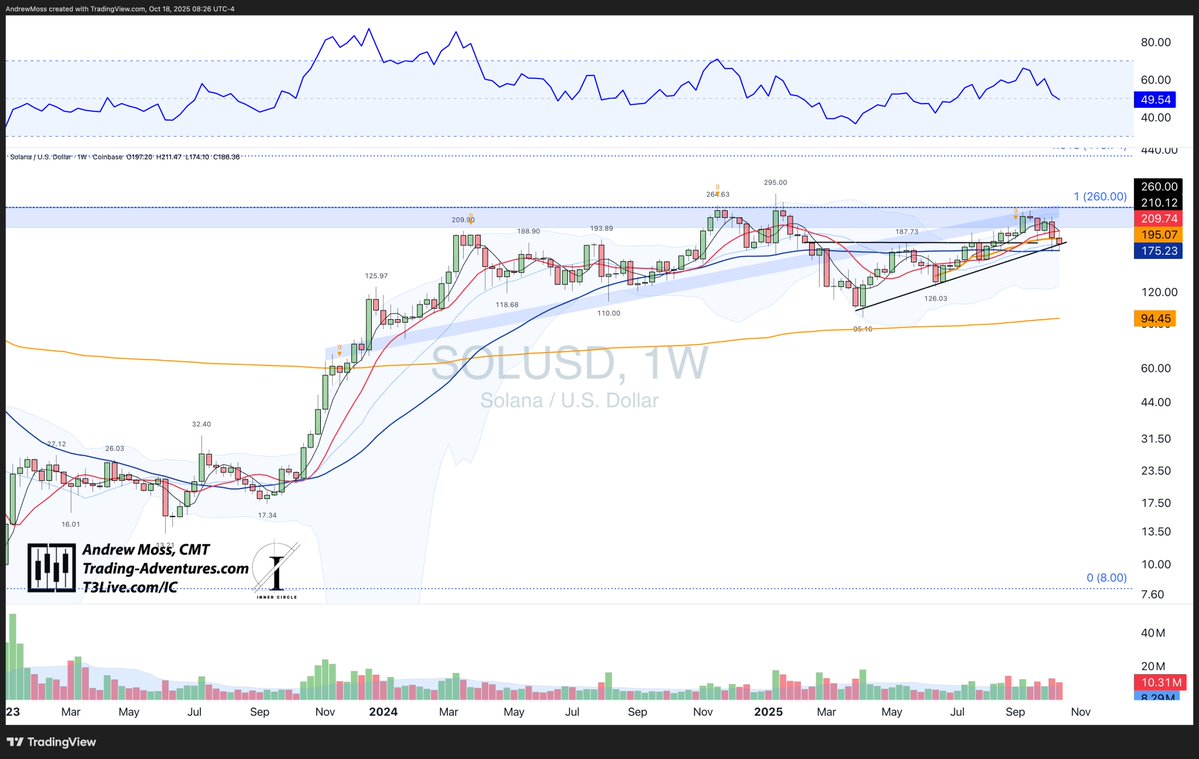
$SOL testing trendline support near 187.
$BTC hit its 40-week MA and Fib extension near 103K, bounced to $107K
$ETH retesting pivot-low anchored VWAP — bull flag is still there, but getting old and weak.
$SOL testing trendline support near 187.


Gold and Silver were headliners at the commodity concert.
$GLD put in its 7th week of 'gap and go' action. Yes, since the breakout near $319, this ETF has gapped up and moved higher every week so far. 😮
And it's done so on MASSIVE volume. That's power.💪
$GLD put in its 7th week of 'gap and go' action. Yes, since the breakout near $319, this ETF has gapped up and moved higher every week so far. 😮
And it's done so on MASSIVE volume. That's power.💪

But, to say it is now very extended could be the understatement of the year.
🔹Weekly RSI > 85
🔹15% above the 10-week MA
🔹4-week MA and price parabolic
🔹DeMark 9 sell setup
All of those factors suggest some rest and pullback for the shiny metal. Doesn't have to be THE top. But this pace can't continue forever.
🔹Weekly RSI > 85
🔹15% above the 10-week MA
🔹4-week MA and price parabolic
🔹DeMark 9 sell setup
All of those factors suggest some rest and pullback for the shiny metal. Doesn't have to be THE top. But this pace can't continue forever.
$SLV is in the same boat.
Potential topping/reversal candle with all the other factors mentioned on $GLD too.
Potential topping/reversal candle with all the other factors mentioned on $GLD too.

And, just in case you want to see the two combined, the usual $DBP chart.
Same picture. Potential pullback for Precious Metals.
Same picture. Potential pullback for Precious Metals.

$DBB continued higher as well, but reversed a little harder.

Relative Strength
$IWF / $IWD - High-level consolidation continues
$IWF / $IWD - High-level consolidation continues

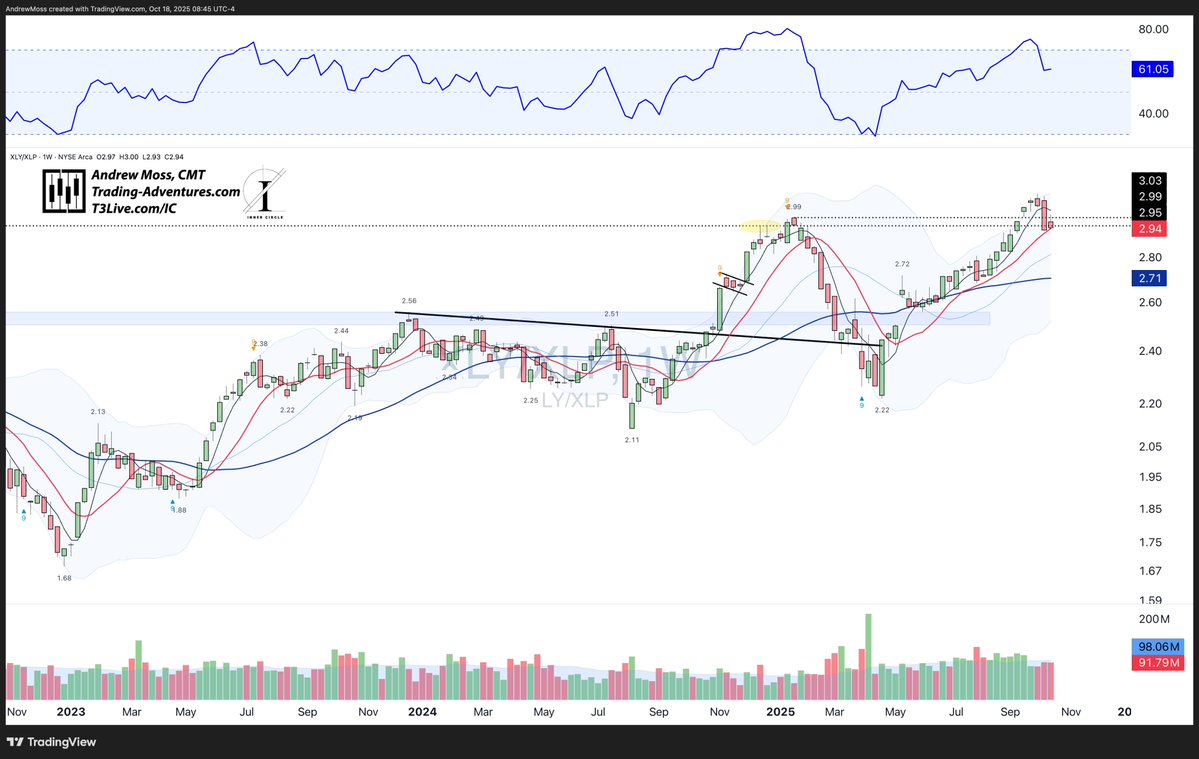
$XLY / $XLP – Inside week near 10-week MA and the lower end of last week's range.
$SPHB / $SPLV – Still choppy and widening, but holding up well.
$SPHB / $SPLV – Still choppy and widening, but holding up well.

Breadth
% of $SPX stocks above 50 and 200-day MA ticked up slightly.
% of $SPX stocks above 50 and 200-day MA ticked up slightly.

Bullish Percent Indices all added to the columns of Os and are all in 'Bear Confirmed' status.
$BPSPX
$BPNDX
$BPNYA
$BPSPX
$BPNDX
$BPNYA


🧭 Now What?
Last week’s selloff met decent repair this week, even with a volatility spike.
The key, that volatility also crashed quickly.
$VIX daily
Last week’s selloff met decent repair this week, even with a volatility spike.
The key, that volatility also crashed quickly.
$VIX daily

Seasonally, $SPX tends to dip mid-October before the year-end rally.
The 2025 line (blue) sits right on that seasonal trough — the sharp drop in the dotted white line, the average of recent years.
Maybe we front-ran that seasonal dip.
Maybe not.
The 2025 line (blue) sits right on that seasonal trough — the sharp drop in the dotted white line, the average of recent years.
Maybe we front-ran that seasonal dip.
Maybe not.

• • •
Missing some Tweet in this thread? You can try to
force a refresh