This was a complex/nuanced discussion on "overcapacity". Thanks for writing it @wstv_lizzi as it is an important topic.
It presented a number of interesting ideas which make sense on their own but I struggled to tie them together under a "grand unifying narrative" related to the "China Model".
The challenge of the "overcapacity" narrative is trying to use it to summarize "China Model" into a neat, compact narrative. But trying to summarize something as complex as China's economy into a neat model is exceedingly difficult.
(as an aside, the piece read like a writer struggling to force-fit an article within pre-defined narratives/framing set by an editor)
Two key problems I've found in the "overcapacity" debate that I'll go into more detail in this 🧵:
1⃣ Unclear/conflated definition of the term "overcapacity"
2⃣ As you drill down down from the macro/national level to individual sector level, you find many sector-specific idiosyncrasies that contradict core elements of "grand unifying" theme around "overcapacity".
1⃣ Defining "overcapacity" itself
"Overcapacity" has become a loaded word, especially when described in the context of the broad "China Model" in the current geopolitical environment.
In regular industrial/manufacturing usage, overcapacity is simply a state/condition where capacity utilization is below a certain "normal" threshold. This threshold may very by sector and different operating conditions.
Standard capacity utilization is defined not only by physical capital stock, but also by an active labor force operating on a normal shift schedule (typically 2 shifts per day, 5 days per week, or 80 hours / week).
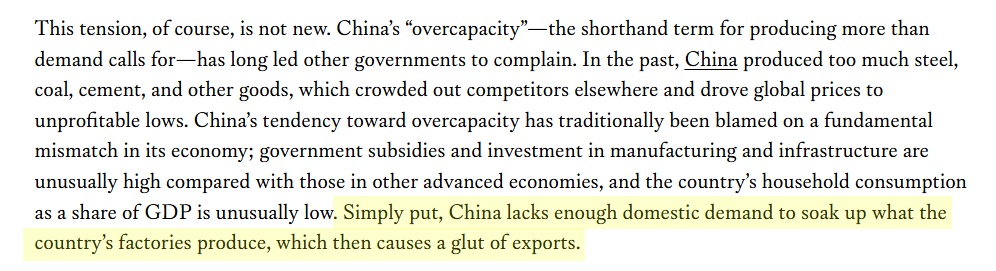
But the way that it is being used in policy/economic/geopolitical discussion is in a much more undefined/amorphous way that goes well beyond the standard industry/mfg definition.
For instance, in this passage it is implicitly defined as production beyond domestic demand. But the implication here is that Chinese companies should not be able to have free access to global markets.
IOW how the term is used/defined appears to reflect implicit policy objectives of one particular side in the ongoing trade war.
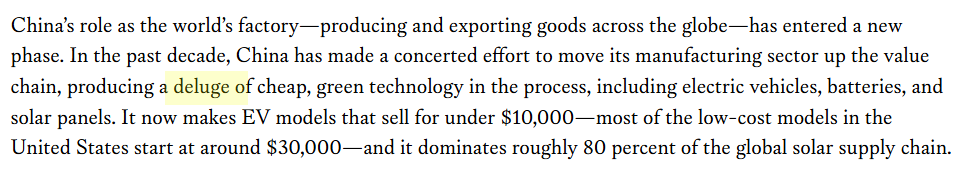
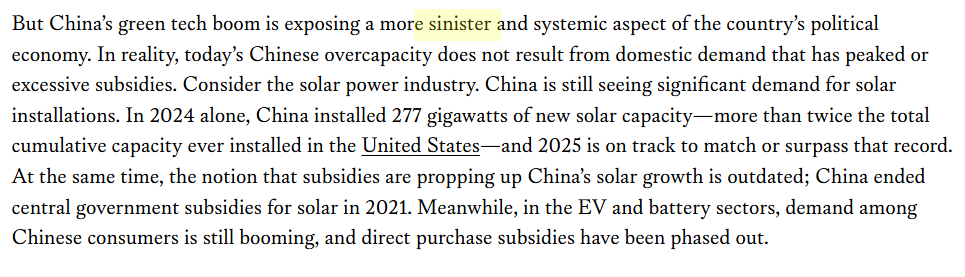
Carefully inserted vocabulary like "deluge" and "sinister" peppered throughout the piece subtly signal how "overcapacity" is being normatively framed.
For instance, in this passage it is implicitly defined as production beyond domestic demand. But the implication here is that Chinese companies should not be able to have free access to global markets.
IOW how the term is used/defined appears to reflect implicit policy objectives of one particular side in the ongoing trade war.
Carefully inserted vocabulary like "deluge" and "sinister" peppered throughout the piece subtly signal how "overcapacity" is being normatively framed.
I have highlighted this issue of conflating the standard well-understood definition of "overcapacity" with this broader more expansive use of the term.
https://x.com/GlennLuk/status/1909211475740176580
Other respected analysts like Arthur Kroeber have also highlighted the same definitional/usage problem with the term "overcapacity".
https://x.com/GlennLuk/status/1816176032715792651
2⃣ Sector-specific vs. national-level
My tendency to drill down into industries was another reason the discussion on "overcapacity" is so problematic for me.
Using the more standard definition, it is not a universal problem as we look at different Chinese sectors.
My tendency to drill down into industries was another reason the discussion on "overcapacity" is so problematic for me.
Using the more standard definition, it is not a universal problem as we look at different Chinese sectors.
As noted before, Beijing does not shy away from the term when used under the standard definition.
It clearly highlighted "severe excess capacity" in the steel sector in the mid-2010s and undertook significant sector reforms to combat the issue.
It clearly highlighted "severe excess capacity" in the steel sector in the mid-2010s and undertook significant sector reforms to combat the issue.
https://x.com/GlennLuk/status/1793633720424902945
There are real excess capacity issues in the ICE sector, a result of the unexpectedly rapid transition to EVs obsoleting many formerly productive ICE models and their respective assembly lines in the factory.
Ofc the irony in the context of the "China Model" is that this excess capacity is primarily concentrated in the operations of foreign JVs which (i) did not invest in viable EV models and (ii) were specifically structured to serve the domestic market (e.g. China-specific models), making it difficult to divert available factory production to export markets.
In other words, these real overcapacity issues have nothing to do with the "China Model" at all.
It also matters how you define and calculate overcapacity.
In rapidly growing industries like EVs, it makes little sense to calculate capacity utilization on the basis of trailing demand compared to projected future capacity.
In rapidly growing industries like EVs, it makes little sense to calculate capacity utilization on the basis of trailing demand compared to projected future capacity.
https://x.com/GlennLuk/status/1861813497908154517
Automakers build new capacity on the basis of forward demand projections.
EVs are growing ~30% YoY and the only way to keep up with this kind of momentum is to build supply ahead of demand.
Building capacity ahead of demand is not "overcapacity".
EVs are growing ~30% YoY and the only way to keep up with this kind of momentum is to build supply ahead of demand.
Building capacity ahead of demand is not "overcapacity".
For commodity sectors like solar, there's both rapidly increasing underlying demand + notorious cyclicality.
Companies in highly cyclical sectors consider "through the cycle" demand when building out capacity. They expect utilization to fluctuate.
Companies in highly cyclical sectors consider "through the cycle" demand when building out capacity. They expect utilization to fluctuate.
https://x.com/GlennLuk/status/1793633726997369115
3⃣ Production capacity and the nature of competition
There is also no universal standard for what constitutes an appropriate target capacity utilization threshold for an industry.
Ultimately, companies compete with each other for market share and production capacity is only one component of how they compete.
The cost of production capacity shows up in the form of accounting depreciation, which attempts to match the upfront costs of capitalized expenditures to the use of that asset over time.
How capital assets are depreciated will vary from industry to industry based on the different types of asset categories used in the production and distribution of assets.
So the standard threshold in one industry like EVs might be different than in a commodity product like steel or solar PV.
So the standard threshold in one industry like EVs might be different than in a commodity product like steel or solar PV.
Depreciation is only one component of cost of goods sold and operating costs.
The proportion of depreciation within broad expenditures can reflect its importance as a competitive differentiator in that particular sector.
The proportion of depreciation within broad expenditures can reflect its importance as a competitive differentiator in that particular sector.
For example, depreciation is a very large cost factor in chip manufacturing, especially for advanced nodes where the cost of a single lithography machine can be in the hundreds of millions.
But it is relatively low in the production of a high-value consumer electronic good like the iPhone, where most most of the value is in the assembled technology components like the SoC, memory, camera module and screen.
But it is relatively low in the production of a high-value consumer electronic good like the iPhone, where most most of the value is in the assembled technology components like the SoC, memory, camera module and screen.
The point is that you cannot point to "overcapacity" as a universal explanation for the "China Model".
How the actual "China Model" manifests itself in all its strengths and weaknesses depend on the specific sector or segment of the value chain we are talking about.
"Overcapacity" might be the output of the "China Model" in some sectors but not in others.
How the actual "China Model" manifests itself in all its strengths and weaknesses depend on the specific sector or segment of the value chain we are talking about.
"Overcapacity" might be the output of the "China Model" in some sectors but not in others.
• • •
Missing some Tweet in this thread? You can try to
force a refresh