📊Daily recap
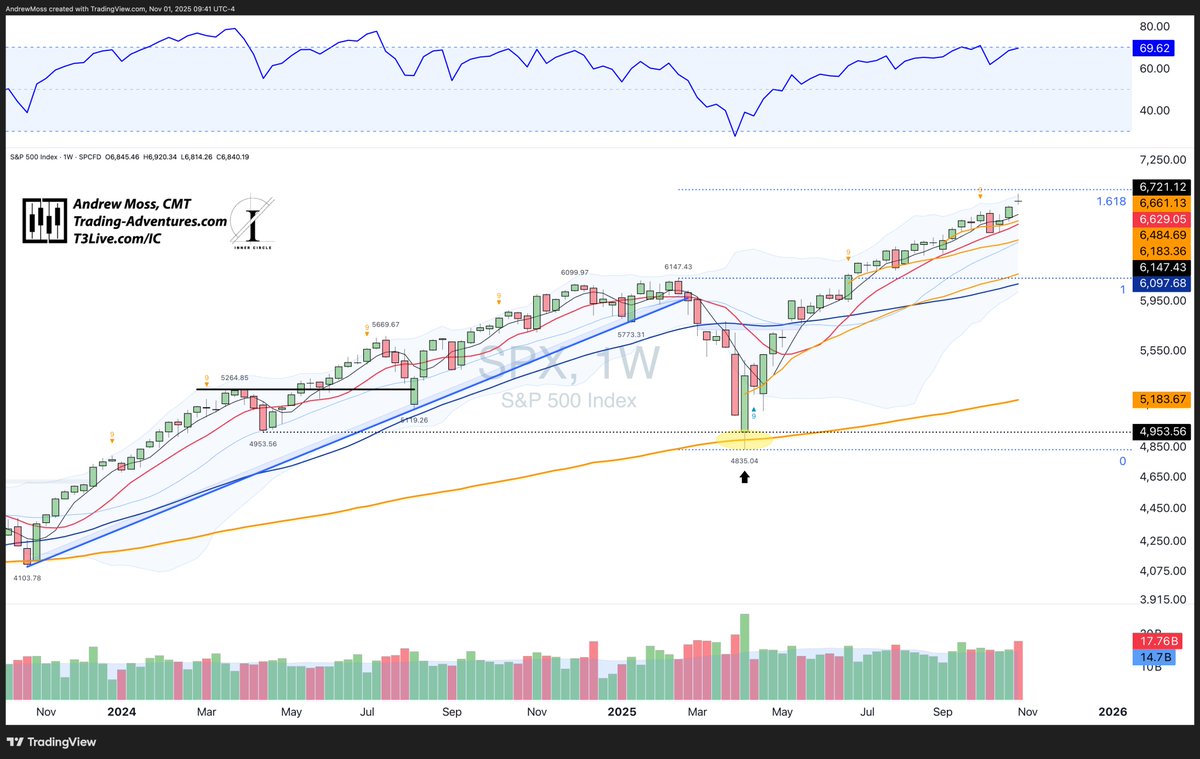
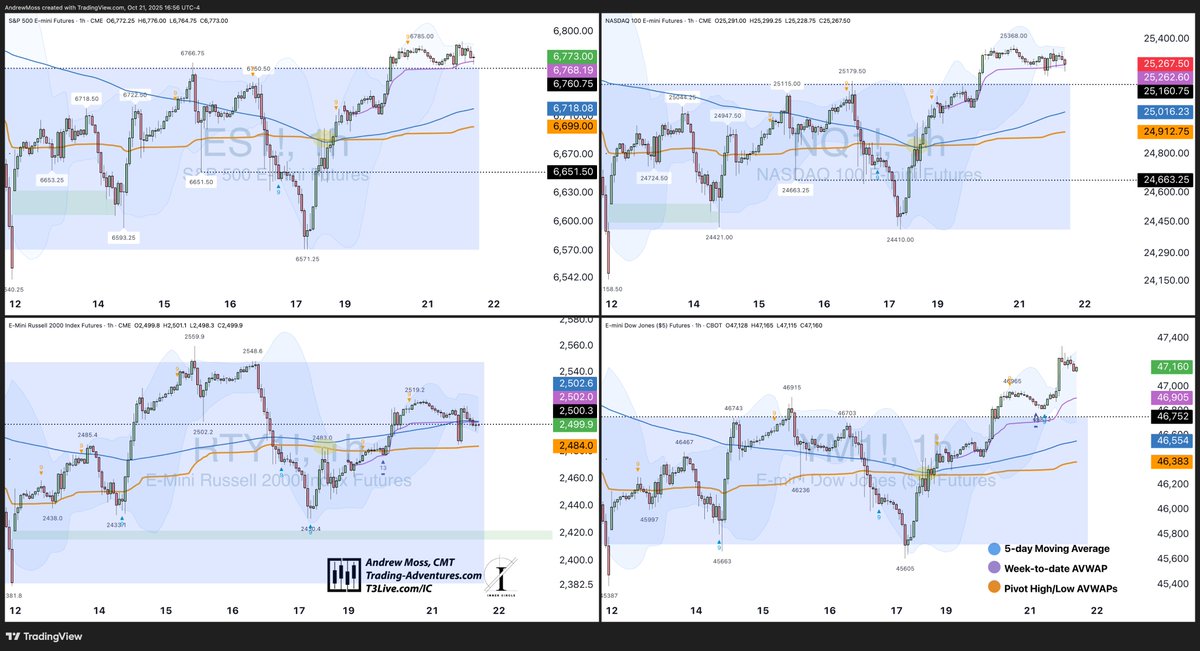
$SPY and $QQQ finished flat, but futures held above last week’s range and the week-to-date AVWAP.
Still constructive.
$SPY and $QQQ finished flat, but futures held above last week’s range and the week-to-date AVWAP.
Still constructive.
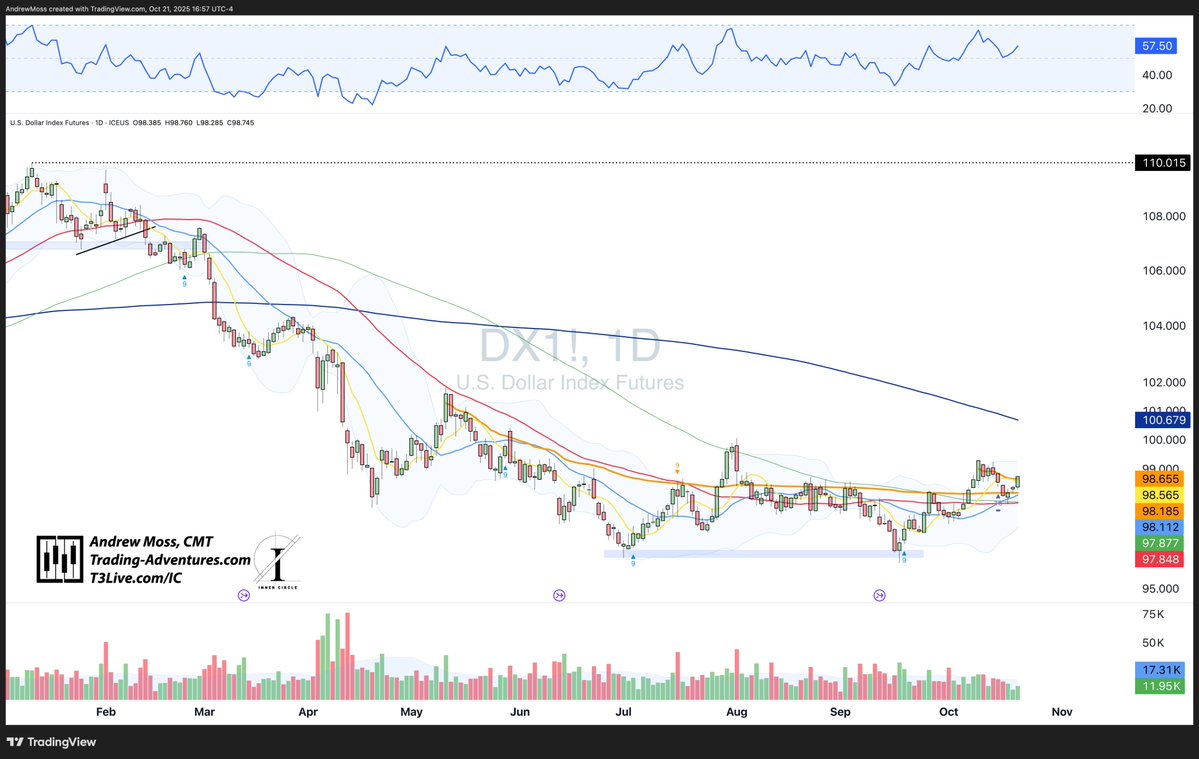
$DXY up for the 3rd day.
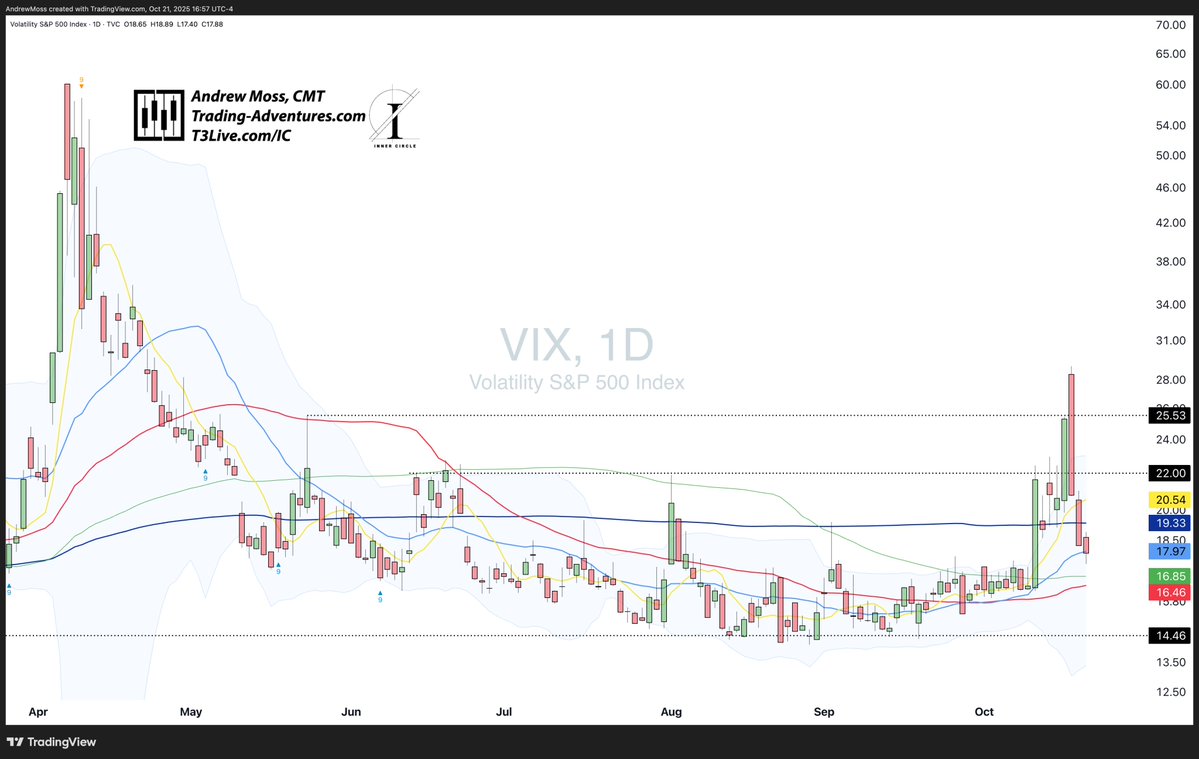
$VIX down again—vol holding steady.
$VIX down again—vol holding steady.
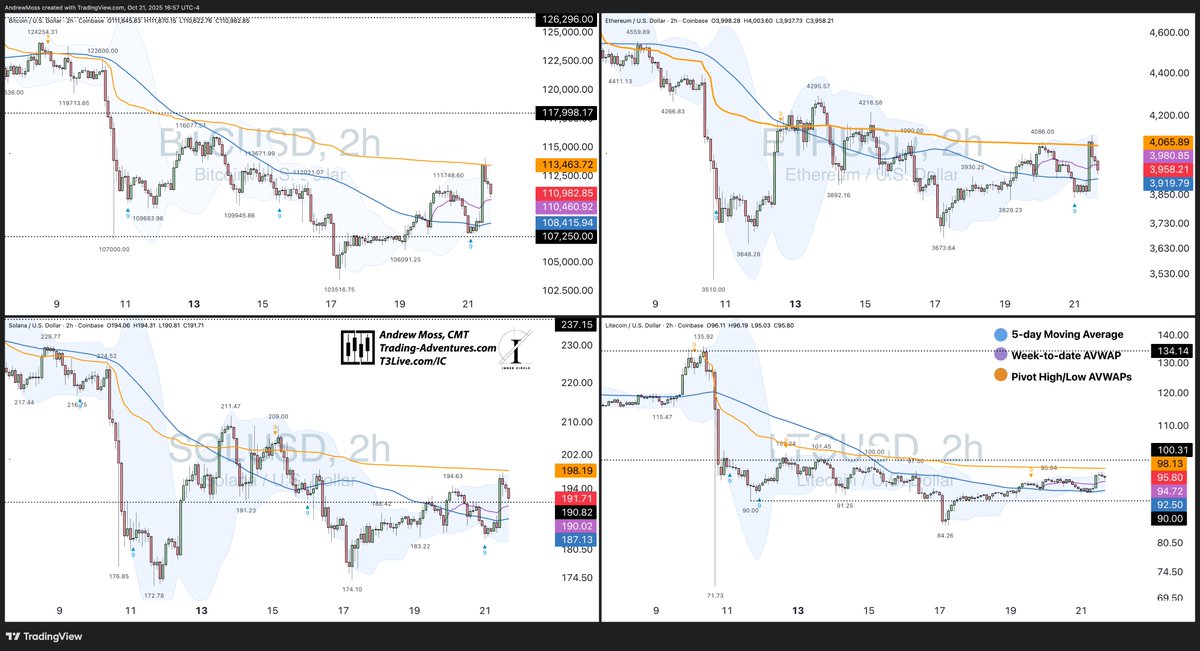
Crypto hit resistance at anchored VWAPs🟠 from recent pivot highs.
$BTC, $ETH, $SOL all reversed. No trend change yet.
$BTC, $ETH, $SOL all reversed. No trend change yet.
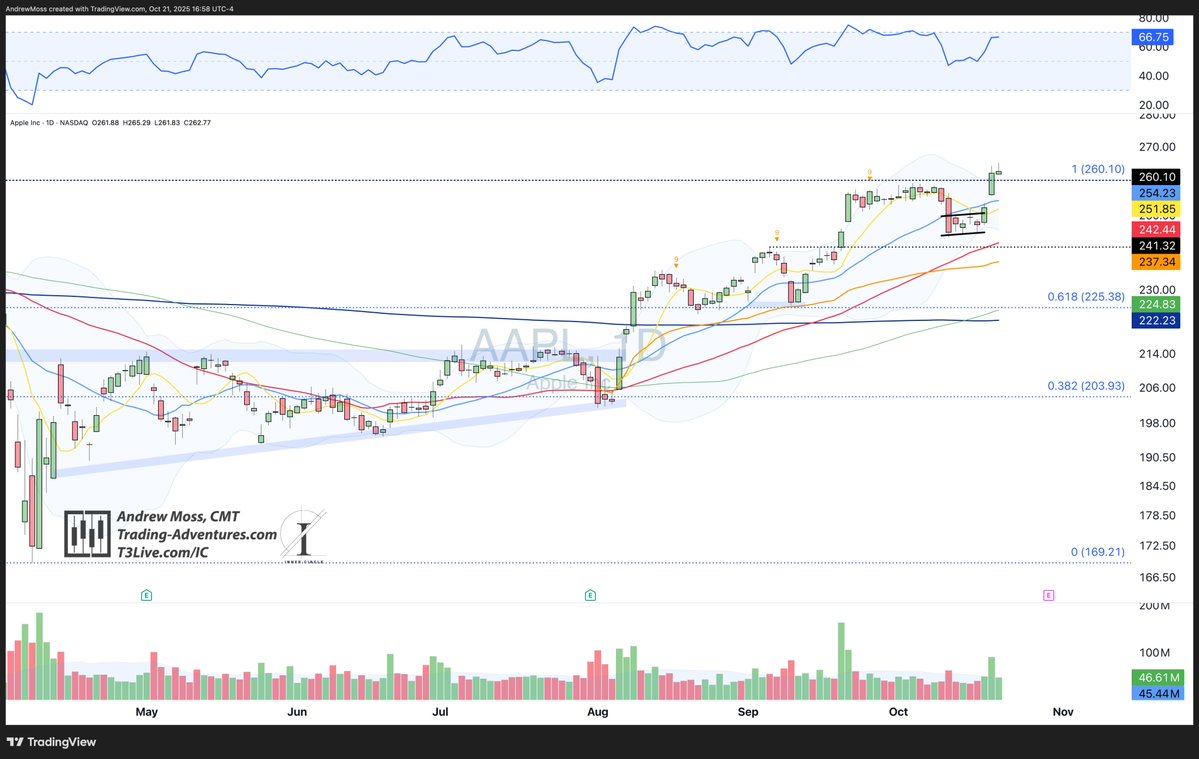
$AAPL held most of yesterday’s breakout. Closed at $262.77.
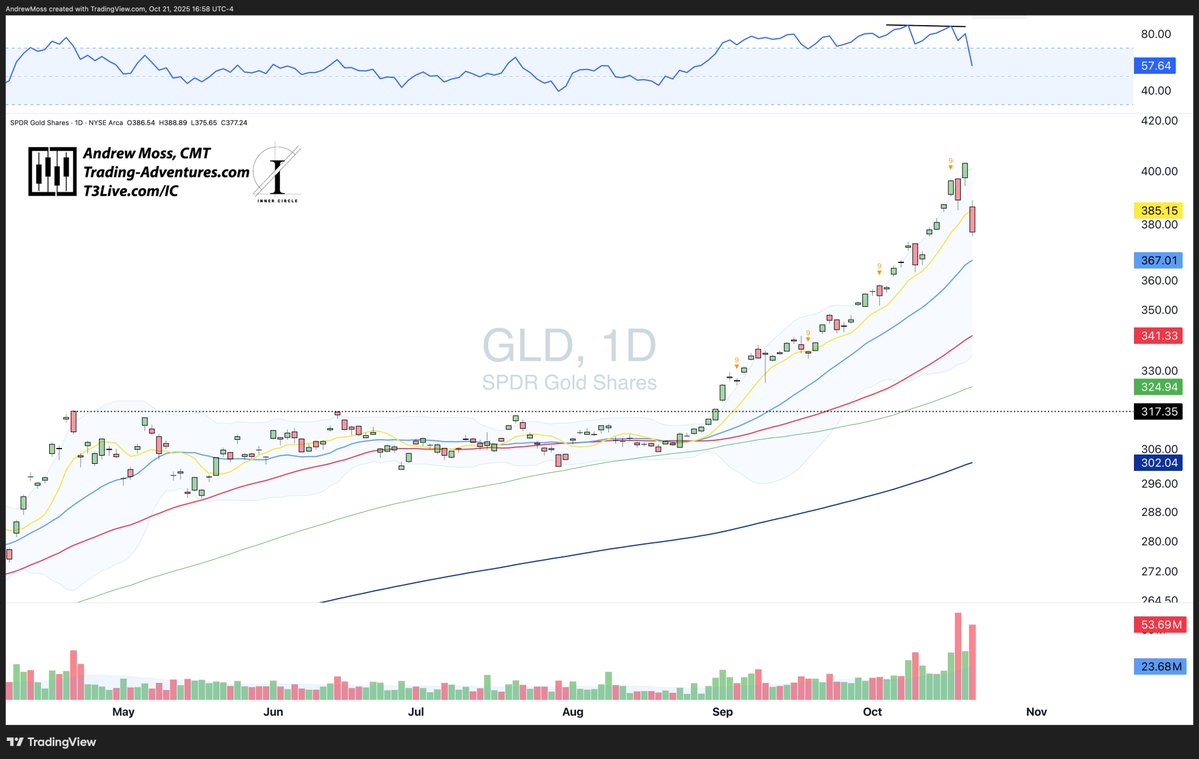
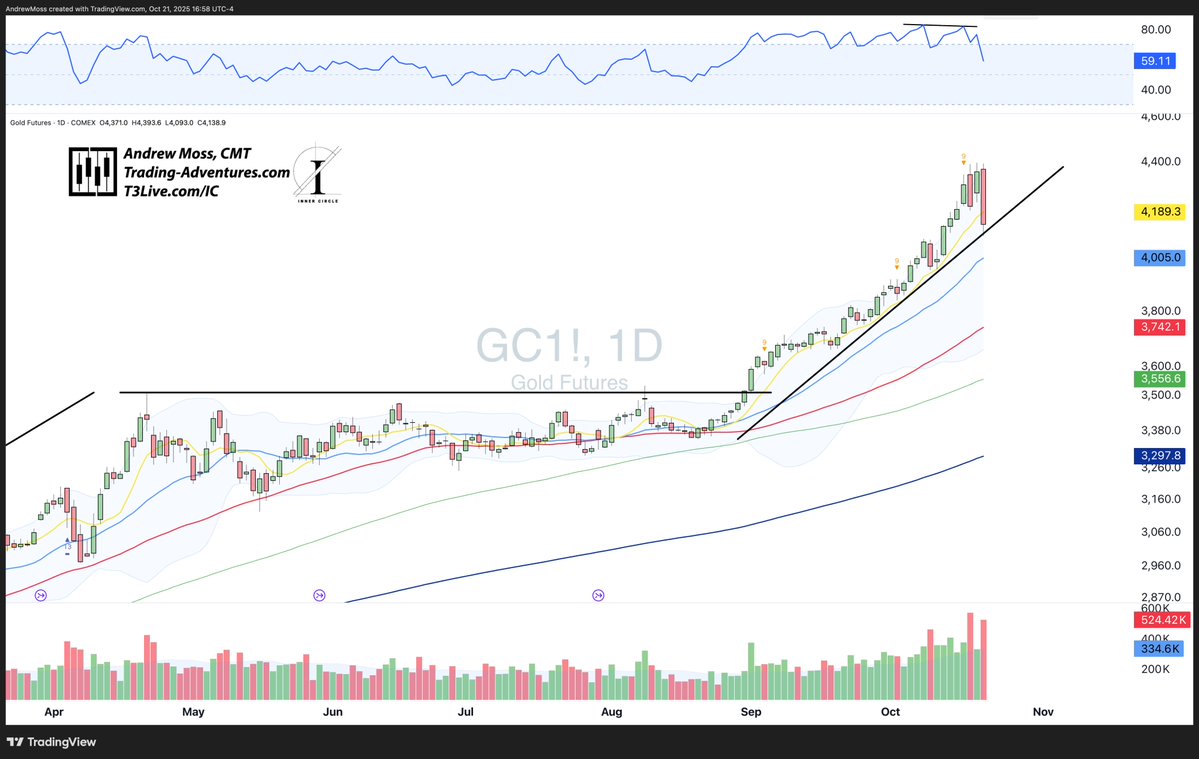
$GLD saw a sharp reversal—down 6.5% today. $GC_F -5.06%
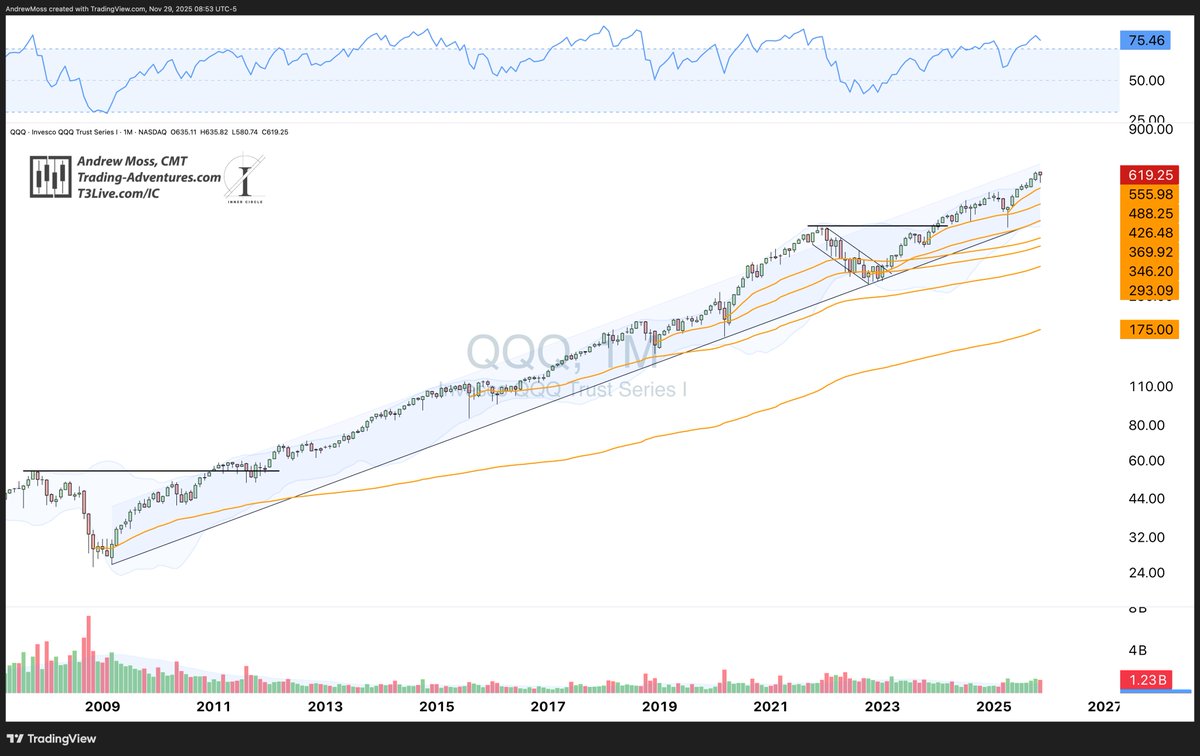
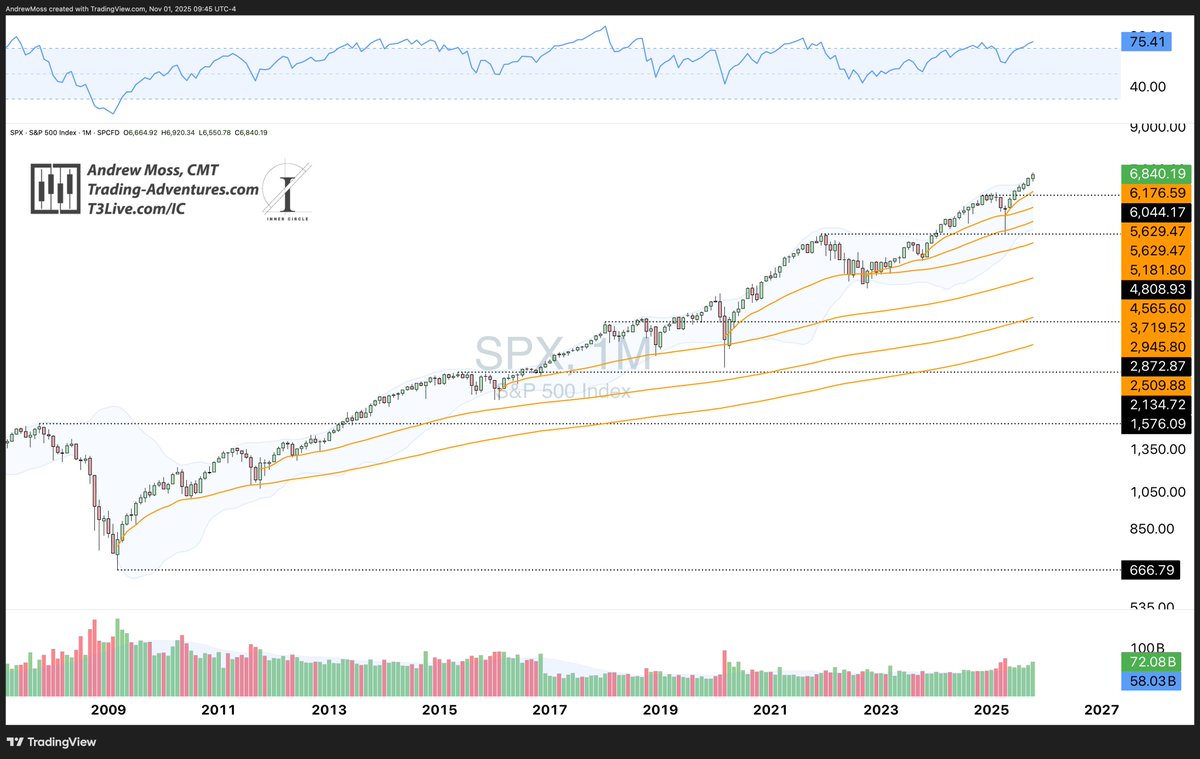
Clear change in character after the recent run.
Clear change in character after the recent run.
Earnings misses -
$NFLX down $66 (–5.5%) after hours.
$TXN down 8% after a dismal report.
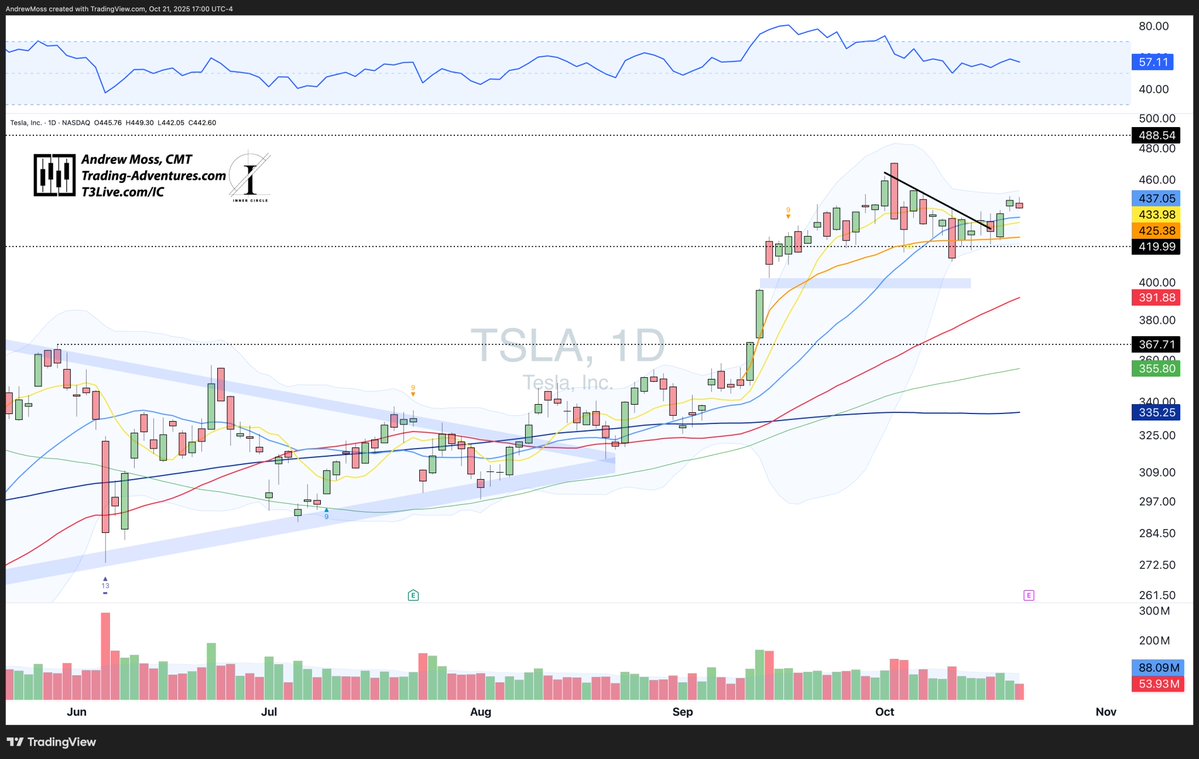
$TSLA reports tomorrow after the close. The chart is constructive - holding above all key MAs. But, that could change on the report.
$NFLX down $66 (–5.5%) after hours.
$TXN down 8% after a dismal report.
$TSLA reports tomorrow after the close. The chart is constructive - holding above all key MAs. But, that could change on the report.
Be ready. Know your exposure to names that are reporting.
The market’s still holding—but catalysts are in play.
The market’s still holding—but catalysts are in play.
• • •
Missing some Tweet in this thread? You can try to
force a refresh